 Open Access Article
Facile synthesis of aqueous-dispersed luminescent nanosheets from non-layered lanthanum hexaboride†
Saju K. John and
Aji A. Anappara *
*
Photonic Materials and Devices Laboratory, Department of Physics, National Institute of Technology Calicut (NITC), Kerala 673601, India. E-mail: aji@nitc.ac.in
First published on 27th August 2020
Abstract
Two-dimensional nanosheets of non-layered materials have been considered as inaccessible through exfoliation techniques, due to their intrinsic three-dimensional lattice structure. Herein we report the successful synthesis of nanosheets from non-layered, lanthanum hexaboride through a facile, solution-assisted, surfactant-free, sonication. The morphological studies clearly show the presence of nanosheets having thickness of a few nanometers, and having lateral dimensions of several hundreds of nanometres. The as-fabricated nanosheets were found to be rich in hydroxyl groups, and hence exhibit excellent dispersion stability in water. The aqueous-dispersed nanosheets demonstrate excitation-wavelength dependent luminescence in the blue-cyan region, when excited with UV-light.
I. Introduction
Two-dimensional (2D) materials or nanosheets have attracted intense research interest due to their unique electrical, optical, mechanical and thermal properties. Triggered by the successful exfoliation of graphene from graphite by Geim and Novoselov in 2004, 2D-materials have become a topical subject of research.1–3 In the past decade, layered van der Waals structures such as transition metal dichalcogenides (TMDs), transition metal trichalcogenides, layered metal oxides, MXenes, hexagonal boron nitride (h-BN), layered double hydroxides (LDHs), and black phosphorus (BP) have been exfoliated to obtain 2D materials.4–11 These materials range from metals to insulators, making them suitable for many applications.12 Recently researchers have extended their efforts to exfoliate layered ionic compounds such as metal diborides.13–16 Towards this direction, research has been centred on the delamination of non-layered materials, such as metal oxides (Fe2O3, Mn3O4, ZnMn2O4, WO3, etc.) and metal chalcogenides (CdS, PbS, Cu9S5, CuInS2, etc.) into 2D structures.12,17–20 In contrast to layered materials, non-layered materials generally have an intrinsic, three-dimensional bonding network formed by covalent bonds; hence were considered as difficult to realize through simple exfoliation techniques.12,21 If 2D-nanosheets are realized from non-layered bulk materials, the surface of the nanosheets will be rich in unsaturated dangling bonds, thus representing a highly active surface, for applications in energy storage and photodetectors.11,12 Also, the dangling bonds on the surface and intrinsic crystal distortion may render them with unique optical traits, in comparison to their bulk counterparts.Recently, Roshni Ramachandran et al., have reported the top-down nanostructuring of strontium hexaboride (SrB6), via lithiation. They have reported the protocol for the direct lithiation of SrB6 using n-butyl lithium followed by the reactive disassembly of Li–SrB6 into nanoparticles using water. They have also applied similar method for the delamination of lanthanum hexaboride. Even though, these reports thoroughly analyse the structural and elemental properties of the intermediates and nanostructures, the optical properties of the materials in their nano-forms were unexplored. Also, synthesis method follows a lengthy procedure taking nearly a couple of weeks' time.21,22 Lanthanum hexaboride (LaB6) is a non-layered metal hexaboride, which is mainly used in electron emission sources because of its low work function, high thermal stability, and resistance against oxidation, hydrolysis, and acid environments. Despite many useful properties, new applications of this refractory material are constrained by the challenges in processing the material. The nanostructuring of the material would enable the use of the material for the fabrication of nanodevices, using solution-based techniques such as spray coating, ink jet printing etc.21 LaB6 possesses cubic crystal structure with metal ions and boron octahedra in the cubic sites.23–25 Here we report the delamination of LaB6, through simple, solution-based method incorporating probe sonication and shear force grinding.
II. Experimental details
Lanthanum hexaboride bulk powder (particle size < 10 μm) was purchased from Sigma Aldrich, India and was used without further purification. Deionized water provided by Ultrapure Millipore water – Type 1, with a resistivity of 18.2 MΩ cm, was used throughout the experiments.In a typical experiment, 200 mg of pristine LaB6 bulk powder was taken in an agate mortar and was made into a paste with water, and was ground for 45 min. The paste was then transferred into a beaker, and 200 ml water was added to it. The suspension was then subjected to ultrasonic waves using a probe sonicator for 4 h (amplitude: 40%, 10 s ON/OFF pulse). A water bath kept at a temperature ∼30 °C was used to avoid overheating of the sample during sonication. The sample thus obtained was allowed to settle down for overnight, and the upper portion was centrifuged at 1500 rpm for 30 min and the clear supernatant was collected for further studies. A part of this dispersion was kept for liquid-phase characterization, and the other part was lyophilized to obtain a white coloured powder (note that the bulk LaB6 powder appears to be violet in colour). The visible colour change suggests the presence of some functional group(s) in the sample.13,16 As explained in the forthcoming sections, the dispersed nanosheets were observed to be rich in hydroxyl functional groups.
The morphology of the pristine LaB6 powder samples were analysed by Field Emission Scanning Electron Microscopy, FE-SEM (HITACHI-SU6600, Hitachi, Japan). The X-ray diffraction (XRD) pattern of the bulk LaB6 sample was collected using Rigaku Miniflex 300 X-ray Diffractometer (with CuKα radiation of wavelength λ = 1.5406 Å). PerkinElmer, Model: LS-55 Fluorescence Spectrometer was used to obtain the photoluminescence (PL) spectra of the bulk LaB6 samples. The sonication was done using the Sonics Vibracell VC 750 probe sonicator with a 13 mm probe. The nanosheet dispersion was lyophilized by using Labconco, Freezone 1 Freeze Dry System. Transmission Electron Microscopy (TEM) and the Selected Area Electron Diffraction (SAED) of the nanosheet dispersion were performed by the transmission electron microscope Jeol-JEM 2100. The infrared absorption of LaB6 bulk powder samples (obtained by the lyophilization of the nanosheet dispersion) were taken using Fourier Transform Infrared (FTIR) Spectrometer (PerkinElmer-Spectrum Two) in the Attenuated Total Reflection (ATR) mode. And that of LaB6 nanosheet powder samples (obtained by the lyophilization of the nanosheet dispersion) were taken using FTIR Spectrometer (PerkinElmer-Spectrum One) in the transmittance mode. The absorption of the nanosheet dispersion was studied by using UV-vis spectrometer (Model: Shimadzu – UV-2600). The photoluminescence of the aqueous-dispersed nanosheets was analysed by the spectrofluorometer, PerkinElmer-LS45.
III. Results and discussion
Pristine LaB6 powder was well characterized for its morphology, purity and crystallinity by the following FESEM and XRD respectively. The FE-SEM image, as displayed in Fig. S1† shows that the bulk LaB6 powder sample consists of particles of size ranging from a few hundreds of nanometres to several micrometers. The XRD analysis of LaB6 powder was carried out using Rigaku Miniflex 300 X-ray Diffractometer. The XRD pattern obtained is included in Fig. S2,† confirms the crystallinity of the sample. The 2θ values corresponding to the peaks was found to be in good agreement with the typical (ICDD data card no. 01-083-9724) values.The photoluminescence of bulk LaB6 powder samples were investigated by fluorescence spectroscopy. The emission spectra of the bulk LaB6 samples were collected by exciting the sample with different wavelengths ranging from 250 nm to 650 nm in steps of 50 nm. The spectra are given in Fig. S3,† which shows that the fluorescence emission of the bulk LaB6 sample is extremely weak, compared to the background noise.
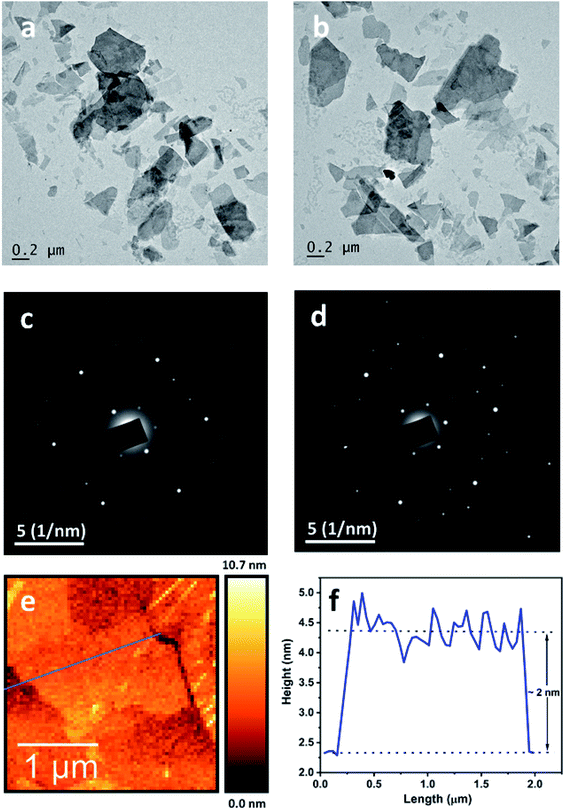
The morphology of the nanostructures in the dispersion was probed using transmission electron microscopy (TEM). The samples for TEM were prepared by depositing a few drops of the aqueous dispersion on a holey copper grid supported with a carbon film. The TEM images are displayed in Fig. 1a and b, which reveal that the lateral dimensions of the nanosheets are a few hundreds of nanometres. The structural characteristics of the nanosheets were investigated by obtaining selected area electron diffraction pattern (SAED) from different regions of various nanosheets. We observed a pattern of diffraction spots showing crystalline nature for individual nanosheets (as in Fig. 1c and d).26 However, the XRD analysis of the powder obtained by the lyophilisation of the nanosheet dispersion indicated an amorphous nature, as shown in Fig. S6.† This may be due to the disruption of the long-range order caused by the hydroxyl functionalization of the nanosheets (as explained in the discussion of FTIR spectroscopy).27 Atomic force microscopy (AFM) was used to measure the thickness of the nanosheets in the dispersion. The AFM samples were prepared by spin coating nanosheet dispersion on freshly cleaved mica sheets. Fig. 1e shows an AFM scan, which clearly reveals a sheet-like morphology and the corresponding height profile along the line drawn across the nanosheets (Fig. 1f); indicates a thickness of about ∼2 nm. In addition to this, Fig. S4(b) (ESI)† displays the HR-TEM image of a LaB6 nanosheet with, the edge of the sheet giving a clear picture about the number of layers and the highlighted image in the inset shows the presence of 9 layers in the nanosheet and the nanosheet thickness was measured to be 3.1 nm. Thus, we understand that the thickness of the nanosheets to be of the order of a few nanometres.
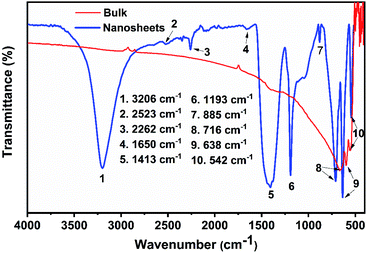
To get an idea of the functional groups present in the nanosheets, the infrared absorption of nanosheet powder (obtained by the lyophilization of the nanosheet dispersion) was collected using an FTIR Spectrometer. The infrared data of the bulk LaB6 was also collected for comparison. The spectrum given in Fig. 2 for pristine LaB6 exhibits a strong band at 666 cm−1 and two weak bands at 598 cm−1 and 553 cm−1. The strong band at 666 cm−1 may corresponds to the La–B bond and the two weak bands due to B–B in-plane stretching modes.13 The spectrum of the LaB6 nanosheets consists of bands at 3206 cm−1, 2523 cm−1, 2262 cm−1, 1650 cm−1, 1413 cm−1, 1193 cm−1, 885 cm−1 in addition to the three bands present in the spectrum of bulk LaB6 powder. The broad band at 3200 cm−1 is due to the B–OH stretching mode.28 Also, the band at 1193 cm−1 originates from the in-plane B–OH deformation.29 This indicates the presence of OH functional groups in the nanosheets; which explains the dispersion stability of the nanosheets in water. The weak band at 2523 cm−1 is likely due to B–H stretching.14 The moderate band at 2262 cm−1 is assigned to the B–H symmetric in phase mode.30 The weak band at 1650 cm−1 can be ascribed to hydrogen motion in B–H–B bridge. The sharp band at 885 cm−1 can be assigned to the out of plane bending of the B–O–H bond. The band at 1420 cm−1 is assigned to the B–O stretching mode.13,29–31 The hydroxyl ligands could be contributed by the water molecules of the aqueous medium used for the exfoliation. The high-temperature zones formed at the implosion sites (cavitation) during the ultrasonication are expected to facilitate chemical modification.13
 | ||
| Fig. 2 FTIR spectrum of the powdered sample of nanosheets (prepared by lyophilization), as represented by the blue curve, along with that of the bulk LaB6 powder (red spectrum). | ||
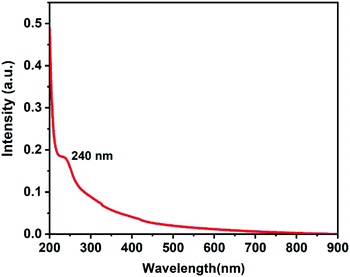
UV-vis absorption spectroscopy was used to obtain the absorption spectrum of aqueous dispersion of LaB6 nanosheets with DI water as the reference. As evident in Fig. 3, the absorption spectrum was found to have no significant absorption in the visible region, but exhibits a shoulder peak at 240 nm. The introduction of hydroxyl functional groups in the network of boron and lanthanum might introduce non-bonding orbitals (n) due to the presence of unpaired electrons in the oxygen atom. The boron-lanthanum network can contain only bonding orbitals (σ, π) and anti-bonding orbitals (σ*, π*). The peak at 240 nm may be due to the π → π* transition.13,32
 | ||
| Fig. 3 The absorption spectrum of the aqueous dispersion of LaB6 nanosheets, collected by using DI water as the reference medium. | ||
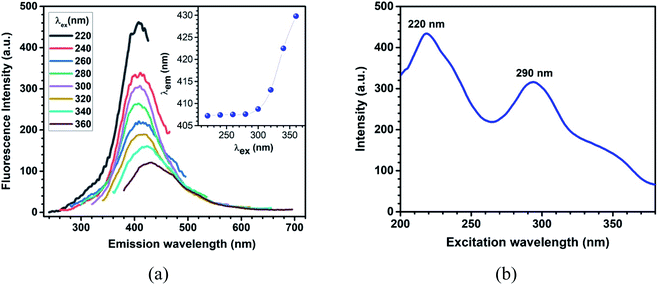
The emission traits of the aqueous dispersion of LaB6 nanosheets samples were studied by using fluorescence spectroscopy. The fluorescence spectra were collected by exciting the sample at different wavelengths ranging from 220 to 360 nm (with a step of 20 nm) as shown in Fig. 4a. When the sample was excited at 220 nm, the emission was observed at 408 nm. The excitation wavelength was increased by steps of 20 nm and corresponding emission was recorded. The emission peak remained at the same wavelength (∼407.5 nm), for excitation wavelengths up to 280 nm; and as the excitation wavelength is red-shifted, the emission peak also exhibited a red-shift, with a significant decrease in its intensity. The photoluminescence intensity becomes less significant for excitation wavelengths longer than 360 nm. The inset of Fig. 4a shows the peak position of fluorescence spectrum corresponding to different excitation wavelengths, which clearly indicate excitation-dependent emission behaviour, which is commonly observed in chemically-modified metal diboride nanosheets dispersed in water.13,18 Based on the physico-chemical characterisation and the optical properties, the energy level structure for the nanosheets has been proposed, which is included in Fig. S8.† The UV-vis absorption of the nanosheets take place at different energy states that occur due to the hybridization of the functional groups with the boron network of the nanosheets. Meanwhile, the emission take place from such multiple energy trap-states or defect levels, leading to the red-shift of PL. Fig. 4b displays the excitation spectrum of the sample collected by fixing the emission wavelength at 408 nm; which shows two peaks at 220 nm, and 290 nm. The excitation at 220 nm, may be due to the π → π* transition, the peak at 290 nm may be related to the n → π* transition.32
Based on the morphological and elemental analyses, we propose a possible mechanism that may have resulted in the delamination of LaB6 nanosheets. Here we have incorporated probe sonication (ultrasonication) and shear force grinding for the delamination of LaB6 nanosheets. The principle behind the working of ultrasonication is the cavitation effect. When a liquid is exposed to intense ultra sound, the waves propagate through the liquid causing an alternating of high-pressure and low-pressure cycles that is dependent on the frequency of the electric generator. During the low-pressure cycle, high-intensity small vacuum bubbles (also called cavitation bubbles) are created, as the liquid vapor pressure are achieved. When the bubbles reach a certain size, they collapse strongly during a high-pressure cycle. During this implosion, very high pressures, high temperatures, and speed liquid jets are locally generated. This phenomenon is called cavitation.33,34 The high-temperature zones formed at the implosion sites (cavitation) during the ultrasonication are expected to facilitate chemical modification.13 The hydroxyl ligands could be contributed by the water molecules of the aqueous medium used for the exfoliation.13 The attachment of the functional groups on the material is responsible for the weakening of the bonds and the further delamination of the material. We have observed results in the delamination of layered metal diborides such as titanium diboride (TiB2).16
We here make a comparison of the present report with the previous report of R. Ramachandran.22 According to the report of R. Ramachandran, they have synthesized LaB6 nanosheets of ∼1–4 nm thickness range using a lithium ion insertion–exfoliation approach and the nanosheets are not chemically modified. The main differences of our work with that mentioned above are: (i) here we use a facile synthesis method incorporating probe sonication and shear force grinding and the synthesis can be completed in 24 hours, (ii) the nanosheets obtained are chemically modified LaB6 nanosheets, containing functional groups (as suggested by FTIR) and (iii) the nanosheets obtained are photoluminescent. To the best of our knowledge this is the first report on chemically modified and photoluminescent LaB6 nanosheets.
IV. Conclusions
In summary, a liquid-phase exfoliation technique incorporating probe sonication and shear force grinding was used to realize nanosheets of non-layered lanthanum hexaboride, in the aqueous medium. The TEM and AFM analyses of the dispersion revealed that the nanosheets have lateral dimensions of a few hundreds of nanometers and the thickness of the order of a few nanometres. The infrared spectrum of the nanosheets indicated the presence of hydroxyl functionalization of nanosheets. The nanosheet when dispersed in water, exhibited excitation wavelength-dependent photoluminescence behaviour, even though the bulk counterpart lacks any emission traits. To the best of our knowledge, this is the first successful synthesis of luminescent LaB6 nanosheet dispersion in the aqueous medium through solvent-assisted ultrasonication. We believe that the delamination of LaB6 using the facile technique is an additional step in the realization of 2D nanosheets from non-layered materials.Conflicts of interest
There are no conflicts of interest to declare.Acknowledgements
The authors thank Dr Vari Sivaji Reddy (Dept. of Physics, NITC), Dr Lakshmi C. (Dept. of Chemistry, NITC), Dr G. Unnikrishnan (Dept. of Chemistry, NITC), Dr Sindhu S. (Dept. of Nanoscience and Technology, University of Calicut), Director, Sophisticated Analytical Instrumentation Facility (SAIF) at MG University, Kottayam, and Director, Sophisticated Test and Instrumentation Centre (STIC) at Cochin University of Science and Technology (CUSAT) for providing experimental facilities. Fruitful discussions with Dr P. Parameswaran (Dept. of Chemistry, NITC) are also kindly acknowledged.References
- K. S. Novoselov, A. K. Geim, S. V. Morozov, D. Jiang, Y. Zhang, S. V. Dubonos, I. V. Grigorieva and A. A. Firsov, Science, 2004, 306, 666–669 CrossRef CAS PubMed.
- A. K. Geim and K. S. Novoselov, Nat. Mater., 2007, 6, 183–191 CrossRef CAS PubMed.
- C. N. R. Rao, K. Biswas, K. S. Subrahmanyam and A. Govindaraj, J. Mater. Chem., 2009, 19, 2457–2469 RSC.
- R. M. Ballesté, C. G. Navarro, J. G. Herrero and F. Zamora, Nanoscale, 2011, 3, 20–30 RSC.
- S. Z. Butler, S. M. Hollen, L. Cao, Y. Cui, J. A. Gupta, H. R. Gutiérrez, T. F. Heinz, S. S. Hong, J. Huang, A. F. Ismach, E. J. Halperin, M. Kuno, V. V. Plashnitsa, R. D. Robinson, R. S. Ruoff, S. Salahuddin, J. Shan, L. Shi, M. G. Spencer, M. Terrones, W. Windl and J. E. Goldberger, ACS Nano, 2013, 7, 2898–2926 CrossRef CAS PubMed.
- G. R. Bhimanapati, Z. Lin, V. Meunier, Y. Jung, J. Cha, S. Das, D. Xiao, Y. Son, M. S. Strano, V. R. Cooper, L. Liang, S. G. Louie, E. Ringe, W. Zhou, S. S. Kim, R. R. Naik, B. G. Sumpter, H. Terrones, F. Xia, Y. Wang, J. Zhu, D. Akinwande, N. Alem, J. A. Schuller, R. E. Schaak, M. Terrones and J. A. Robinson, ACS Nano, 2015, 9, 11509–11539 CrossRef CAS PubMed.
- C. Tan, X. Cao, X.-J. Wu, Q. He, J. Yang, X. Zhang, J. Chen, W. Zhao, S. Han, G.-H. Nam, M. Sindoro and H. Zhang, Chem. Rev., 2017, 117, 6225–6331 CrossRef CAS PubMed.
- I. Meric, M. Y. Han, A. F. Young, B. Ozyilmaz, P. Kim and K. L. Shepard, Nat. Nanotechnol., 2008, 3, 654–659 CrossRef CAS PubMed.
- W. Zhang, Q. Wang, Y. Chen, Z. Wang and A. T. S. Wee, 2D Mater., 2016, 3, 022001 CrossRef.
- Y. Yang, H. Hou, G. Zou, W. Shi, H. Shuai, J. Lib and X. Ji, Nanoscale, 2019, 11, 16–33 RSC.
- F. Wang, Z. Wang, T. A. Shifa, Y. Wen, F. Wang, X. Zhan, Q. Wang, K. Xu, Y. Huang, L. Yin, C. Jiang and J. He, Adv. Funct. Mater., 2017, 27(19), 1603254 CrossRef.
- P. Tao, S. Yao, F. Liu, B. Wang, F. Huang and M. Wang, J. Mater. Chem. A, 2019, 7, 23512–23536 RSC.
- S. K. Das, A. Bedar, A. Kannan and K. Jasuja, Sci. Rep., 2015, 5, 10522 CrossRef CAS PubMed.
- H. Nishino, T. Fujita, N. T. Cuong, S. Tominaka, M. Miyauchi, S. Iimura, A. Hirata, N. Umezawa, S. Okada, E. Nishibori, A. Fujino, T. Fujimori, S. Ito, J. Nakamura, H. Hosono and T. Kondo, J. Am. Chem. Soc., 2017, 139, 13761–13769 CrossRef CAS PubMed.
- H. Nishino, T. Fujita, A. Yamamoto, T. Fujimori, A. Fujino, S. I. Ito, J. Nakamura, H. Hosono and T. Kondo, J. Phys. Chem., 2017, 121, 10587–10593 CAS.
- S. K. John and A. A. Anappara, New J. Chem., 2019, 43, 9953–9960 RSC.
- Y. Dou, L. Zhang, X. Xu, Z. Sun, T. Liao and S. X. Dou, Chem. Soc. Rev., 2017, 46, 7338–7373 RSC.
- J. Guo, Y. Cao, R. Shi, G. I. N. Waterhouse, L.-Z. Wu, C.-H. Tung and T. Zhang, Angew. Chem., Int. Ed., 2019, 58, 8443–8777 CrossRef CAS PubMed.
- D. Wang, W. Zhou, R. Zhang, J. Zeng, Y. Du, S. Qi, C. Cong, C. Ding, X. Huang, G. Wen and T. Yu, Adv. Mater., 2018, 30, 1803569 CrossRef PubMed.
- G. Guan, J. Xia, S. Liu, Y. Cheng, S. Bai, S. Y. Tee, Y.-W. Zhang and M.-Y. Han, Adv. Mater., 2017, 29, 1700326 CrossRef PubMed.
- R. Ramachandran and T. T. Salguero, Inorg. Chem., 2018, 57, 4–7 CrossRef CAS PubMed.
- R. Ramachandran, PhD thesis, University of Georgia, 2017.
- C. Mroz, Am. Ceram. Soc. Bull., 1995, 74, 164–165 CAS.
- T. Lundström, Pure Appl. Chem., 1985, 57, 1383–1390 Search PubMed.
- J. M. Lafferty, J. Appl. Phys., 1951, 22, 299–309 CrossRef CAS.
- D. B. Williams and C. B. Carter, Transmission Electron Microscopy: A Text Book for Material Science, Springer US, 2009, pp. 273–274 Search PubMed.
- M. J. McAllister, J. Li, D. H. Adamson, H. C. Schniepp, A. A. Abdala, J. Liu, M. Herrera-Alonso, D. L. Milius, R. Car, R. K. Prud'homme and I. A. Aksay, Chem. Mater., 2007, 19, 4396–4404 CrossRef CAS.
- L. Z. Zhang, Z. F. Wang, S. X. Du, H. J. Gao and F. Liu, Phys. Rev. B: Condens. Matter Mater. Phys., 2014, 90, 161402 CrossRef CAS.
- H. T. Tsou and W. Kowbel, Surf. Coat. Technol., 1996, 79, 139–150 CrossRef CAS.
- W. Shin, S. Calder, O. Ugurlu and S. Girshick, J. Nanopart. Res., 2011, 13, 7187–7191 CrossRef CAS.
- P. Larkin, Infrared and Raman Spectroscopy; Principles and Spectral Interpretation, Elsevier Science, 2011 Search PubMed.
- J. Clark, UV-visible absorption spectra, 2007, available at, http://www.chemguide.co.uk/analysis/uvvisible/theory.html Search PubMed.
- V. Stengl, J. Henych, M. Slusna and P. Ecorchard, Nanoscale Res. Lett., 2014, 9, 167 CrossRef PubMed.
- J.-L. Capelo-Martínez, Ultrasound in chemistry: analytical applications, Wiley-VCH, Weinheim, 2009 Search PubMed.
Footnote |
| † Electronic supplementary information (ESI) available: Characterization of LaB6 powder by FESEM, XRD, photoluminescence spectra of pristine LaB6 powder, more TEM images of the nanosheets, XRD spectrum of LaB6 nanosheets obtained using lyophilised powder; and the proposed energy level scheme for the nanosheets. See DOI: 10.1039/d0ra05611a |
| This journal is © The Royal Society of Chemistry 2020 |


