 Open Access Article
Synthesis of a novel arginine-modified starch resin and its adsorption of dye wastewater
Hao Zhang ac,
Panlei Wangac,
Yi Zhang*a,
Bowen Chengb,
Ruoying Zhua and
Fan Lia
aSchool of Textile Science and Engineering, Tiangong University, 300387, Tianjin, China. E-mail: tianjinzhangyi@126.com
bState Key Laboratory of Separation Membranes and Membrane Processes, Tiangong University, 300387, China. E-mail: bowen15@tiangong.edu.cn
cTianjin Key Science and Technology Program Foundation, Tianjin, 300387, China. E-mail: zhanghaoyangyong@163.com
First published on 11th November 2020
Abstract
In this work, corn starch (St) was firstly grafted with polyacrylamide (PAM) to obtain StAM, which was subsequently immobilized with arginine to obtain a guanidine-containing starch-based resin, StAM–Arg. The synthesized products were characterized via Fourier transform infrared spectroscopy (FT-IR), 13C-NMR nuclear magnetic resonance (13C-NMR), scanning electron microscopy (SEM), X-ray diffraction (XRD), gel permeation chromatography (GPC), X-ray photoelectron spectroscopy (XPS) and thermogravimetric analysis (TGA). StAM–Arg exhibited a significantly enhanced adsorption capacity for acid fuchsin (AF), acid orange G (AOG), and acid blue 80 (AB80) compared with zeolite, diatomite, St and StAM, and it also exhibited broad-spectrum adsorption for different dyes. Weak acidic conditions were favorable for the resin to adsorb acid dyes. The decolorization rate (DR) by StAM–Arg for mixed wastewater reached 82.49%, which was higher than that of activated carbon (DR = 58.09%). StAM–Arg showed high resistance to microbial degradation, resulting in significantly improved structural stability for the resin. Its antibacterial rate (AR) for E. coli was up to 99.73%. After 7 days in simulated natural water, the weight loss ratio (WR) of StAM–Arg was 14.5%, which was much lower than that of St (WR = 66.53%). The introduced guanidine groups were considered to be the major reason for the observed improvements. Furthermore, the cationic guanidine could trap the acid dyes via ion-exchange reactions, while effectively inhibiting or eliminating the growth of bacteria on the adsorbent surface. The above advantages, including good dyestuff adsorption properties, high structural stability and prolonged service life, make StAM–Arg overcome the inherent drawbacks of the existing natural polymer adsorbents and have good application prospect in the treatment of textile wastewater.
1. Introduction
The textile printing and dyeing industry produces a large amount of wastewater during the manufacturing process due to its technological requirements. Textile wastewater contains many refractory and poisonous compounds, including various dyes and heavy metal ions, which cause permanent pollution to the environment, and seriously threaten human health once discharged directly. Thus, presently, the textile printing and dyeing industry is considered to be one of the most polluting industries.1–5The adsorption method has been widely used in the treatment of textile wastewater because of its simple operation, low cost and high efficiency.6,7 Among the various absorbents, starch as a natural polymer has attracted much attention because of its advantages such as low price, high yield, easy access and high practicality. However, it also has drawbacks, including relatively low adsorption capabilities and slow adsorbing rates.8–10 Moreover, similar to other natural adsorbents, starch is easily degraded by microorganisms in wastewater due to its polysaccharide structure, resulting in the poor stability and short service life of the adsorbent. Thus, these defects limit the application of starch in the treatment of industrial wastewater, which makes it difficult to replace the conventional adsorption materials.11–13 Therefore, thus far, the research on starch-based adsorption materials have been mainly focused on two aspects as follows: (a) improving their combination ability with dyestuffs to increase their adsorbing capacity and (b) improving their chemical and antibacterial activity to extend their service life.14,15
In recent years, there have been many studies based on the preparation of antimicrobial starch resins.16–20 Zhou et al.21 prepared cross-linked modified cassava starch with hydroxypropyl trimethyl ammonium chloride chitosan (HACC), and its AR against Staphylococcus aureus reached 95.5%. Fang et al.22 used epichlorohydrin as a bonding agent to graft guanidine oligomers (PHMG) onto starch molecules and dissolve them in polyvinyl alcohol solution (PVA) to synthesize antibacterial gels (S-pva), which had an excellent AR against E. coli and Staphylococcus aureus. However, most previous works have been based on synthetic antibacterial agents, which have disadvantages such as high toxicity, low heat resistance, high volatility, and poor chemical stability. Therefore, these antibacterial materials are always expensive and produced using toxic chemicals, and the digestion of the bacteriostatic agent causes secondary pollution during their application.23,24
Guanidine compounds, which dissociate positively in aqueous solution, are easy to adsorb on the surface of negatively charged microorganisms, and exhibit killing or inhibiting effects on microorganisms (the pKa of guanidine is 12.48).25 Arg is the only amino acid containing guanidine, with the highest alkalinity among the 18 common natural amino acids, which makes Arg a highly effective natural antibacterial agent.26–29 There have been many studies on the immobilization of Arg on natural macro-molecules for the purpose of improving their antibacterial activities.28,30 For example, Arg-immobilized chitosan (ACS) was prepared in the presence of EDC and NHS, which exhibited improved heavy metal ion adsorption capacities and biological degradation resistance compared with St. Additionally, ACS was demonstrated to have an extended service life for the treatment of industrial wastewater.29 Chitosan has also been reported as an adsorbent using other methods. Ahmad et al.31 prepared a diphenylurea/chitosan hydrogel through a diazotization reaction, Manzoor et al.32 synthesized a new chitosan/carboxymethyl cellulose adsorbent using EDTA cross-linking, which could be recycled for the adsorption of Cu2+ many times with high regenerative adsorbability. However, studies on the immobilization of Arg to starch are rare, which may be due to the relatively higher difficulty in the immobilization of Arg on the starch macro-molecule. In our previous work, an Arg-modified starch (StMA–Arg) antibacterial film was prepared via the aminolysis reaction between methyl acrylate-grafted starch (StMA) and Arg to enhance the mechanical properties, antibacterial activities and appropriate hydrophilic–hydrophobic properties. The film maintained its structural integrity for a long period in simulated natural water and soil environment.33 On the other hand, Arg residues carry a net positive charge, and thus have strong ability to capture anions, such as anionic dyes and heavy metal salts (CrO42−, Cr2O72−, MnO42−, etc.), through electrostatic attraction. Therefore, together with high adsorption capacity and structural stability, Arg-modified starch has the potential to become a high-efficiency adsorption material for the treatment of textile industrial wastewater.
Herein, an Arg-modified starch resin (StAM–Arg) was prepared via the cross-linking of Arg molecules and poly-acrylamide-grafted starch (StAM), and its performance for removing dyestuffs and its stability were investigated. Its adsorption mechanism was investigated by simulating the adsorption kinetics and isotherms using different influencing factors. The microbial and structural stability of StAM–Arg were explored and shown to be maintained for a long time in the natural environment. Thus, this novel natural polymeric adsorbent is expected to become an alternative to activated carbon and synthetic resin to realize is widespread usage in the treatment of dyestuff wastewater and environmental remediation.
2. Methods
2.1 Materials
Corn starch was purchased from Shandong Jinhui Corn Products Co., Ltd. Polyacrylamide, glutaraldehyde, acid fuchsin, acid orange G and acid blue 80 were provided by Tianjin Kemiou Chemical Reagent Co., Ltd. Ammonium persulfate and sodium bisulfite were supplied by Tianjin Fengchuan Chemical Reagent Technology Co., Ltd. Arginine was obtained from Tianjin Guangfu Fine Chemical Research Institute. All chemical reagents were analytically pure.2.2 Preparation of acrylamide graft starch resin (StAM)
St (60.00 g) was dispersed in distilled water (500 mL) and transferred to a three-neck flask, heated at 85 °C for 30 min, and then cooled to 65 °C. Polyacrylamide (35 g), ammonium persulfate (1.20 g) and sodium bisulfate (0.30 g) were dissolved in a certain volume of distilled water and added dropwise, successively. The reaction was conducted at 65 °C for 3 h, and the crude product was washed and precipitated with anhydrous ethanol, and then extracted with ethylene glycol/acetone solution (6![[thin space (1/6-em)]](https://www.rsc.org/images/entities/char_2009.gif) :
:![[thin space (1/6-em)]](https://www.rsc.org/images/entities/char_2009.gif) 4, v/v) for 6–8 h (remove the homopolymer). After drying, StAM was obtained.
4, v/v) for 6–8 h (remove the homopolymer). After drying, StAM was obtained.
2.3 Preparation of L-arginine-modified starch resin (StAM–Arg)
StAM (20.00 g) was dispersed in a three-neck flask containing distilled water (500 mL). Subsequently, arginine (0.12 mol L−1) and glutaraldehyde (0.35 mol L−1) were added and the suspension was fully stirred. Then the pH of the system was adjusted to 5.0 with 3 N HCl. The reaction was conducted at 50 °C for 2.5 h. Subsequently, StAM–Arg was obtained by precipitation, filtration with anhydrous ethanol solution and drying in an oven.2.4 Characterization
2.5 Adsorption experiments
 | (1) |
 | (2) |
 | (3) |
 | (4) |
 | (5) |
2.6 Determination of stabilities
 | (6) |
| AR = 1 − CFU | (7) |
(a) Solubility. St, StAM and StAM–Arg (0.60 g) were dispersed in a round-bottom flask with distilled water (30 mL). After heating for 30 min in a water bath at 50 °C, 60 °C, 70 °C, and 80 °C, they were cooled for 15 min, centrifuged for 20 min (3000 rpm), and then the upper liquid was poured into a Petri dish and dried.
(b) Stability in simulated water-body. St, StAM and StAM–Arg (0.30 g) were placed in 2000 mL of solution containing a certain amount of Fe3+, Mg2+, and Ca2+ ions (10 mg L−1, respectively) for 7 d to simulate the degradation process of the adsorbent in natural water bodies. The dissolution ratio (DR) and WR were calculated as follows:
 | (8) |
 | (9) |
2.7 Statistical analysis
All experiments were performed in triplicate (n = 3) for each sample, and the results were expressed as the mean and standard deviation. For the batch adsorption experiments, the SPSS 22.0 software package was used to analyze the one-way analysis of variance (ANOVA) test and the Duncan's multiple range test to determine the significant difference of the mean (p < 0.05).3. Results and discussion
3.1 Reaction mechanism
Firstly, StAM was obtained via the graft co-polymerization of acrylamide on the starch macro-molecule. The introduction of polyacrylamide (PAM) grafting chains altered the physicochemical property of the resin in two ways: (A) reducing the glass transition temperature (Tg) of starch to improve the plasticity and mechanical stability of StAM and (B) the introduced PMA possesses more polar groups such as –NH2 and C![[double bond, length as m-dash]](https://www.rsc.org/images/entities/char_e001.gif) O, which can associate with dye molecules via N⋯H–O- and N⋯H–N-type hydrogen bonds, thus improving the dyestuff adsorption capacity of the resin.
O, which can associate with dye molecules via N⋯H–O- and N⋯H–N-type hydrogen bonds, thus improving the dyestuff adsorption capacity of the resin.
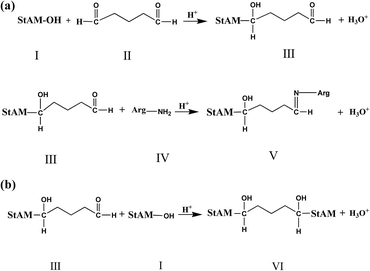
The immobilization reaction mechanism of Arg on StMA is shown in Fig. 1(a). Under acidic conditions, one of the aldehyde groups of the cross-linker GLU(II) was activated by protonation, and then reacted with the hydroxyl groups in the StMA macro-molecule (I) to form a hemiacetal (III). Meanwhile, the other aldehyde group of GLU was activated and reacted with the α-amino group in the Arg molecule (IV) to form an imine linkage (Schiff base), consequently immobilizing the Arg molecules onto StAM via cross-link bonds, thereby forming StMA–Arg (V). The reaction mechanism was essentially the cross-linking reaction between Arg and StMA in the presence of the cross-linker GLU via the formation of hemiacetal and imine linkages.
However, side reactions still occurred, as shown in Fig. 1(b). GLU reacted with the hydroxyl groups of two different starch (StMA) molecules, thus leading to the formation of a cross-linked starch macro-molecule (VI). This side reaction influenced the property of the StAM–Arg resin in two aspects, where on one hand, it reduced the loaded Arg. On the other hand, the appropriate cross-linking increased the molecular weight of the StAM–Arg resin, thus improving the physicochemical stability of the resin by forming a new three-dimensional network structure.
3.2 FT-IR
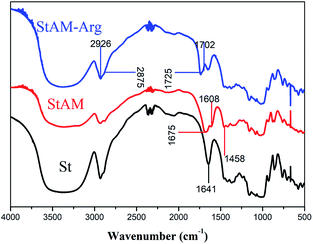
The infrared spectra of St, StAM, and StAM–Arg are shown in Fig. 2. The broad absorption band in the range of 3500–3250 cm−1 and peak at 1641 cm−1 are assigned to the stretching νO–H and bending δO–H vibration, respectively, of the hydroxy groups.35 In StAM, the δO–H signal declined and was largely covered by the new peaks at 1675 cm−1 (νC![[double bond, length as m-dash]](https://www.rsc.org/images/entities/char_e001.gif) O, amide I) and 1608 cm−1 (δN–H, amide II), which is because some of the hydroxyl groups had been replaced by the PAM branching chains via the grafting co-polymerization. For the same reason, the absorption band at 3500–3250 cm−1 was widened due to the overlapping of νO–H and νN–H. The band attributed to νC–N (amide III) emerged at 1458 cm−1. The band in the range of 1150–1080 cm−1 is attributed to νC–O–C, which indicates PAM was linked with the starch macro-molecule by the C–O–C ether linkage.
O, amide I) and 1608 cm−1 (δN–H, amide II), which is because some of the hydroxyl groups had been replaced by the PAM branching chains via the grafting co-polymerization. For the same reason, the absorption band at 3500–3250 cm−1 was widened due to the overlapping of νO–H and νN–H. The band attributed to νC–N (amide III) emerged at 1458 cm−1. The band in the range of 1150–1080 cm−1 is attributed to νC–O–C, which indicates PAM was linked with the starch macro-molecule by the C–O–C ether linkage.
In contrast, StAM–Arg was further changed. The broad band in the range of 3500–3250 cm−1 was strengthened again due to the νN–H bond (–NH2, –NH–, ![[double bond, length as m-dash]](https://www.rsc.org/images/entities/char_e001.gif) NH) introduced in the Arg residue loading. The new peak at 1725 cm−1 and the shoulder peak at 1702 cm−1 were assigned to the overlapping of the carboxyl νC
NH) introduced in the Arg residue loading. The new peak at 1725 cm−1 and the shoulder peak at 1702 cm−1 were assigned to the overlapping of the carboxyl νC![[double bond, length as m-dash]](https://www.rsc.org/images/entities/char_e001.gif) O and guanidine νC
O and guanidine νC![[double bond, length as m-dash]](https://www.rsc.org/images/entities/char_e001.gif) N in the Arg residues, respectively, which made the absorption band at 1720–1620 cm−1 more complicated. The strengthened absorption band at 1550–1480 cm−1 is attributed to δN–H in the Arg residues. Additionally, the anti-symmetric νasC–H at 2926 cm−1 and symmetrical νsC–H at 2875 cm−1 in StAM–Arg were significantly enhanced compared with that of St, which may be because the introduced PAM chains, GLU and Arg residues brought a great amount of methylene (–CH2–) structures on the StAM–Arg macro-molecules.
N in the Arg residues, respectively, which made the absorption band at 1720–1620 cm−1 more complicated. The strengthened absorption band at 1550–1480 cm−1 is attributed to δN–H in the Arg residues. Additionally, the anti-symmetric νasC–H at 2926 cm−1 and symmetrical νsC–H at 2875 cm−1 in StAM–Arg were significantly enhanced compared with that of St, which may be because the introduced PAM chains, GLU and Arg residues brought a great amount of methylene (–CH2–) structures on the StAM–Arg macro-molecules.
In general, FT-IR showed that the Arg residues were introduced in the starch macro-molecules in the presence of the cross-linker GLU via the formation of imine C![[double bond, length as m-dash]](https://www.rsc.org/images/entities/char_e001.gif) N and hemiacetal C–O–C linkages.
N and hemiacetal C–O–C linkages.
3.3 13C-NMR
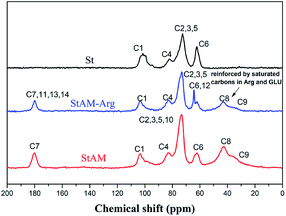
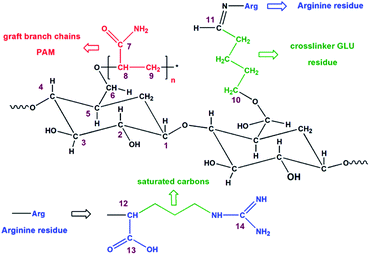
Fig. 3 and 4 show the 13C-NMR spectra and the corresponding molecular structures of St and StAM and StAM–Arg, respectively. The peaks C1–C6 are assigned to the anhydroglucose (AGU), the basic constitutional unit of both starch and cyclodextrin. The chemical shift of C1 (101.5 ppm) is found at a relatively low field since C1 is directly connected to two oxygen atoms, which causes a greater deshielding effect. The peak at 81.9 ppm is attributed to C4. The strongest peak near 71–74 ppm is actually due to the overlap of the C2, C3 and C5 peaks since these carbon atoms have similar chemical environments. In StAM, the new low-field peak at 180.2 ppm is assigned to the carbonyl carbon C7 (C![[double bond, length as m-dash]](https://www.rsc.org/images/entities/char_e001.gif) O), which is connected with –NH2 in the amide group. The new high-intensity peaks in the range of 42.6–32.8 ppm are assigned to the saturated carbon atoms C8 and C9 in the grafted PAM branched chains, where the C9 signal emerged at the highest field since it was connected with less substituents, and thus had higher shielding effects. Furthermore, the C6 peak in StAM was relatively reduced, indicating the grafting reaction mainly occurred on the primary hydroxyl groups in the starch macro-molecule.
O), which is connected with –NH2 in the amide group. The new high-intensity peaks in the range of 42.6–32.8 ppm are assigned to the saturated carbon atoms C8 and C9 in the grafted PAM branched chains, where the C9 signal emerged at the highest field since it was connected with less substituents, and thus had higher shielding effects. Furthermore, the C6 peak in StAM was relatively reduced, indicating the grafting reaction mainly occurred on the primary hydroxyl groups in the starch macro-molecule.
In contrast, the 13C-NMR spectrum of StAM–Arg exhibited some further changes. In the low field, the peaks of the sp2 hybrid carbons, including C11 (imidogen C![[double bond, length as m-dash]](https://www.rsc.org/images/entities/char_e001.gif) N) in the Schiff base, and C13 (carboxyl C
N) in the Schiff base, and C13 (carboxyl C![[double bond, length as m-dash]](https://www.rsc.org/images/entities/char_e001.gif) O) and C14 (guanidine) in the Arg residues, overlapped and merged with C7, thus significantly enhancing the peak near 180.5 ppm. In the high field, the peaks of the saturated carbons in the range of 43.5–35.8 ppm were significantly enhanced since abundant methylene/methine (–CH2–/–CH–) in GLU and Arg molecules were introduced on StAM–Arg via the cross-linking reaction. Interestingly, in the 13C-NMR spectrum of StAM–Arg, the peak intensity of C6 at 62.3 ppm was further reduced, which indicates that the immobilization reaction of Arg probably occurred mainly on the residual primary hydroxyl groups of C6 in the StAM macro-molecule.
O) and C14 (guanidine) in the Arg residues, overlapped and merged with C7, thus significantly enhancing the peak near 180.5 ppm. In the high field, the peaks of the saturated carbons in the range of 43.5–35.8 ppm were significantly enhanced since abundant methylene/methine (–CH2–/–CH–) in GLU and Arg molecules were introduced on StAM–Arg via the cross-linking reaction. Interestingly, in the 13C-NMR spectrum of StAM–Arg, the peak intensity of C6 at 62.3 ppm was further reduced, which indicates that the immobilization reaction of Arg probably occurred mainly on the residual primary hydroxyl groups of C6 in the StAM macro-molecule.
3.4 XRD and SEM
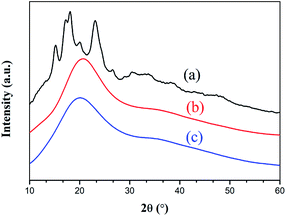
The images of St, StAM and StAM–Arg acquired by scanning electron microscopy are shown in Fig. 5(a–c), respectively, and their XRD patterns are shown in Fig. 6. Most of the St particles were relatively small (5–20 μm) with smooth surfaces. In contrast, the StMA and StMA–Arg particles had an increased particle size (25–55 μm), rougher surfaces and porous structures. St had the typical diffraction pattern for cereal starch, with a crystallinity degree of 35.6%. However, the diffraction intensity of StMA and StMA–Arg significantly decreased, and their peak shapes were transformed from spike into diffuse.As is known, the crystalline structures of natural polymers are formed and maintained by inter- and intra-molecular hydrogen bonds. For StAM, the grafting chains of PAM could break the hydrogen bonds among the starch molecules. StAM–Arg was found to have a further decreased crystallinity degree (12.3%) than StAM (18.5%). That is because the introduced Arg residues had larger steric hindrance and homo charge repulsion with the strong electro-positive guanidine, which further isolated the macro-molecules and restrained the formation of inter-molecular hydrogen bonds. This consequently led to an increase in the amorphous region and a looser structure for the resin, which can facilitate the particle diffusion of dye molecules, thus increasing the adsorption capacity of StAM–Arg.
3.5 GPC
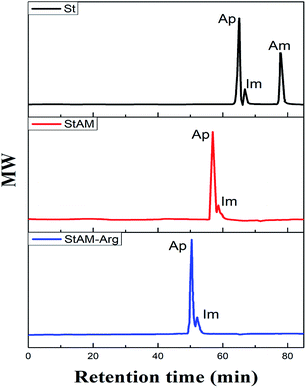
Homologous polymers with different molecular weights (MW) and dimensions are retained as different fractions by gel permeation chromatography (a type of exclusion chromatography). The lower MW fractions have longer retention times than higher MW fractions.36,37 It can be seen in Fig. 7 that St contained three main fractions, i.e. high MW fraction (amylopectin, Ap), low MW fraction (amylose, Am) and intermediate component (Im), which have different retention times.33The chromatographic peak shape of StAM was obviously altered. The low MW fraction peak (Am) disappeared and its retention time was evidently reduced, which indicate that StAM has an increased MW and higher proportion of fraction Ap. That may be because the introduction of grafted PAM polymeric chains significantly increased the MW of the StAM macro-molecule, and meantime altered its molecular configuration from linear to network structures. By contrast, StAM–Arg had a similar peak shape as StAM, but a further reduced retention time. This may because the cross-linking of GLU further increased the MW of StAM–Arg. In this case, larger network structures were formed via the chemical cross-linking, hydrogen bond association, and the topological entanglement among the StAM–Arg macro-molecules.
In general, StAM–Arg had a significantly increased MW, and an obviously altered molecular configuration. GPC indicated that most of the linear fractions (Am) in the StAM–Arg macro-molecule had transformed into network fractions (Ap) via the grafting and cross-linking modifications. All the above changes are considered to be beneficial to improve the stability and insolubility of the StAM–Arg resin.
3.6 XPS analysis
Fig. 8(a–i) and Table 1 present the chemical compositions and changes in the binding mode of both StAM–Arg and the dye-loaded StAM–Arg from the XPS analyses. In the C 1s spectra for StAM–Arg (Fig. 4(a–d)), the peaks with binding energies (BEs) at 288.78 and 286.01 eV were assigned to the saturated carbon atom from the StAM–Arg macromolecule backbone, and the peaks with BEs of 287.58 and 288.50 eV were attributed to the unsaturated carbons in the introduced guanidine –N![[double bond, length as m-dash]](https://www.rsc.org/images/entities/char_e001.gif) C(NH2)2 and amide O
C(NH2)2 and amide O![[double bond, length as m-dash]](https://www.rsc.org/images/entities/char_e001.gif) C–NH2 groups, respectively.38,39 In the three spectra of dye-loaded StAM–Arg (AF/AOG/AB80–StAM–Arg), the peaks of aromatic carbon C–C/C–H emerged at BEs near 284.6 eV, which are assigned to the benzene ring of the dye molecular skeleton, confirming the adsorption of the dye on StAM–Arg. In the N 1s XPS spectra for StAM–Arg (Fig. 8(e–h)), the N 1s signal was deconvoluted into two peaks, which are assigned to the imine –N
C–NH2 groups, respectively.38,39 In the three spectra of dye-loaded StAM–Arg (AF/AOG/AB80–StAM–Arg), the peaks of aromatic carbon C–C/C–H emerged at BEs near 284.6 eV, which are assigned to the benzene ring of the dye molecular skeleton, confirming the adsorption of the dye on StAM–Arg. In the N 1s XPS spectra for StAM–Arg (Fig. 8(e–h)), the N 1s signal was deconvoluted into two peaks, which are assigned to the imine –N![[double bond, length as m-dash]](https://www.rsc.org/images/entities/char_e001.gif) C– (399.35 eV) and primary amine –NH2 (399.63 eV).40 The shift in the binding energies for C 1s and N 1s caused by the chemical environment was evidence for the introduction of the PAM grafting chains and the Arg residues. After the dye adsorption, the N 1s peak shifted to 399.71 eV (AF), 399.92 eV (AOG), and 400.11 eV (AB80), which are attributed to the –N
C– (399.35 eV) and primary amine –NH2 (399.63 eV).40 The shift in the binding energies for C 1s and N 1s caused by the chemical environment was evidence for the introduction of the PAM grafting chains and the Arg residues. After the dye adsorption, the N 1s peak shifted to 399.71 eV (AF), 399.92 eV (AOG), and 400.11 eV (AB80), which are attributed to the –N![[double bond, length as m-dash]](https://www.rsc.org/images/entities/char_e001.gif) N–, Ph–NH–Ph, and NH
N–, Ph–NH–Ph, and NH![[double bond, length as m-dash]](https://www.rsc.org/images/entities/char_e001.gif) Ph from the dye molecules, where the π–π and p–π conjugative effects among the amino, imino and benzene groups increased the electron binding energy of the N atoms, respectively. The S 2p peaks emerged at almost the same location near 167.85 eV, which are attributed to the sulfonic groups (–SO3–) from the dye molecules. Thus, the results proved the loading of the dyes on StAM–Arg via physical and chemical adsorption.
Ph from the dye molecules, where the π–π and p–π conjugative effects among the amino, imino and benzene groups increased the electron binding energy of the N atoms, respectively. The S 2p peaks emerged at almost the same location near 167.85 eV, which are attributed to the sulfonic groups (–SO3–) from the dye molecules. Thus, the results proved the loading of the dyes on StAM–Arg via physical and chemical adsorption.
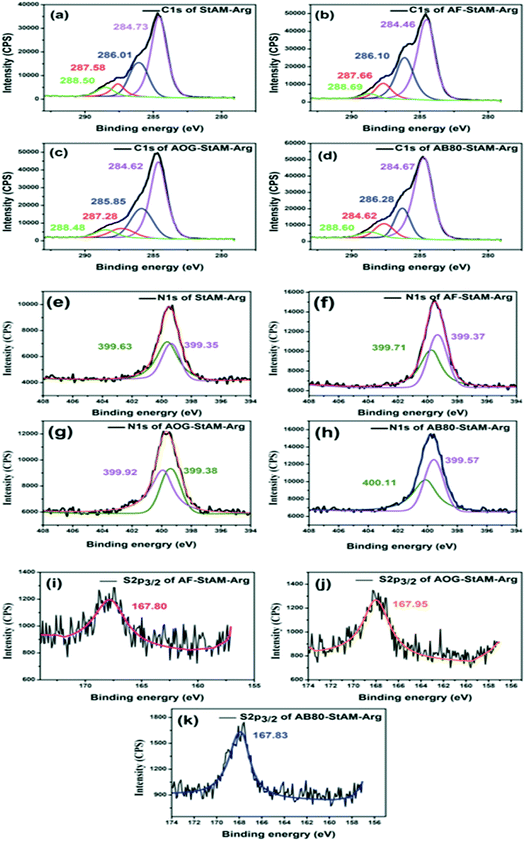 | ||
| Fig. 8 XPS analyses of C 1s (a–d), N 1s (e–h), and S 2p3/2 (i–k) for StAM–Arg, AF–StAM–Arg, AOG–StAM–Arg and AB80–StAM–Arg, respectively. | ||
| Signal | Binding energies (eV) of various samples | Significance | |||
|---|---|---|---|---|---|
| StAM–Arg | AF–StAM–Arg | AOG–StAM–Arg | AB80–StAM–Arg | ||
| C 1s | 284.78 | 284.46 | 284.62 | 284.67 | C–C/C–H |
| 286.01 | 286.10 | 285.85 | 286.28 | C–O–C/C–OH | |
| 287.58 | 287.66 | 287.28 | 287.62 | –C![[double bond, length as m-dash]](https://www.rsc.org/images/entities/char_e001.gif) N– N– |
|
| 288.50 | 288.69 | 288.48 | 288.60 | O![[double bond, length as m-dash]](https://www.rsc.org/images/entities/char_e001.gif) C–NH– C–NH– |
|
| N 1s | 399.35 | 399.37 | 399.38 | 399.57 | O![[double bond, length as m-dash]](https://www.rsc.org/images/entities/char_e001.gif) C–NH– C–NH– |
| 399.63 | 399.71 | 399.92 | 400.11 | –C![[double bond, length as m-dash]](https://www.rsc.org/images/entities/char_e001.gif) N– N– |
|
| S 2p3/2 | Absent | 167.80 | 167.95 | 167.83 | –SO3– |
3.7 TGA analysis
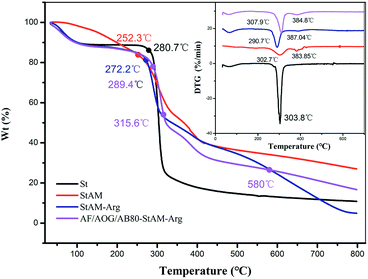
Fig. 9 shows the TGA curves of St, StAM, StAM–Arg, and dye-loaded StAM–Arg. The decomposition of St included two main stages. Before 280 °C, it corresponded to the loss of bound water via the physical adsorption of hydrogen bonds.41 Beyond 280 °C, dehydration of the glucose unit occurred, and the C–O bonds began to break, producing new products and low molecular weight volatile compounds, resulting in a high weight loss rate (61.36%). The TGA curve of StAM changed obviously, and the DTG showed two weight loss peaks at 302.7 °C and 381.3 °C, corresponding to the thermal decomposition of starch and the PAM grafting chains, respectively, since the latter had a more thermally stable C–C backbone. The temperature for the first stage of thermal decomposition for StAM–Arg was higher because of the formation of three-dimensional network macro-molecular structures via the cross-linking of GLU, which provided greater thermostability.At 270–315.6 °C, the thermal stability of dye-loaded StAM–Arg was even higher than that of StAM–Arg, which was attributed to the fact that during the adsorption process, dye molecules were stuck on the resin backbone, forming a heat-resistant cross-linking admixture.40 However, at 315.6–580 °C, the decomposition of –SO3− and –OH would break the association between the dye and StAM–Arg, leading to the separation of the dye molecules from the resin, which made the dye more prone to thermal degradation. Moreover, it is worth noting that the curves of StAM–Arg and dye-loaded StAM–Arg formed two intersections at 315.6 °C and 580 °C. Above 315 °C, the mass loss of StAM–Arg was higher than that of dye-StAM–Arg, which may be due to the accelerated decomposition of the Arg residues. Above 580 °C, dye-StAM–Arg had a relatively high residual mass (16.68%) since the inorganic salts decomposed from the dyes could have a protective effect on the resin skeletons.
3.8 Adsorption studies
![[double bond, length as m-dash]](https://www.rsc.org/images/entities/char_e001.gif) NH, and –SO3H). AB80 is a more complicated anthraquinone dye, which contains sulfonic groups and imino groups (–NH–). These three types of dyes have distinctly different molecular structures, dimensions and polarities, and are widely used in printing and dyeing of cotton, wool and nylon textiles.
NH, and –SO3H). AB80 is a more complicated anthraquinone dye, which contains sulfonic groups and imino groups (–NH–). These three types of dyes have distinctly different molecular structures, dimensions and polarities, and are widely used in printing and dyeing of cotton, wool and nylon textiles.
Fig. 11(a) shows the adsorption capacities of the different adsorbents for AF, AOG and AB80. It can be seen St had the lowest adsorption capacity for the three dyes. The high crystalline structure of the St particles reduced the hydrogen bonding between the starch and dye molecules. In this case, the adsorption was accomplished mainly through the weak hydrophobic interactions between the starch main chain and the hydrophobic groups (benzene rings) of the dye molecules, thus resulting in a low adsorption. The adsorption capacities of StAM were slightly higher, especially for AF. One the one hand, the introduced polar groups (–NH2 and –NHCO–) in the PAM-grafted side chains promoted the hydrogen bond formation in the StAM macro-molecule with the dyes. On the other hand, the increased amorphous region of StMA could facilitate the penetration of the dyes. However, in general, the adsorption capacity of StAM was still at a relatively low level.
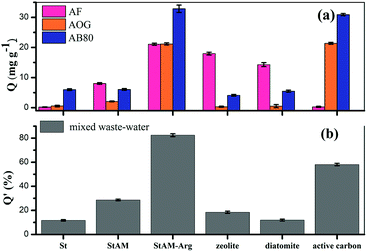 | ||
| Fig. 11 (a) Adsorption capacities of different adsorbents on AF, AOG, and AB80 dyes and (b) their decolorization rate (DR) for mixed waste-water. | ||
Interestingly, all the inorganic adsorbents (zeolite, diatomite and activated carbon) were found to have obvious adsorption selectivity for the different dyes. Their specific chemical composition, pore structures, surface characteristics and polarities are believed to cause these differences. The main components of zeolite and diatomite are the crystalline aluminosilicate and SiO2, respectively. They both have molecular-level micro-pores, with uniform pore size distributions.42–44 It was found that the zeolite and diatomite had a relatively higher adsorption capacity for AF, indicating they had higher combining ability with the triarylmethane dyes possessing medium molecular dimensions and stronger polarity. Activated carbon is amorphous carbon based on a graphite structure, with developed porosity, high specific surface and a certain amount of oxygen-containing groups.45,46 In contrast to the zeolite and diatomite, the activated carbon had high adsorption capacity for AOG and AB80, but scarcely adsorbed AF. This indicates the activated carbon tended to adsorb the monoazo and anthraquinone dyes with fused ring structures, where in this mode, the van der Waals forces and π–π stacking effect between the sp2-hybridized C atoms of the activated carbon and fused rings of the dyes molecules play a significant role. However, a high adsorption selectivity limits the application of inorganic adsorbents in the treatment of textile industrial wastewater with complicated components.
Obviously, StAM–Arg exhibited significantly enhanced adsorption capacities, and it was also found to have reduced adsorption selectivity for AF, AOG and AB80, indicating its broad-spectrum absorption for different dyes. Firstly, the Arg residues carry a net positive charge, and thus can effectively combine with anionic dyes via electrostatic attractions. Secondly, the abundant hydric groups (–NH2, ![[double bond, length as m-dash]](https://www.rsc.org/images/entities/char_e001.gif) NH, COOH and –CONH2) in the StAM–Arg macro-molecules can enhance the association with dyestuffs via the formation of more N⋯H⋯N- and O⋯H⋯N-type hydrogen bonds. Thirdly, the loose amorphous structures of StAM–Arg can further facilitate the permeation of dyes.
NH, COOH and –CONH2) in the StAM–Arg macro-molecules can enhance the association with dyestuffs via the formation of more N⋯H⋯N- and O⋯H⋯N-type hydrogen bonds. Thirdly, the loose amorphous structures of StAM–Arg can further facilitate the permeation of dyes.
As seen in Fig. 11(b), StAM–Arg had the highest decolorization ratio (82.49%) for the mixed wastewater, where the high adsorption capacities and broad-spectrum adsorption for different dyes of StAM–Arg play an important role. Compared with other adsorbents, StAM–Arg has more advantages for the treatment of the complicated textile and printing wastewater.
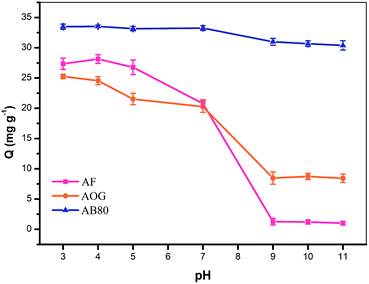
It was also found that at higher pH, the adsorption of AB80 on StAM–Arg had a more inconspicuous decreasing trend compared with that for AF and AOG. The reason for this may be that AB80 has a higher molecular weight and larger molecular dimensions, and thus the van der Waals force, π–π stacking effect and hydrophobic interactions between the backbone of StAM–Arg and the dyestuff molecules were greater. Therefore, AB80 had a relatively higher adsorption capacity under more alkaline conditions.
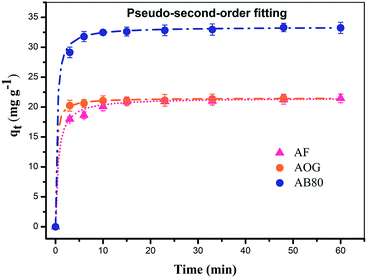 | ||
| Fig. 13 Effect of contact time on StAM–Arg adsorbent and pseudo-second order fitting for dyes (AF, AOG, and AB80). | ||
| Dyes | Pseudo-first-order | Pseudo-second-order | ||||
|---|---|---|---|---|---|---|
| K1 (min−1) | qe (mg g−1) | R12/F | K2 (g mg−1 min−1) | qe (mg g−1) | R22/F | |
| AF | 0.05891 | 2.39042 | 0.83382/5.20476 | 0.07967 | 21.5610 | 0.99978/35881.32989 |
| AOG | 0.07652 | 1.29783 | 0.94247/25.42138 | 0.22919 | 21.51000 | 0.99993/104261.11135 |
| AB80 | 0.03898 | 1.86416 | 0.72205/0.59106 | 0.10256 | 33.40013 | 0.99994/144421.33821 |
![[double bond, length as m-dash]](https://www.rsc.org/images/entities/char_e001.gif) HN, –OH, –COOH and –CONH2) of StAM–Arg and the dyestuff. Thirdly, the hydrophobic interactions (van der Waals force) between the backbone of the starch and dye molecules, which are made up of carbon–hydrogen bonds. The adsorption isotherm studies further explained the improved adsorption capacity and the broad-spectrum adsorption of StAM–Arg for different types of dyes.
HN, –OH, –COOH and –CONH2) of StAM–Arg and the dyestuff. Thirdly, the hydrophobic interactions (van der Waals force) between the backbone of the starch and dye molecules, which are made up of carbon–hydrogen bonds. The adsorption isotherm studies further explained the improved adsorption capacity and the broad-spectrum adsorption of StAM–Arg for different types of dyes.
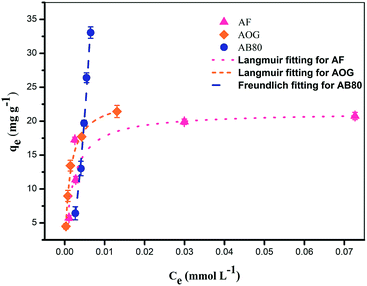 | ||
| Fig. 14 Effect of initial concentration on StAM–Arg adsorbent and Langmuir fitting for AF and AOG dyes and Freundlich fitting for AB80 dye by StAM–Arg adsorbent. | ||
| Dye | Langmuir model | Freundlich model | ||||
|---|---|---|---|---|---|---|
| KL | qm | R2/F | KF | 1/n | R2/F | |
| AF | 499.57969 | 21.32651 | 0.99897/3869.73044 | 44.30778 | 0.23769 | 0.51248/5.20476 |
| AOG | 785.90901 | 23.48520 | 0.99932/5854.92175 | 148.91553 | 0.40559 | 0.85926/25.42138 |
| AB80 | Absent | Absent | Absent | 168.66584 | 1.89215 | 0.99047/416.58442 |
3.9 Stability studies
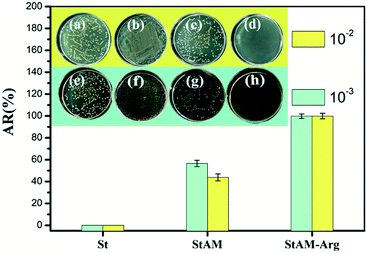 | ||
| Fig. 15 Antibacterial rate (AR) of St at 10−2 (b) and 10−3 (f), StAM at 10−2 (c) and 10−3 (g), StAM–Arg at 10−2 (d) and 10−3 (h), and blank control group of 10−2 (a) and 10−3 (e). | ||
In the StAM medium, the growth of the E. coli colony was inhibited to some extent, which may because the introduced PAM grafting chains played a protective function to the glycosidic bonds of starch, resulting in resistance to bacterial decomposition. The AR for StAM was improved (50.12%), but it was still at relatively a low level, which is due to the lack of antibacterial functional groups in the StAM macro-molecule.
By contrast, the growth of the E. coli colony in the StAM–Arg medium was found to be inhibited completely, with an AR as high as 99.73%, indicating the significantly improved bactericidal properties of StAM–Arg. The bactericidal mechanism was believed to be that the introduced Arg residues carry an effective positive charge, which were strongly attracted to the negatively charged bacterial surfaces with site-specific adsorption to the anionic structures of the cytoplasm and phosphate-containing phospholipids. This led to a loss in bacterial integrity and cell apoptosis.55,56 As a polysaccharide-based natural polymer adsorbing material, the enhancement in the antibacterial activity of StAM–Arg may maintain its structural stability for relatively longer periods of time, which gives this a novel natural polymer adsorbent a wider range of applications, a longer service life and greater repeat utilization rate.14,15
As can be seen in Fig. 16(a), the DR increased with an increase in the temperature. Obviously, at higher temperatures, the water molecules had accelerated thermal motions, and could be more liable to diffuse into the starch granules, forming O⋯O–H bonds with the starch hydroxyl groups, and thus promoting the swelling and dissolution of the resin. A similar pattern was observed for the dissolution behaviors of the StAM resin. Actually, the StAM resin had a relatively increased DR at each temperature, which may be due to its larger amorphous regions, facilitating the permeation of water molecules. In contrast, StAM–Arg had a significantly decreased DR, and it was interesting to find it had a relatively lower DR at higher temperatures, which indicated its increased insolubility and thermal stability. The reason for this may be that the cross-linking bonds widely existing among the macro-molecules play a great stabilization role in the resin, and thus the StAM–Arg resin had a loose amorphous structure, while maintaining high stability.
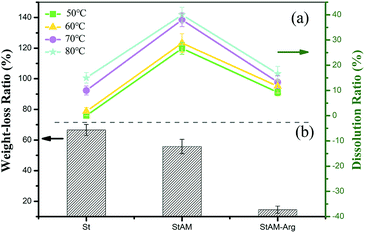 | ||
| Fig. 16 (a) Dissolution ratio at 50 °C, 60 °C, 70 °C, and 80 °C and (b) weight loss ratio in simulated natural water for 7 days for St, StAM and StAM–Arg. | ||
As seen in Fig. 16(b), StAM–Arg had an obviously reduced WR (14.50%) for 7 d in simulated natural water compared with that of St (66.53%) and StAM (55.77%). Firstly, through the cross-linking of GLU, the molecular weights of StAM–Arg increased and its macro-molecular structures transformed from linear to three-dimensional networks, thus reducing the swelling and dissolution of StAM–Arg, which enhanced the mechanical and chemical stability of the resin. Secondly, the introduced guanidine from the Arg residues carried a positive charge, which could stick to the negatively charged cytomembrane and restrain the microbial growth on the resin surface, thus enhancing the resistance of StAM–Arg to bio-degradation to a certain extent.57 This improved stability performance is considered to be beneficial for the application of starch-based natural polymeric adsorbents in wastewater treatment.
4. Conclusions
Arginine-modified starch (StAM–Arg) was synthesized via a two-step modification of grafting and cross-linking. The FT-IR and 13C-NMR analysis confirmed the introduction of arginine residues on the starch macro-molecules via the formation of an imine linkage. The GPC analysis indicated the significantly increased MW and the formation of a three-dimensional network structure in the StAM–Arg resin. XRD and SEM showed that StAM–Arg had an increased specific surface area and amorphous region compared with the native corn starch (St), which are beneficial for the permeation of the absorbate. XPS and TGA confirmed the loading of the dyes on the StAM–Arg backbone.The adsorption capability and mechanism of StAM–Arg for acid dyes were investigated, and it exhibited significantly improved removal capability for AF, AOG and AB80. Herein, the electrostatic attraction between the arginine residues and dye anions was considered to play the dominant role, and the hydrogen bond and van der Waals forces also had an influence on the adsorption. The decolorization rate of StAM–Arg for mixed wastewater reached 82.49%, which was superior to that of zeolite, diatomite and activated carbon. The resin exhibited broad-spectrum adsorption to different dyes, which is beneficial for its application in the treatment of textile wastewater with complex compositions.
StAM–Arg exhibited a significantly improved structural stability and microbial-degradation resistance. The improvement in the biological and structural stability of StAM–Arg is considered beneficial to extend its service life, thus overcoming the inherent drawbacks of existing natural polymer adsorbents.
Conflicts of interest
There are no conflicts to declare.Acknowledgements
This work was funded by the National Key R&D Program of China (No. 2019YFC0408400), the Tianjin Key Science and Technology Program Foundation (No. 19PTZWHZ00030), the Natural Science Foundation of China (No. 51503147), the National Undergraduate Innovation Program (No. 201610058024), the National Modern Agricultural Technology System Special Projects (No. CARS-44-D).Notes and references
- C. R. Holkar, A. J. Jadhav, D. V. Pinjari, N. M. Mahamuni and A. B. Pandit, J. Environ. Manage., 2016, 182, 351–366 CrossRef CAS.
- Z. H. Fei, L. D. Long and Z. C. Wei, Journal of Environmental Science and Management, 2007, 32, 89–92 Search PubMed.
- Y. Huang and L. F. Song, Dyest. Color., 2018, 55, 58–61 Search PubMed.
- A. Tkaczyk, K. Mitrowska and A. Posyniak, Sci. Total Environ., 2020, 717, 137222 CrossRef CAS.
- D. A. Yaseen and M. Scholz, Int. J. Environ. Sci. Technol., 2019, 16, 1193–1226 CrossRef CAS.
- X. Q. Guo, L. J. Qu, G. J. Han and Y. N. Sun, Adv. Mater. Res., 2010, 156–157, 1404–1409 Search PubMed.
- G. g. Crini, Prog. Polym. Sci., 2005, 30, 38–70 CrossRef CAS.
- M. Haroon, L. Wang, H. Yu, N. M. Abbasi, Z.-u.-A. Zain-ul-Abdin, M. Saleem, R. U. Khan, R. S. Ullah, Q. Chen and J. Wu, RSC Adv., 2016, 6, 78264–78285 RSC.
- B. Xiang, W. Fan, X. Yi, Z. Wang, F. Gao, Y. Li and H. Gu, Carbohydr. Polym., 2016, 136, 30–37 CrossRef CAS.
- S. Chen, F. Y. Li, J. F. Li, X. Sun, J. F. Cui, C. Zhang, L. Wang, Q. Xie and J. Xu, RSC Adv., 2018, 8, 12400–12408 RSC.
- Y. X. Chen and G. Y. Wang, Colloids Surf., A, 2006, 289, 75–83 CrossRef CAS.
- X. Tao, D. Liu, W. Cong and L. Huang, Appl. Surf. Sci., 2018, 457, 572–579 CrossRef CAS.
- G. Xie, X. Shang, R. Liu, J. Hu and S. Liao, Carbohydr. Polym., 2011, 84, 430–438 CrossRef CAS.
- L. Sun, S. Yang, X. Qian and X. An, Cellulose, 2020, 27, 8799–8812 CrossRef.
- P. K. Samantaray, S. Kumar and S. Bose, J. Water Process. Eng., 2020, 38, 101536 CrossRef.
- F. Gimbert, N. Morin-Crini, F. Renault, P.-M. Badot and G. Crini, J. Hazard. Mater., 2008, 157, 34–46 CrossRef CAS.
- G. Xie, X. Q. Shang, R. F. Liu, J. Hu and Z. Hu, CIESC J., 2011, 62 Search PubMed.
- H. Mittal, S. M. Alhassan and S. S. Ray, J. Environ. Chem. Eng., 2018, 6, 7119–7131 CrossRef CAS.
- Z. Sekhavat Pour and M. Ghaemy, RSC Adv., 2015, 5, 64106–64118 RSC.
- X. Liu and Q. Wei, RSC Adv., 2016, 6, 79853–79858 RSC.
- C. Zhou, B. Zhang and J. Zhang, Journal of Donghua University, 2018, 44 Search PubMed.
- Y. Fang, L. L. Zhu, D. F. Wei, A. N. Zheng, F. Z. Hu and Y. Guan, J. Funct. Polym., 2011, 280 CAS.
- X. J. Wang, Text. Dyeing Finish. J., 2018, 40, 14–17+21 Search PubMed.
- J. Vila, J. Moreno-Morales and C. Balleste-Delpierre, Clin. Microbiol. Infect., 2020, 26, 596–603 CrossRef CAS.
- M. E. Villanueva, J. A. Gonzalez, E. Rodriguez-Castellon, S. Teves and G. J. Copello, Mater. Sci. Eng., C, 2016, 67, 214–220 CrossRef CAS.
- Z. Wang and Y. M. Zhou, FEED RESEARCH, 2014, 80–84, DOI:10.13557/j.cnki.issn1002-2813.2014.13.004.
- Q. Ma, P. M. Davidson and Q. Zhong, Int. J. Food Microbiol., 2020, 315, 108417 CrossRef CAS.
- T. T. Qian, X. Z. He, Q. N. Pan, X. Jiang and Y. Sun, Chemical Engineering and Equipment, 2012, 7–11 Search PubMed.
- Y. Zhang, H. Zhang, Y. Liu, Z. L. Zhang and C. K. Ding, J. Polym. Environ., 2017, 26, 885–894 CrossRef.
- Q. J. Wu, Y. Sun, J. T. Ding, H. Tang, H. T. Wang and K. Huang, Guangzhou Chem. Ind., 2012, 40, 38–39+66 CAS.
- M. Ahmad, B. Zhang, J. Wang, J. Xu, K. Manzoor, S. Ahmad and S. Ikram, Int. J. Biol. Macromol., 2019, 136, 189–198 CrossRef CAS.
- K. Manzoor, M. Ahmad, S. Ahmad and S. Ikram, ACS Omega, 2019, 4, 17425–17437 CrossRef CAS.
- H. Zhang, Y. Liu, Y. Zhang, B. Y. Cheng, Q. Q. Niu and S. Zhou, Fine Chemicals, 2018, 35, 303–311 Search PubMed.
- N. Fu, L. Li, K. Liu, C. K. Kim, J. Li, T. Zhu, J. Li and B. Tang, Talanta, 2019, 197, 567–577 CrossRef CAS.
- D. V. Ludin, S. D. Zaitsev, Y. L. Kuznetsova, A. V. Markin, A. E. Mochalova and E. V. Salomatina, J. Polym. Res., 2017, 24 DOI:10.1007/s10965-017-1280-x.
- B. J. Liang, G. F. Chen, N. S. Liu, S. B. Peng, Q. Xiao and J. G. Zheng, Polym. Bull., 2019, 4, 21–26 Search PubMed.
- L. Senak, J. Cullen, P. Suszczynski, A. Malsbury, L. Feeley, C. S. Wu, M. Tallon and E. Malawer, J. Liq. Chromatogr. Relat. Technol., 2008, 31, 2587–2602 CrossRef CAS.
- M. Mahapatra, M. Karmakar, A. Dutta, H. Mondal, J. S. D. Roy, P. K. Chattopadhyay and N. R. Singha, J. Environ. Chem. Eng., 2018, 6, 289–310 CrossRef CAS.
- N. R. Singha, C. Roy, M. Mahapatra, A. Dutta, J. S. Deb Roy, M. Mitra and P. K. Chattopadhyay, ACS Omega, 2019, 4, 421–436 CrossRef CAS.
- M. Mitra, M. Mahapatra, A. Dutta, J. S. D. Roy, M. Karmakar, M. Deb, H. Mondal, P. K. Chattopadhyay, A. Bandyopadhyay and N. R. Singha, J. Hazard. Mater., 2019, 369, 746–762 CrossRef CAS.
- N. R. Singha, M. Mahapatra, M. Karmakar, A. Dutta, H. Mondal and P. K. Chattopadhyay, Polym. Chem., 2017, 8, 6750–6777 RSC.
- Y. Cao and X. B. Li, Adsorption, 2014, 20, 713–727 CrossRef CAS.
- Y. Zhao, G. Y. Tian, X. H. Duan, X. H. Liang, J. P. Meng and J. S. Liang, Ind. Eng. Chem. Res., 2019, 58, 11638–11652 CrossRef CAS.
- S. B. Wang and Y. L. Peng, Chem. Eng. J., 2010, 156, 11–24 CrossRef CAS.
- P. J. M. C. Suhas and M. M. L. R. Carrott, Bioresour. Technol., 2007, 98, 2301–2312 CrossRef CAS.
- J. Saleem, U. B. Shahid, M. Hijab, H. Mackey and G. McKay, Biomass Convers. Biorefin., 2019, 9, 775–802 CrossRef CAS.
- S. Dandil, D. Akin Sahbaz and C. Acikgoz, Int. J. Biol. Macromol., 2019, 136, 668–675 CrossRef CAS.
- C. Wei, Y. Huang, Q. Liao, A. Xia, X. Zhu and X. Zhu, Bioresour. Technol., 2019, 293, 122056 CrossRef CAS.
- K. Song, H. Xu, L. Xu, K. Xie and Y. Yang, Bioresour. Technol., 2017, 232, 254–262 CrossRef CAS.
- J. Wu, T. Zhang, C. Chen, L. Feng, X. Su, L. Zhou, Y. Chen, A. Xia and X. Wang, Bioresour. Technol., 2018, 266, 134–138 CrossRef CAS.
- M. Zubair, N. Jarrah, K. Ihsanuullah, A. Khalid, M. S. Manzar, T. S. Kazeem and M. A. Al-Harthi, J. Mol. Liq., 2018, 254–264, DOI:10.1016/j.molliq.2017.11.022.
- S. Saber-Samandari, S. Saber-Samandari, H. Joneidi-Yekta and M. Mohseni, Chem. Eng. J., 2017, 308, 1133–1144 CrossRef CAS.
- K. Song, X. Qian, X. Li, Y. Zhao and Z. Yu, Carbohydr. Polym., 2019, 222, 115016 CrossRef CAS.
- C. He, L. Shi, S. Lou, B. Liu, W. Zhang and L. Zhang, Int. J. Biol. Macromol., 2019, 128, 593–602 CrossRef CAS.
- E. Escamilla-García, A. G. Alcázar-Pizaña, J. C. Segoviano-Ramírez, C. Del Angel-Mosqueda, A. P. López-Lozano, E. Cárdenas-Estrada, M. A. De La Garza-Ramos, C. E. Medina-De La Garza and M. Márquez, Int. J. Microbiol., 2017, 2017, 1–9 CrossRef.
- P. K. Samantaray, G. Madras and S. Bose, Adv. Sustainable Syst., 2019, 3, 1900017 CrossRef CAS.
- M. Walczak, A. Richert and A. Burkowska-But, J. Ind. Microbiol. Biotechnol., 2014, 41, 1719–1724 CrossRef CAS.
| This journal is © The Royal Society of Chemistry 2020 |

