 Open Access Article
Global accurate diabatic potential surfaces for the reaction H + Li2
Ruilin Yin†
a,
Nan Gao†b,
Jing Caoa,
Yanchun Li a,
Dequan Wang
 *a and
Xuri Huanga
aInstitute of Theoretical Chemistry, Jilin University, Changchun, People’s Republic of China. E-mail: dequan_wang@jlu.edu.cn
bDepartment of Thoracic Surgery, China-Japan Union Hospital of Jilin University, Changchun, People’s Republic of China
First published on 26th October 2020
Abstract
The adiabatic potential energies for the lowest three states of a Li2H system are calculated with a high level ab initio method (MCSCF/MRCI) with a large basis set (aV5Z). The accurate three dimensional B-spline fitting method is used to map the global adiabatic potential energy surfaces, using the existing adiabatic potential energies, for the lowest two adiabatic states of the title reaction system. The different vibrational states and corresponding energies are studied for the diatomic molecule of reactant and products. In order to clearly understand the nonadiabatic process, the avoided crossing area and conical intersection are carefully studied. For further study of the nonadiabatic dynamic reaction, the diabatic potential energy surfaces are deduced in the present work.
1 Introduction
Scattering reactions play an important role in atomic and molecular collision dynamics. The collisions involving hydrogen atoms and lithium molecules play a central role in chemical physics because they can provide essential mechanistic information for understanding lithium chemistry, which was very important in early cosmic evolution.1–8 These reactions are significant in stellar evolution and galactic lithium production, as are LiH molecule formation and depletion processes.9,10 In addition to hydrogen, lithium is a key element in cosmology, galactic evolution and stellar models.9 The title reaction may have created the first condensed structure in the early universe,11,12 and the reaction can also show lithium neutron shielding and hydrogen storage processes.13,14 As the simplest mixed cluster, the Li2H trimer has become a focus of research efforts both experimentally15–17 and theoretically.18–33Wu and Ihle15 proved the existence of stable Li2H first in 1977, using mass spectroscopy measurements of dilute solutions of hydrogen in liquid lithium. The atomization energy value of 89.7 ± 5.0 kcal mol−1 was found in their work. The second experiment was reported by Vezin et al.16 in 1993. The experimental optical spectrum, the geometries in ground and excited states, of the title system were expressed. The third experiment for Li2H was by Antoine et al.,17 and in Antoine’s work, the ground state 2A1 and two excited states 2B1 and 2B2, were observed.
A large number of theoretical studies were essential in the identification and understanding of the Li2H system. The investigation of an accurate electronic potential energy surface (PES) is the first essential ingredient. Up to now, there are six PESs that can be used to introduce the Li2H system. Siegbahn and Schaefer19 got the first PES of Li2H with a self-consistent-field wave function and full configuration interaction method in 1975. Followed by Kim and Herschbach,21 who constructed a new PES with a well depth of 3.812 eV. In 2010, Maniero et al.25 obtained PES of the ground state Li2H with full configuration interactions using 394 energy points using a 6-311G(2df,2pd) basis set, which indicated that the H + Li2(X1Σg+) → Li + LiH(X1Σ+) is a barrierless exothermic reaction, and the reaction will release 1.474 eV energy. In 2011, Skomorowski et al.26 calculated the IEA between the lithium atom and the lithium hydride molecule using Jacobi coordinate with CCSD(T) method, and a conical intersection was reported. More recently, Song et al.28 calculated 3726 ab initio potential energies using a CASSCF/MRCI method to map a new global adiabatic PES of the electronic ground-state of Li2H. In 2017, Yuan and co-authors30 constructed an accurate PES over a large configuration space with 29![[thin space (1/6-em)]](https://www.rsc.org/images/entities/char_2009.gif) 842 energy points, which were calculated at the CASSCF/MRCI-F12 level using a CC-pVTZ basis set. Subsequently, the reaction dynamic calculations for the title system were performed based on these PESs.
842 energy points, which were calculated at the CASSCF/MRCI-F12 level using a CC-pVTZ basis set. Subsequently, the reaction dynamic calculations for the title system were performed based on these PESs.
The H + Li2 reaction is exothermic, and there are relative deep potential wells on the reaction path, furthermore, the geometry of the conical intersection is near the bottom of the potential wells which means that the transformation between the lowest two PES states is easy. Thus, the nonadiabatic interactions between the ground state and the excited states may play an important role. The diabatic potential energy surface can be used to express this electron transform progress.
Up to now, no accurate diabatic PES exists for the nonadiabatic dynamic study of the H + Li2 reaction. The main aim of this work is to perform a globally accurate diabatic PES, including the lowest two adiabatic PESs of Li2H, using the MCSCF/MRCI level. First, the lowest three adiabatic PESs are mapped. The spectrum for LiH and Li2 are studied to confirm the accuracy of these adiabatic PESs. Second, the accurate mixing angle data, which can be used to transform the adiabatic PES to diabatic PES, are calculated. Third, the avoided crossing point, which is between the lowest two adiabatic states, is accurately studied.
This paper is organized as follows: in the next section, the theory for mapping the adiabatic PESs and mixing angles is outlined. The features for adiabatic PESs, spectra, the avoided crossing point, mixing angles, and the diabatic PESs, will be presented and discussed in the third section. In the last section, a simple summary and conclusion will be provided.
2 Computational methods
2.1 Ab initio calculation
All ab initio calculations have been performed at the MCSCF/MRCI level with large basis sets (aV5Z)34 using the MOLPRO 2012 package35 for the three lowest state adiabatic potential energies of the Li2H system. The symmetry of the title system is fixed in the Cs point group, in total, 7 electrons are involved in 2 closed-shell orbitals (2A′ + 0A′′). A total of 13 (10A′ + 3A′′) active orbitals are considered in the present work. And 319 (192A′ + 127A′′) external orbitals are used in this work. Thus the MCSCF function included 570 determinants and 1014 intermediate states for the triatomic molecule system. In the MRCI calculated progress, 2 orbitals (2A′ + 0A′′) are put into the core orbital, and 3 electrons are set in the valence space, the total number of contracted configurations is 705![[thin space (1/6-em)]](https://www.rsc.org/images/entities/char_2009.gif) 202, which includes the number of internal configurations, single external configurations, and doubly external configurations – 420, 28
202, which includes the number of internal configurations, single external configurations, and doubly external configurations – 420, 28![[thin space (1/6-em)]](https://www.rsc.org/images/entities/char_2009.gif) 548, and 676
548, and 676![[thin space (1/6-em)]](https://www.rsc.org/images/entities/char_2009.gif) 234, respectively. The energies of the lowest five states are considered as the reference energies to reduce the final three adiabatic potential energies.
234, respectively. The energies of the lowest five states are considered as the reference energies to reduce the final three adiabatic potential energies.
There are several coordinate systems that can be used to describe the triatomic molecules. In these systems, Jacobi coordinates, which have been widely used in our former studies,36–41 are the most popular ones to describe the three atoms scattering reaction, since it well expresses both the reactant part (H + Li2) and product part (LiH + Li), which are shown in panel (a) and panel (b) in Fig. 1, respectively.
In this study, the potential energy points scanned are as follows: when r in the range 0.6 Å to 3.0 Å is calculated with a grid of 0.1 Å, when r is between 3.0 Å and 5.0 Å, the grid is 0.2 Å; for the R, when it is larger than 0.1 Å, and less than 3.0 Å, the scan grid is 0.1 Å, when 3.0 Å ≤ R ≤ 7.0 Å the scan grid is 0.2 Å, and when R is in the range 7.0 Å to 11.8 Å, the grid is 0.4 Å; for the reactant region, the angles θ, with a grid of 10.0°, are scanned from 0.0° to 90.0°. In total 27![[thin space (1/6-em)]](https://www.rsc.org/images/entities/char_2009.gif) 900 adiabatic potential energy points are mapped for each state in this reactant area; for the product region, the angles used are from 0.0° to 180.0° with the same scan grid, the total scan points are 46
900 adiabatic potential energy points are mapped for each state in this reactant area; for the product region, the angles used are from 0.0° to 180.0° with the same scan grid, the total scan points are 46![[thin space (1/6-em)]](https://www.rsc.org/images/entities/char_2009.gif) 170 for each state; thus 74
170 for each state; thus 74![[thin space (1/6-em)]](https://www.rsc.org/images/entities/char_2009.gif) 070 adiabatic potential energy points are used to produce the accurate adiabatic PESs for each state. In the whole scan range, a three dimension B-spline method42,43 is used to interpolate the surfaces.
070 adiabatic potential energy points are used to produce the accurate adiabatic PESs for each state. In the whole scan range, a three dimension B-spline method42,43 is used to interpolate the surfaces.
2.2 Internal energy calculations
The discrete eigenvalues and eigenfunctions of the related vibrational (v) and rotational (j) states for the internal energy Ev,j can be determined with the one-dimensional Schrödinger equation. The Schrödinger equation is given as
 | (1) |
 , where Ω is the projection of the electronic angular momentum onto the internuclear axis (see Level 8.0, p.2 (ref. 44) and the PhD thesis of Wang45).
2.3 Mixing angle (α) calculations
For calculating the mixing angles between the lowest two adiabatic states, the third adiabatic state, which is not involved in the coupling, is scanned, this method has been widely used in He and Han’s work.46,47 The wave functions are ψa1, ψa2, and ψa3 of the first three lowest states. The adiabatic wave function of the lowest two states can be expressed as:
 | (2) |
By multiplying by 〈ψa3|![[P with combining circumflex]](https://www.rsc.org/images/entities/i_char_0050_0302.gif) z| (here
z| (here ![[P with combining circumflex]](https://www.rsc.org/images/entities/i_char_0050_0302.gif) z is the z component of the dipole moment operator) on both sides of eqn (2), the following two equations can be deduced:
z is the z component of the dipole moment operator) on both sides of eqn (2), the following two equations can be deduced:
〈ψa3|![[P with combining circumflex]](https://www.rsc.org/images/entities/i_char_0050_0302.gif) z|ψa1〉 = cos z|ψa1〉 = cos![[thin space (1/6-em)]](https://www.rsc.org/images/entities/char_2009.gif) α〈ψa3| α〈ψa3|![[P with combining circumflex]](https://www.rsc.org/images/entities/i_char_0050_0302.gif) z|ϕd1〉 + sin z|ϕd1〉 + sin![[thin space (1/6-em)]](https://www.rsc.org/images/entities/char_2009.gif) α〈ψa3| α〈ψa3|![[P with combining circumflex]](https://www.rsc.org/images/entities/i_char_0050_0302.gif) z|ϕd2〉 z|ϕd2〉
| (3) |
〈ψa3|![[P with combining circumflex]](https://www.rsc.org/images/entities/i_char_0050_0302.gif) z|ψa2〉 = −sin z|ψa2〉 = −sin![[thin space (1/6-em)]](https://www.rsc.org/images/entities/char_2009.gif) α〈ψa3| α〈ψa3|![[P with combining circumflex]](https://www.rsc.org/images/entities/i_char_0050_0302.gif) z|ϕd1〉 + cos z|ϕd1〉 + cos![[thin space (1/6-em)]](https://www.rsc.org/images/entities/char_2009.gif) α〈ψa3| α〈ψa3|![[P with combining circumflex]](https://www.rsc.org/images/entities/i_char_0050_0302.gif) z|ϕd2〉. z|ϕd2〉.
| (4) |
In eqn (3) and (4), 〈ψa3|![[P with combining circumflex]](https://www.rsc.org/images/entities/i_char_0050_0302.gif) z|ϕd1〉 = 0 and 〈ψa3|
z|ϕd1〉 = 0 and 〈ψa3|![[P with combining circumflex]](https://www.rsc.org/images/entities/i_char_0050_0302.gif) z|ϕd2〉 = 1 at the high symmetry geometries (C2v, D2h). In the present work, an approximation48 is made for all Cs symmetry geometries, i.e. 〈ψa3|
z|ϕd2〉 = 1 at the high symmetry geometries (C2v, D2h). In the present work, an approximation48 is made for all Cs symmetry geometries, i.e. 〈ψa3|![[P with combining circumflex]](https://www.rsc.org/images/entities/i_char_0050_0302.gif) z|ϕd1〉 = 0 and 〈ψa3|
z|ϕd1〉 = 0 and 〈ψa3|![[P with combining circumflex]](https://www.rsc.org/images/entities/i_char_0050_0302.gif) z|ϕd2〉 = 1 for all possible structures. Thus, the mixing angle α can be calculated as
z|ϕd2〉 = 1 for all possible structures. Thus, the mixing angle α can be calculated as
 | (5) |
2.4 Adiabatic-to-diabatic transformation
After obtaining the mixing angle, we can deduce the diabatic function ϕdi with the adiabatic function using the following equation
 | (6) |
Then the diabatic energies Hdii can be obtained as
Hd11 = (cos![[thin space (1/6-em)]](https://www.rsc.org/images/entities/char_2009.gif) α)2Ea1 + (sin α)2Ea1 + (sin![[thin space (1/6-em)]](https://www.rsc.org/images/entities/char_2009.gif) α)2Ea2, α)2Ea2,
| (7) |
Hd22 = (sin![[thin space (1/6-em)]](https://www.rsc.org/images/entities/char_2009.gif) α)2Ea1 + (cos α)2Ea1 + (cos![[thin space (1/6-em)]](https://www.rsc.org/images/entities/char_2009.gif) α)2Ea2, α)2Ea2,
| (8) |
Hd12 = Hd21 = sin![[thin space (1/6-em)]](https://www.rsc.org/images/entities/char_2009.gif) α α![[thin space (1/6-em)]](https://www.rsc.org/images/entities/char_2009.gif) cos cos![[thin space (1/6-em)]](https://www.rsc.org/images/entities/char_2009.gif) α(Ea2 − Ea1). α(Ea2 − Ea1).
| (9) |
3 Results and discussion
The lowest three adiabatic PESs of the title reaction system are mapped, and the lowest two diabatic PESs are transformed, in the present work. For a clearer understanding of the features of these PESs, the lowest state energy of H + Li2 is shifted to 0.00 eV. The details of the feature of these PESs is expressed in the following part.3.1 Features of one-dimensional (1D) diatomic adiabatic potential energy surfaces
For the present globally fitted PESs, one atom (Li or H) is fixed far away from the diatom molecule, and the 1D adiabatic PESs for Li2 and LiH can be obtained as shown in Fig. 2 and 3. And the corresponding different level of vibrational and rotational energies (internal energies) for the ground state of Li2 are deduced with the Level 8.0 program.44 To obtain the Li2 PESs, R is fixed at 11.0 Å and θ is fixed at 90° using the reactant coordinate. To obtain the ground and the first excited state PESs of LiH, we fixed R = 11.0 Å and θ = 90° with product coordinates. For ease of discussion of the PESs and the energies of different vibrational states, the energy of the equilibrium LiH molecule is shifted to 0.00 cm−1. The detailed data of equilibrium bond distance (Re) and dissociation energy (De) for Li2 and LiH are shown in Table 1.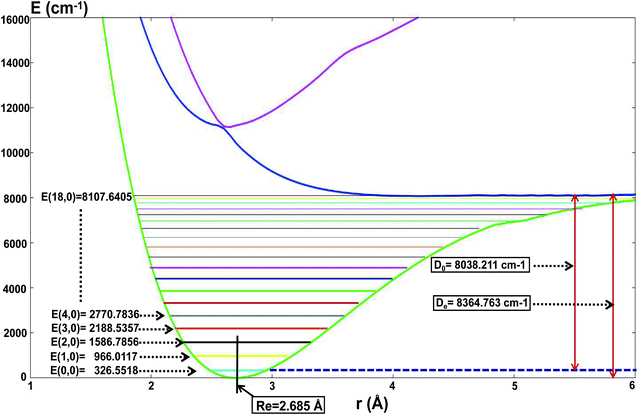 | ||
| Fig. 2 The lowest three PESs (in cm−1) for Li2 as a function of distance rLi–Li (in Å), and the different vibrational state energies E(v,j = 0) (in cm−1) of the ground state of Li2. | ||
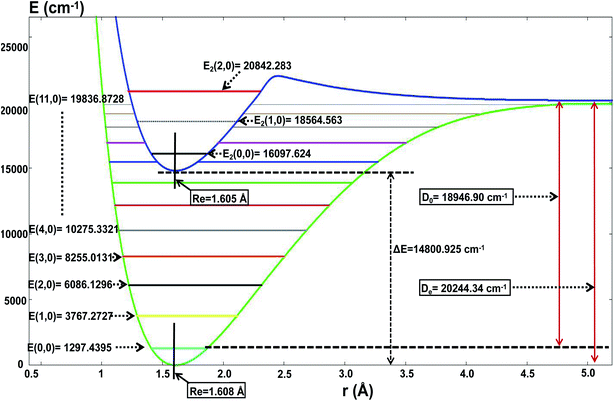 | ||
| Fig. 3 The lowest two PESs (in cm−1) for LiH as a function of distance rLi–H (in Å), and the different vibrational state energies E(v,j = 0) (in cm−1). | ||
| Species | Parameter | This work | Other work | Experimental |
|---|---|---|---|---|
| a Ref. 49.b Ref. 30.c Ref. 50.d Ref. 37.e Ref. 51.f Ref. 25.g Ref. 52. | ||||
| Li2 | Re [Å] | 2.685 | 2.687a, 2.674b, 2.703g | 2.525c |
| De [cm−1] | 8364.76 | 8371.04a, 8533.46b | 8471.72c | |
| D0 [cm−1] | 8038.21 | 8197.18a, 7307.38a | ||
| LiH | Re [Å] | 1.608 | 1.587a, 1.596b 1.622g | 1.597e |
| De [cm−1] | 20![[thin space (1/6-em)]](https://www.rsc.org/images/entities/char_2009.gif) 244.34 244.34 |
20![[thin space (1/6-em)]](https://www.rsc.org/images/entities/char_2009.gif) 342.60d, 20 342.60d, 20![[thin space (1/6-em)]](https://www.rsc.org/images/entities/char_2009.gif) 293.19b 293.19b |
20![[thin space (1/6-em)]](https://www.rsc.org/images/entities/char_2009.gif) 287.70e 287.70e |
|
| D0 [cm−1] | 18![[thin space (1/6-em)]](https://www.rsc.org/images/entities/char_2009.gif) 946.90 946.90 |
19![[thin space (1/6-em)]](https://www.rsc.org/images/entities/char_2009.gif) 629.10d, 16 629.10d, 16![[thin space (1/6-em)]](https://www.rsc.org/images/entities/char_2009.gif) 090.75g 090.75g |
19![[thin space (1/6-em)]](https://www.rsc.org/images/entities/char_2009.gif) 589.80e 589.80e |
|
| Li2H | RH–Li [Å] | 1.723 | ||
| Θ [°] | 42.755 | 42.813b | 42.708b | |
| E [kcal mol−1] | 82.295 | 86.900f | 87.9 ± 3.0f | |
Fig. 2 shows that the equilibrium bond distance (Re) is 2.685 Å for a Li2 molecule. The corresponding dissociation energy (De) is 8364.76 cm−1. These results are in good agreement with Jason’s results49 (2.687 Å and 8371.04 cm−1). In total, 19 vibrational bound levels are found for the Li2 molecule. The energy of the ground ro-vibrational state is E(0,0) = 326.558 cm−1 which is in good agreement with Angelo and Paulo’s work52 (E(0,0) = 346.05 cm−1). The energy of the highest vibrational state is E(18,0) = 8107.64 cm−1.
From Fig. 2 one can see that there is no stable bond level for the first excited adiabatic state of Li2. But there exist some stable bond levels for the second excited adiabatic state, which are not further studied in the present work.
Fig. 3 and Table 1 show the data for a LiH molecule. The detailed fitted data in the present work is as follows: for the ground state of LiH, there are 12 vibrational states; and the zero point energy is 1297.44 cm−1, which approximates Angelo and Paulo’s work52 (E(0,0) = 1363.05 cm−1); the dissociation energy is 18![[thin space (1/6-em)]](https://www.rsc.org/images/entities/char_2009.gif) 946.90 cm−1, which is in excellent agreement with the experiment result51 (19
946.90 cm−1, which is in excellent agreement with the experiment result51 (19![[thin space (1/6-em)]](https://www.rsc.org/images/entities/char_2009.gif) 589.80 cm−1); the equilibrium bond distance for LiH is 1.608 Å, which is nearly equal to the experiment result51 (1.597 Å). For the first excited state of LiH, there are 3 vibrational states; the zero point energy of the excited state LiH is 16
589.80 cm−1); the equilibrium bond distance for LiH is 1.608 Å, which is nearly equal to the experiment result51 (1.597 Å). For the first excited state of LiH, there are 3 vibrational states; the zero point energy of the excited state LiH is 16![[thin space (1/6-em)]](https://www.rsc.org/images/entities/char_2009.gif) 097.62 cm−1; the equilibrium bond distance is 1.605 Å; the lowest energy of the first excited state is 14
097.62 cm−1; the equilibrium bond distance is 1.605 Å; the lowest energy of the first excited state is 14![[thin space (1/6-em)]](https://www.rsc.org/images/entities/char_2009.gif) 800.92 cm−1 higher than that of the ground state. When the two atoms separate from each other, the potential energy of these two states will degenerate to the same one.
800.92 cm−1 higher than that of the ground state. When the two atoms separate from each other, the potential energy of these two states will degenerate to the same one.
Table 1 shows the data for the Li2H molecule, the bond length of LiH is stretched from 1.608 Å to 1.723 Å, the angle between these two bonds is 42.8°, which is in good agreement with the experimental conclusion.25,30
For clear understanding of the adiabatic PESs of the products part, the PESs of Li(2S/2P) + LiH(1Σ) are plotted in Fig. 4. For this figure, the bond distance of the diatomic molecule LiH is fixed at 1.61 Å, and the angle is fixed at 0.0°. Fig. 4 shows that the minimum for this system is R nearly equal 3.0 Å. When R is less than 3.0 Å, the energies for the ground state and the first excited state are nearly the same. When the R is larger than 3.0 Å, the curves of the ground state and the first excited state separate; and when the Li atom separates from the LiH molecule, the energy differences between the two states equal the different energy of Li(2S) and Li(2P), this difference in energy is 14![[thin space (1/6-em)]](https://www.rsc.org/images/entities/char_2009.gif) 854 cm−1, which agrees well with our former work, 14
854 cm−1, which agrees well with our former work, 14![[thin space (1/6-em)]](https://www.rsc.org/images/entities/char_2009.gif) 803 cm−1 (ref. 37), and experimental work, 14
803 cm−1 (ref. 37), and experimental work, 14![[thin space (1/6-em)]](https://www.rsc.org/images/entities/char_2009.gif) 904 cm−1.53
904 cm−1.53
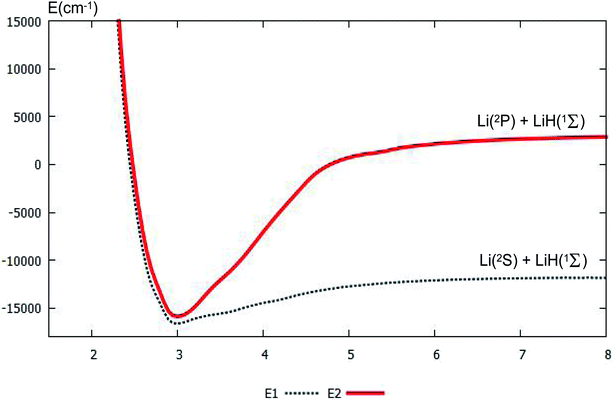 | ||
| Fig. 4 The lowest two PESs (in cm−1) for Li(2S/2P) + LiH(1Σ) with the function of RLi–LiH (in Å), and distances rLi–H = 1.61 Å at angle θ = 0.0° using product Jacobi coordinates. | ||
3.2 Two-dimensional (2D) adiabatic PESs
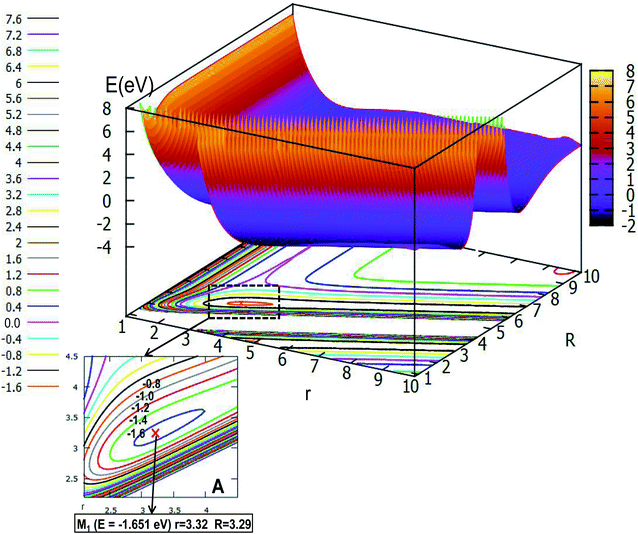 | ||
| Fig. 5 The lowest potential energy surface (in eV) for Li2H and its contour plot as a function of distances r and R (in Å) at angle θ = 0.0° in Jacobi coordinates. | ||
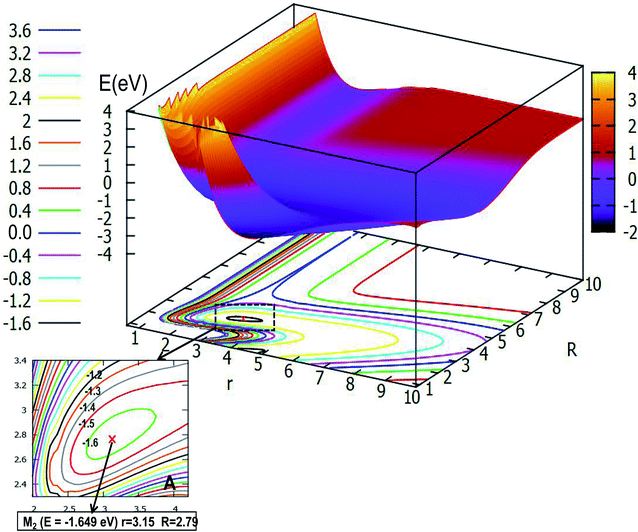 | ||
| Fig. 6 The lowest potential energy surface (in eV) for Li2H and its contour plot of the potential energy surface as a function of distances r and R (in Å) at angle θ = 30.0° in Jacobi coordinates. | ||
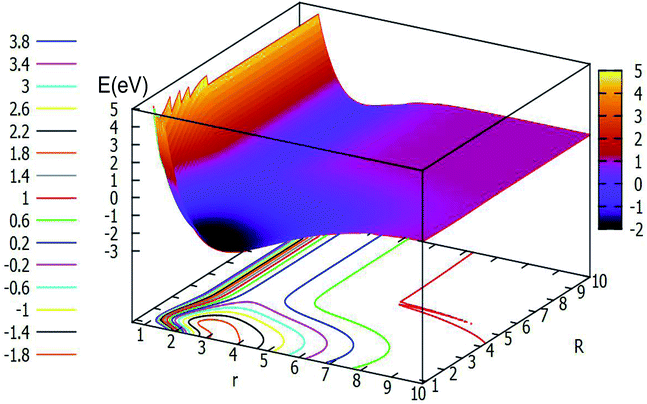 | ||
| Fig. 7 The lowest potential energy surface (in eV) for Li2H and its contour plot of the potential energy surface as a function of distances r and R (in Å) at angle θ = 60.0° in Jacobi coordinates. | ||
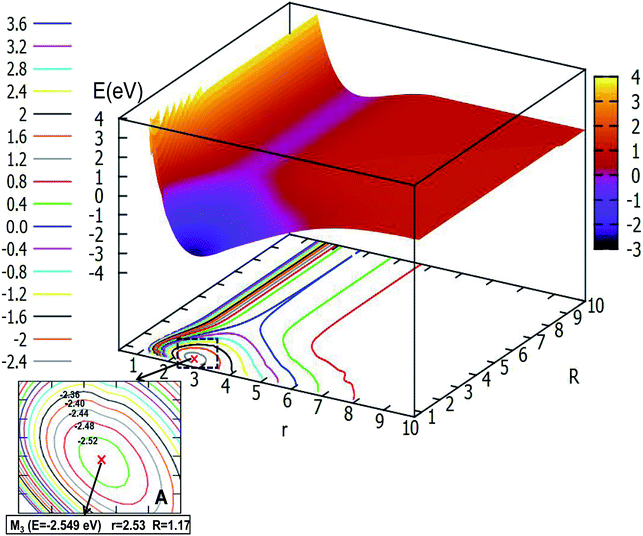
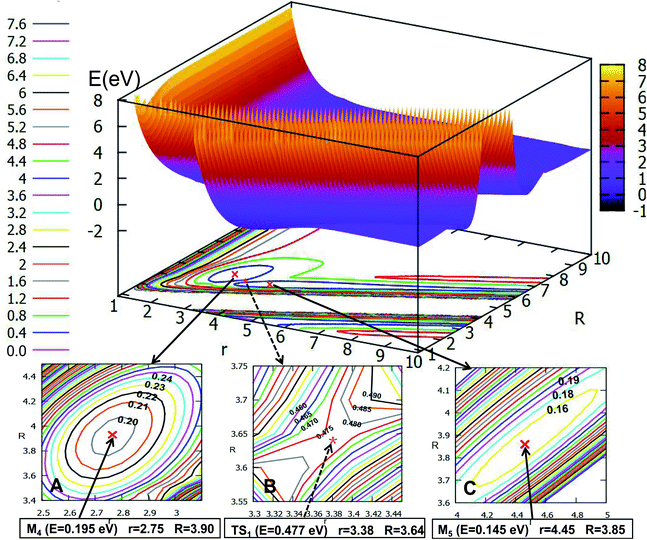
Fig. 5 shows the lowest PES for Li2H and its contour plot as a function of distances r and R at angle θ = 0.0° in Jacobi coordinates. It is not hard to see from the picture that there is a minimum whose energy is −1.651 eV, and the R value is 3.29 Å, while the r value is 3.32 Å. This minimum is a linear complex of Li⋯LiH. With increasing R value, the amplitude of the PES becomes flatter and flatter until there are nearly no changes, which means that as the distances r and R become longer, the interaction between these three atoms decreases to zero, thus, the three atoms in the Li2H system separate each other. On the contrary, as the r value becomes small, when the R value is between 2.0 Å and 5.0 Å, then the geometry of the minimum is formed; if the R value is less than 2.0 Å, there is higher energy.
Fig. 6 expresses the PES and the corresponding contour plot in angle θ = 30.0°. Comparing the previous pictures, the initial configuration changes from the liner geometry to a certain angle of inclination, that is why the two pictures of products export differently. From the image we find that the reaction entrance is smooth when the r value is small and the R value is big, until the value of R decreases to 4.0 Å, then the PES gradually tends to form the lowest point configuration, at which the r value is 3.15 Å and the R value is 2.79 Å, the energy of this minimum is −1.649 eV, which is slightly higher than that of the linear geometry. When the three atoms separate far away from each other, the image above the contour line is a smooth surface which means the energy of PES is constant.
The characteristics of Fig. 7 are similar to those of Fig. 6. This figure shows the PES with H atom closing on the Li2 molecule along the angle θ = 60.0°. With the decreasing r value and R value, the energies become lower and lower, and when 2.0 Å < r < 4.5 Å and 0.5 Å < R < 2.0 Å a minimum will be formed, which energy is lower than −1.80 eV. This is not a real three dimensional minimum for this system, we did not get the geometry of the lowest point by optimizing the configuration. From this figure one can make another conclusion that when r is fixed, the change of the energy for PES is slow with an R value larger than 4.0 Å.
Fig. 8 depicts the ground state of the PES for the Li2H system with θ = 90.0°. From this figure, one can see that when the R is less than 6.0 Å and r is less than 8.0 Å, the electron correlation for this system appeared obviously. And it is clear to see that there is a minimum in this picture. For better analysis of the related features of this minimum, the area near the minimum is amplified and plotted in the lower part of this figure. From this magnified image of this specific area one can see that the energy of this minimum is −2.549 eV, the corresponding r value is 2.53 Å and the R value is 1.17 Å. This minimum is the global minimum for the ground state of the Li2H system. From analyzing this C2v geometry attachment reaction pathway, one can see that there is no complex for this system.
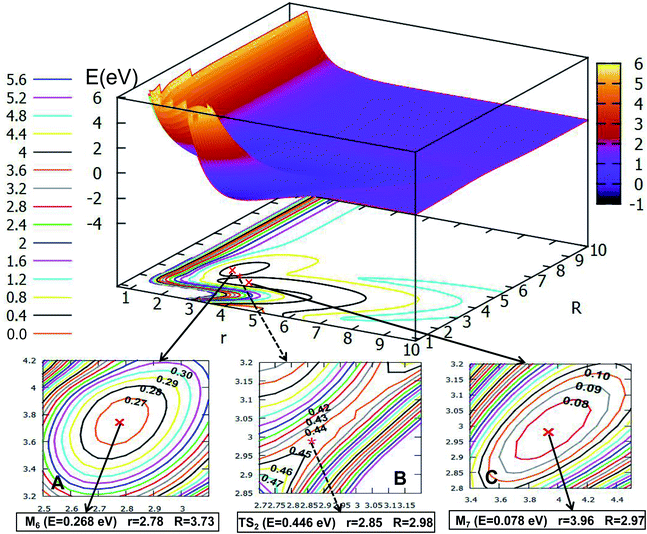
If the angle is changed to θ = 30.0°, Fig. 10 is obtained. The character of this PES is similar to that of θ = 0.0°; there are two minima and one transition state; the energy of the first minimum (M6) is 0.268 eV, and the corresponding geometry is r = 2.78 Å, and R = 3.73 Å; the M6 overcomes the 0.178 eV energy crossing a transition state (TS2), whose energy is 0.446 eV, then transforms to another minimum (M7); the energy of M7 is 0.078 eV, which is slightly lower than that of M6, the corresponding structure has r is 2.85 Å and R is 2.98 Å.
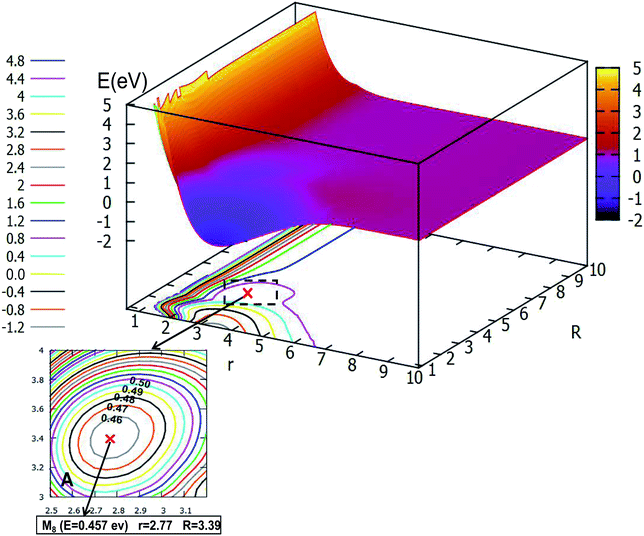
When the angle is increased to θ = 60.0°, with decreasing length between H and the Li2, the minimum M8, which has an energy of 0.457 eV, will be formed, then the minimum crosses a transition state into another minimum, but these two minima are not real for three dimensional molecules, after optimizing with Gaussian program,54 these minima will disappear.
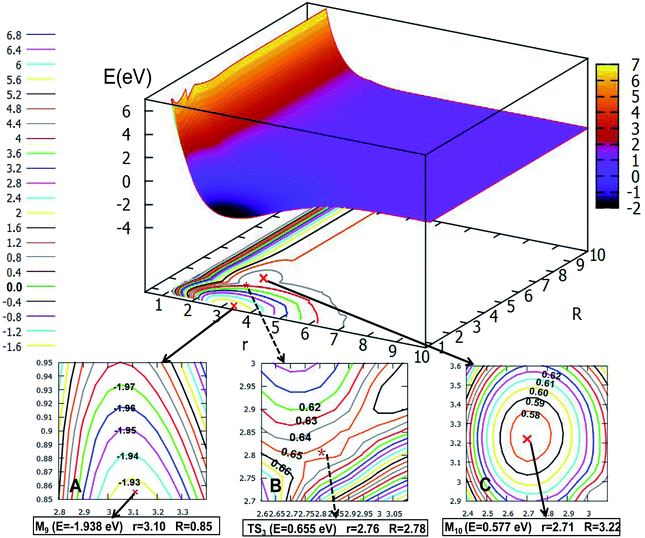
The global minimum for the first excited state of Li2H belongs to the C2v symmetry, the detail of the 2D-PES for the C2v symmetry of this state is shown in Fig. 12. Panel A shows the energy of this minimum (M9) is −1.938 eV, the corresponding structure has an r value of 3.10 Å and the R value is 0.85 Å. This minimum over 2.59 eV energy (crossing the transition sate TS3) can reach the second minimum M10. From M9 to M10, the r value is decreased by 0.39 Å from 3.10 Å to 2.71 Å; and R is extended by 2.37 Å from 0.85 Å to 3.22 Å. The structure of M9 is more like that where the hydrogen atom is embedded in the lithium molecule, while M10 is more like the hydrogen atom floating away from the lithium molecule.
3.3 Avoided crossing point
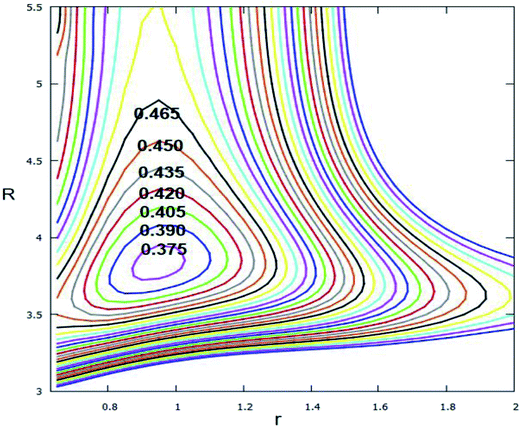
The avoided crossing point (ACP) area, is where the consequences of the interaction of an ionic state and a repulsive covalent state, plays an important role in the interpretation of organic phenomena.55 Since these two states transform each other they only need cross a small energy barrier, and the Born–Oppenheimer rule is not suited to this part. To clearly show the non-adiabatic event between the lowest two adiabatic states of Li2H, the ACP is studied in this work. Fig. 13 shows the difference in the lowest two adiabatic PESs. From this figure one can see that the minimum energy difference of these two states is approximately 0.369 eV; the structure of this ACP is r = 0.95 Å and R = 3.85 Å. Since the different energy is so small, the non-adiabatic event happens easily in this range.3.4 Conical intersection
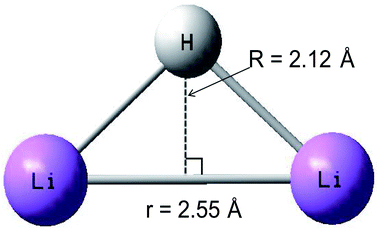
A conical intersection is a degenerate point of two PESs in the configuration space of a molecule. Because of the strong degeneracy, a nonadiabatic coupling between the two states forms, where the Born–Oppenheimer approximation does not apply. The conical intersection point has been well studied by theoretical scientists.56–59 The geometry of the conical intersection point is studied in detail, which has C2v symmetry, and the distance of the r is 2.55 Å and the R is 2.12 Å. Combining with Fig. 8, 12 and 19, one can conclude that the geometry of conical intersection point for the title system is between the minimum geometries of the ground state and the first excited state.3.5 2D diabatic PESs
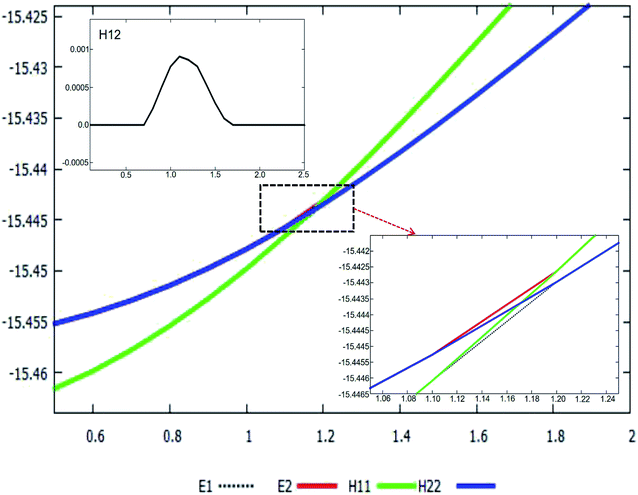
The adiabatic PESs with different angles and the avoided crossing part of Li2H system, have been introduced in the above subsections. In order to better understand the phenomena of degeneracy between different adiabatic states in the reaction process, the diabatic PESs are deduced with the adiabatic PESs. Fig. 14–17 describe the two diabatic PESs, H11 and H22, with different angles. In these pictures, the blue surface corresponds to H11 and the green surface corresponds to H22. From these figures one can analyze that the intersection of H11 and H22 is in the range of 3.2 Å < R < 3.7 Å, and is almost on the same line; with the decreasing R value, the ground state of the title system has H11 potential. Vice versa – as the two lithium atoms move away from each other – H22 becomes the ground state. For ease of analysis, a section of the crossing part is plotted in Fig. 18, where the R is fixed at 4.2 Å and θ = 90.0°. We could find that the diabatic PESs are very smooth, even near the crossing part. And near the crossing part, the nondiagonal element H12 is large, and other parts are zero.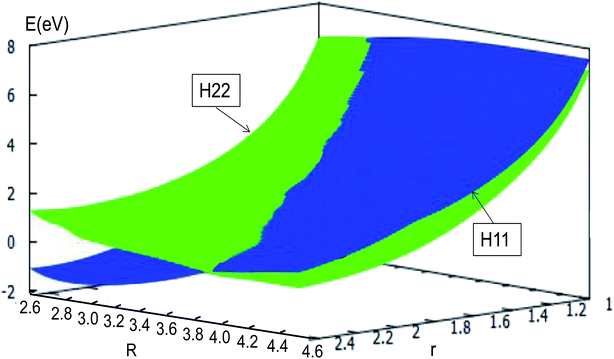 | ||
| Fig. 14 Diabatic potential energy surfaces (in eV) as a function of distances r and R (in Å) at angle θ = 0.0° in Jacobi coordinates. | ||
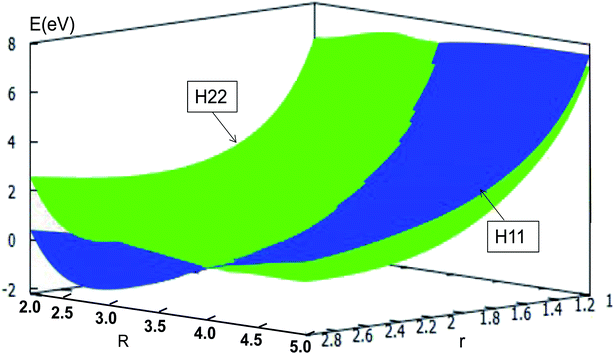 | ||
| Fig. 15 Diabatic potential energy surfaces (in eV) as a function of distances r and R (in Å) at angle θ = 30.0° in Jacobi coordinates. | ||
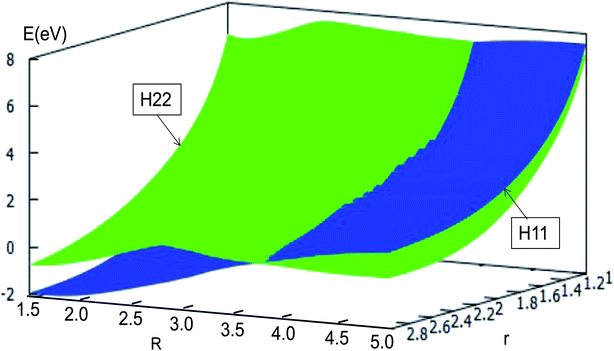 | ||
| Fig. 16 Diabatic potential energy surfaces (in eV) as a function of distances r and R (in Å) at angle θ = 60.0° in Jacobi coordinates. | ||
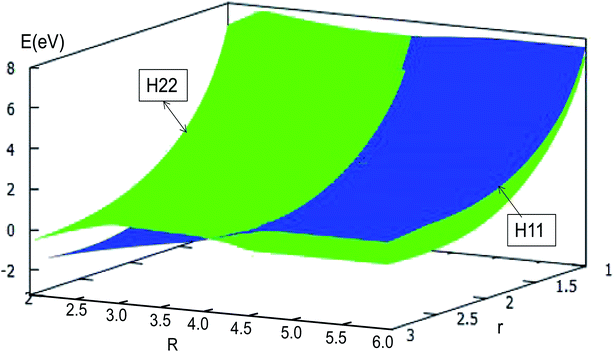 | ||
| Fig. 17 Diabatic potential energy surfaces (in eV) as a function of distances r and R (in Å) at angle θ = 90.0° in Jacobi coordinates. | ||
4 Conclusions
The global three dimensional adiabatic PESs for the first two lowest electronic states of Li2H are deduced with the B-spline fit method, using higher level ab initio MCSCF/MRCI energies calculated with V5Z basis sets over a large region of configuration space. In total 74![[thin space (1/6-em)]](https://www.rsc.org/images/entities/char_2009.gif) 070 ab initio energy points are deduced using two kinds of Jacobi coordinates (reactant coordinate and product coordinate) for each state. The accurate vibrational energies, which for different states of the diatomic molecule of the reactants (Li2) and products (LiH), are reported for the first time in the present work: 19 vibrational states are found for the ground state Li2 molecule; 11 vibrational states and 3 vibrational states are reported for the ground and the first excited states of the product LiH molecule, respectively. The global minima have C2v symmetry and the corresponding relative energies are −2.549 eV and −1.938 eV for the ground state and the first excited state of Li2H system, respectively; for ease of understanding the non-adiabatic process, the ACP and conical intersection of these two lowest adiabatic PESs are studied in the present work. The study proves that the non-adiabatic reaction event will happen easily since the different energies between these two lowest states is only 0.369 eV. At last, the lowest two diabatic PESs are derived using the adiabatic PESs in the present report.
070 ab initio energy points are deduced using two kinds of Jacobi coordinates (reactant coordinate and product coordinate) for each state. The accurate vibrational energies, which for different states of the diatomic molecule of the reactants (Li2) and products (LiH), are reported for the first time in the present work: 19 vibrational states are found for the ground state Li2 molecule; 11 vibrational states and 3 vibrational states are reported for the ground and the first excited states of the product LiH molecule, respectively. The global minima have C2v symmetry and the corresponding relative energies are −2.549 eV and −1.938 eV for the ground state and the first excited state of Li2H system, respectively; for ease of understanding the non-adiabatic process, the ACP and conical intersection of these two lowest adiabatic PESs are studied in the present work. The study proves that the non-adiabatic reaction event will happen easily since the different energies between these two lowest states is only 0.369 eV. At last, the lowest two diabatic PESs are derived using the adiabatic PESs in the present report.
Conflicts of interest
The authors declare no competing financial interest.Acknowledgements
This work is supported by the National Natural Science Foundation of China (No. 21573090, 21604031), Jilin Province Science and Technology Development Plan (20150101005JC). This work is supported by the High Performance Computing Center of Jilin University, China.References
- D. Galli and F. Palla, Astron. Astrophys., 1998, 335, 403–420 CAS.
- S. Lepp and J. M. Shull, Astrophys. J., 1984, 280, 465–469 CrossRef CAS.
- P. C. Stancil, A. Loeb, M. Zaldarriaga, A. Dalgarno and S. Lepp, Astrophys. J., 2002, 580, 29–35 CrossRef CAS.
- V. K. Dubrovich and A. A. Lipovka, Astron. Astrophys., 1995, 296, 301–306 CAS.
- P. C. Stancil and A. Dalgarno, Astrophys. J., 1997, 479, 543–546 CrossRef CAS.
- S. Bovino, M. Wernli and F. A. Gianturco, Astrophys. J., 2009, 699, 383–387 CrossRef CAS.
- E. Bodo, F. A. Gianturco and R. Martinazzo, Phys. Rep., 2003, 384, 85–119 CrossRef CAS.
- N. J. Clarke, M. Sironi, M. Raimondi, S. Kumar, F. A. Gianturco, E. Buonomo and D. L. Cooper, Chem. Phys., 1998, 233, 9–27 CrossRef CAS.
- M. Signore, G. Vedrenne, P. De. Bernardis, V. Dubrovich, P. Encrenaz, R. Maoli, S. Masi, G. Mastrantonio, B. Melchiorri, F. MelchioRRi and P. E. Tanzili, Astrophys. J., Suppl. Ser., 1994, 92, 535–537 CrossRef CAS.
- R. Maoli, F. Melchiorri and D. Tosti, Astrophys. J., 1994, 425, 372–381 CrossRef CAS.
- P. von Gagué Schleyer and J. A. PoPle, Chem. Phys. Lett., 1986, 129, 475–480 CrossRef.
- T. Roy and S. Mahapatra, J. Chem. Phys., 2012, 136, 174313–174325 CrossRef.
- W. Wang, Q. Li, Q. Li, X. Yang and G. Le, Mater. Sci. Technol., 2016, 32, 434–437 Search PubMed.
- P. Gislon and P. P. Prosini, Int. J. Hydrogen Energy, 2011, 36, 240–246 CrossRef CAS.
- C. H. Wui and H. R. Ihle, J. Chem. Phys., 1977, 66, 4356 CrossRef.
- B. Vezin, P. Dugourd, D. Rayane, P. Labastie and M. Broyer, Chem. Phys. Lett., 1993, 202, 209 CrossRef CAS.
- R. Antoine, P. Dugourd, D. Rayane, A. R. Allouche, M. AubertFrecon and M. Broyer, Chem. Phys. Lett., 1996, 261, 670–676 CrossRef CAS.
- A. L. Companion, J. Chem. Phys., 1968, 48, 1186–1191 CrossRef CAS.
- P. Siegbahn and H. F. Schaefer, J. Chem. Phys., 1975, 62, 3488–3495 CrossRef CAS.
- C. P. Shukla, N. Sathyamurthy and I. P. Khuller, J. Chem. Phys., 1987, 87, 3251 CrossRef CAS.
- S. K. Kim and D. R. Herschbach, Faraday Discuss. Chem. Soc., 1987, 84, 159–169 RSC.
- S. K. Kim, S. C. Jeoung, A. Lay-Choo Tan and D. R. Herschbach, J. Chem. Phys., 1991, 95, 3854–3856 CrossRef CAS.
- W. Fang, X. You and Z. Yin, Chem. Phys. Lett., 1995, 233, 237–242 CrossRef CAS.
- Y. Guosen, X. Hui and D. Xie, Sci. China, Ser. B: Chem., 1997, 40, 342–347 CrossRef.
- A. M. Maniero, P. H. Acioli, G. M. Silva and R. Gargano, Chem. Phys. Lett., 2010, 490, 123–126 CrossRef CAS.
- W. Skomorowski, F. Pawlowski, T. Korona, R. Moszynski, P. S. Zuchowski and J. M. Hutson, J. Chem. Phys., 2011, 134, 114109–114125 CrossRef.
- H. V. R. Vila, L. A. Leal, J. B. L. Martins, D. Skouteris, G. M. Silva and R. Gargano, J. Chem. Phys., 2012, 136, 134319 CrossRef.
- Y. Z. Song, Y. Q. Li, S. B. Gao and Q. T. Meng, Eur. Phys. J. D, 2014, 68, 3–11 CrossRef.
- S. B. Gao, J. Zhang, Y. Z. Song and Q. T. Meng, Eur. Phys. J. D, 2015, 69, 111–117 CrossRef.
- M. L. Yuan, W. T. Li and M. D. Chen, Int. J. Quantum Chem., 2017, 117, e25380–e25386 CrossRef.
- Z. L. Zhu, B. Dong and W. Li, Comput. Theor. Chem., 2017, 1115, 248–252 CrossRef CAS.
- T. Ferreira da Cunha, H. Vieira Rivera Vila, W. Ferreira da Cunha, L. G. M. de Macedo and R. Gargano, J. Mol. Model., 2017, 23, 116–126 CrossRef.
- H. Vieira Rivera Vila, L. A. Ribeiro Jr, L. G. M. de Macedo and R. Gargano, Sci. Rep., 2018, 8, 1044–1057 CrossRef.
- T. H. Dunning, J. Chem. Phys., 1989, 90, 1007–1023 CrossRef CAS.
- H. J. Werner, P. J. Knowles, G. Knizia, F. R. Manby, M. Schuetz, et al., MOLPRO, version 2012.1, a package of ab initio programs, http://www.molpro.net Search PubMed.
- D. Q. Wang, L. W. Fu, Z. X. Qu, Y. K. Chen and X. R. Huang, Eur. Phys. J. D, 2017, 71, 252–258 CrossRef.
- L. W. Fu, D. Q. Wang and X. R. Huang, RSC Adv., 2018, 8, 15595–15602 RSC.
- D. Q. Wang, D. G. Wang, L. W. Fu and X. R. Huang, Chem. Phys., 2019, 517, 228–236 CrossRef CAS.
- D. Q. Wang, D. G. Wang, L. W. Fu, J. Y. Wang, G. Shi, Y. C. Li and X. R. Huang, RSC Adv., 2019, 9, 1929–1932 RSC.
- D. Q. Wang, G. Shi, L. W. Fu, R. L. Yin and Y. B. Ji, ACS Omega, 2019, 4, 12167–12174 CrossRef CAS.
- R. L. Yin, N. Gao, R. M. Zhang, D. Q. Wang and X. R. Huang, Chem. Phys., 2020, 538, 110906–110913 CrossRef CAS.
- N. Sathyamurthy and L. M. Raff, J. Chem. Phys., 1975, 63, 464–473 CrossRef CAS.
- M. Patrício and J. L. Santos, J. Math. Chem., 2013, 51, 1729–1746 CrossRef.
- R. J. Le Roy, University of Waterloo Chemical Physics Research Report CP-663, 2007.
- D. Q. Wang, PhD thesis, Siegen University, Germany, 2013.
- D. He, J. C. Yuan, H. X. Li and M. D. Chen, Sci. Rep., 2016, 6(1–9), 25083 CrossRef CAS.
- J. C. Yuan, D. He, S. F. Wang, M. D. Chen and K. L. Han, Phys. Chem. Chem. Phys., 2018, 20, 6638–6647 RSC.
- A. J. Dobbyn and P. J. Knowles, Mol. Phys., 1997, 91, 1107–1124 CAS.
- J. N. Byrd, J. A. Montgomery and H. Harvey Michels Jr, Int. J. Quantum Chem., 2009, 109(13), 3112–3119 CrossRef CAS.
- J. Kendrick and I. H. Hillier, Mol. Phys., 1977, 33, 635–640 CrossRef CAS.
- W. C. Swalley and W. T. Zemke, J. Phys. Chem. Ref. Data, 1993, 22, 87–112 CrossRef.
- A. M. Maniero and P. H. Acioli, Int. J. Quantum Chem., 2005, 103, 711–717 CrossRef CAS.
- C. E. Moore, Atomic Energy Levels, National Bureau Standards (U.S.), Cir. No. 467, G. P. O, Washington, DC, 1971, p. 4 Search PubMed.
- M. J. Frisch, G. W. Trucks, H. B. Schlegel, G. E. Scuseria, M. A. Robb, J. R. Cheeseman, G. Scalmani, V. Barone, B. Mennucci, G. A. Petersson, et al., Revision A. 02, Gaussian Inc, Wallingford, CT, 2009 Search PubMed.
- L. Salem, C. Leforestier, G. Segal and R. Wetmore, J. Am. Chem. Soc., 1975, 97, 479–487 CrossRef CAS.
- M. Baer, Chem. Phys. Lett., 1975, 35, 112–118 CrossRef CAS.
- S. Ghosh, S. Mukherjee, B. Mukherjee, S. Mandal, R. Shama, P. Chaudhury and S. Adhikari, J. Chem. Phys., 2017, 147, 074105–074121 CrossRef.
- S. Mukherjee, D. Mukhopadhyay and S. Adhikari, J. Chem. Phys., 2014, 141, 204306–204319 CrossRef.
- B. Sarkar and S. Adhikan, J. Chem. Phys., 2006, 124, 074101–074119 CrossRef.
Footnote |
| † These authors contributed equally to the work. |
| This journal is © The Royal Society of Chemistry 2020 |


