 Open Access Article
Photocatalytic and bactericidal properties and molecular docking analysis of TiO2 nanoparticles conjugated with Zr for environmental remediation
M. Ikram *a,
J. Hassanb,
A. Razab,
A. Haiderc,
S. Nazd,
A. Ul-Hamid
 *e,
J. Haiderd,
I. Shahzadif,
U. Qamarb and
S. Alib
aSolar Cell Applications Research Lab, Department of Physics, Government College University Lahore, 54000, Punjab, Pakistan. E-mail: dr.muhammadikram@gcu.edu.pk
bDepartment of Physics, Riphah Institute of Computing and Applied Sciences (RICAS), Riphah International University, 14 Ali Road, Lahore, Pakistan
cDepartment of Clinical Medicine and Surgery, University of Veterinary and Animal Sciences, Lahore 54000, Punjab, Pakistan
dTianjin Institute of Industrial Biotechnology, Chinese Academy of Sciences, Tianjin 300308, China
eCenter for Engineering Research, Research Institute, King Fahd University of Petroleum & Minerals, Dhahran, 31261, Saudi Arabia. E-mail: anwar@kfupm.edu.sa
fCollege of Pharmacy, University of the Punjab, Lahore, 54000, Pakistan
First published on 14th August 2020
Abstract
Despite implementing several methodologies including a combination of physical, chemical and biological techniques, aquatic and microbial pollution remains a challenge to this day. Recently, nanomaterials have attracted considerable attention due to their extraordinary prospective for utilization toward environmental remediation. Among several probable candidates, TiO2 stands out due to its potential for use in multifaceted applications. One way to improve the catalytic and antimicrobial potential of TiO2 is to dope it with certain elements. In this study, Zr-doped TiO2 was synthesized through a sol–gel chemical method using various dopant concentrations (2, 4, 6, and 8 wt%). Surface morphological, microstructural and elemental analysis was carried out using FESEM and HR-TEM along with EDS to confirm the formation of Zr–TiO2. XRD spectra showed a linear shift of the (101) anatase peak to lower diffraction angles (from 25.4° to 25.08°) with increasing Zr4+ concentration. Functional groups were examined via FTIR, an ample absorption band appearing between 400 and 700 cm−1 in the acquired spectrum was attributed to the vibration modes of the Ti–O–Ti linkage present within TiO2 nanoparticles, which denotes the formation of TiO2. Experimental results indicated that with increasing dopant concentrations, photocatalytic potential was enhanced significantly. In this respect, TiO2 doped with 8 wt% Zr (sample 0.08![[thin space (1/6-em)]](https://www.rsc.org/images/entities/char_2009.gif) :
:![[thin space (1/6-em)]](https://www.rsc.org/images/entities/char_2009.gif) 1) exhibited outstanding performance by realizing 98% elimination of synthetic MB in 100 minutes. This is thought to be due to a decreased rate of electron–hole pair recombination that transpires upon doping. Therefore, it is proposed that Zr-doped TiO2 can be used as an effective photocatalyst material for various environmental and wastewater treatment applications. The good docking scores and binding confirmation of Zr-doped TiO2 suggested doped nanoparticles as a potential inhibitor against selected targets of both E. coli and S. aureus. Hence, enzyme inhibition studies of Zr-doped TiO2 NPs are suggested for further confirmation of these in silico predictions.
1) exhibited outstanding performance by realizing 98% elimination of synthetic MB in 100 minutes. This is thought to be due to a decreased rate of electron–hole pair recombination that transpires upon doping. Therefore, it is proposed that Zr-doped TiO2 can be used as an effective photocatalyst material for various environmental and wastewater treatment applications. The good docking scores and binding confirmation of Zr-doped TiO2 suggested doped nanoparticles as a potential inhibitor against selected targets of both E. coli and S. aureus. Hence, enzyme inhibition studies of Zr-doped TiO2 NPs are suggested for further confirmation of these in silico predictions.
1. Introduction
Titanium dioxide (TiO2), is a promising material that is widely used due to its low cost, ease of availability, high stability, non-toxicity, optoelectronic nature, and especially excellent photocatalytic properties.1,2 TiO2 exists in numerous crystallographic forms including anatase (tetragonal), rutile (tetragonal), and brookite (orthorhombic); among these anatase is the most significant and stable compound. Large surface area, high degree of crystallinity, and superior physical and chemical properties make TiO2 a reliable source for use in biological sensors, medical diagnosis, and solar cell applications.3,4 TiO2 nanoparticles exhibit highly improved properties when compared with their bulk counterparts solely due to the former's nano-based structure.5 Anatase TiO2 has a wide band gap (∼3.2 eV) compared to rutile (∼3.02 eV) and can absorb UV light up to 387 nm, which is appropriate for photocatalysis. This wide band gap enables 4% of solar energy present on earth's surface to be utilized.6,7 Anatase TiO2 semiconductor reveals excellent characteristics due to high absorbance and electron recombination rate compared to rutile.8 Various methods are used to synthesize TiO2 including thermal evaporation,9 precipitation,10 chemical vapor deposition (CVD),11 hydrothermal,12 and mechanical ball milling.13 Among these, sol–gel technique14 is attractive due to its ability to attain homogenous, ultrafine nanoparticles with outstanding morphology. Another important advantage of sol–gel process is that it enables synthesis of materials with required stoichiometry and desired amount of doping with uniform dispersion.15Titania however suffers from a number of drawbacks that limit its practical applications in photocatalysis. Firstly, the photogenerated electrons and holes coexist in titania particle and probability of their recombination is high. This leads to a low rate of desired chemical transformation with respect to the absorbed light energy. The relatively large band gap energy (∼3.2 eV) requires ultraviolet light for photoactivation, resulting in a very low efficiency in utilizing solar light. UV light accounts for only about 5% of the solar spectrum compared to visible light (45%).16,17 In addition, since titania is non-porous with a polar surface, it exhibits low absorption capability for non-polar organic pollutants. Also, the challenge to recover nano-sized titania particles from treated water adds to both economic and safety concerns. The TiO2 nanoparticles also suffer from aggregation and agglomeration which affect photoactivity as well as light absorption. Several strategies have been employed to overcome these drawbacks.16,18 These strategies include extending the wavelength of photoactivation of TiO2 into visible region of the spectrum thereby increasing the utilization of solar energy; preventing electron/hole pair recombination and thus allowing more charge carriers to successfully diffuse to the surface; increasing the absorption affinity of TiO2 towards organic pollutants as well as preventing the aggregation and agglomeration of nano-titania particles while easing their recovery from treated water.16,19,20
Heavy metal ions found in industrial and livestock waste may precipitate several ailments that can endanger human and acoustic life. Various methods such as sorption, chemical oxidation, and filtration are deployed to purify wastewater.21–27 Among these, photocatalysis is a remarkable application that can be employed for converting solar energy into chemical energy without any harmful side effects.23–25,27–30 Various strategies are employed to enhance the photocatalytic activity of TiO2 catalyst that was discovered in 1972 by Honda and Fujishima.31,32 Metal doping has been extensively used to advance efforts at developing modified TiO2 photocatalysts to operate efficiently under visible light. The photoactivity of metal-doped TiO2 photocatalysts depends to a large extent on the nature of the dopant ion, its concentration, the method used for doping, the type of TiO2 used as well as the reaction for which the catalyst is used and the reaction conditions, and the mechanism of lowering of band gap energy of TiO2 with metal doping.16,33,34 It is believed that doping TiO2 with metals results in an overlap of the Ti 3d orbitals with d levels of metals causing a shift in the absorption spectrum to longer wavelengths which in turn favors the use of visible light to photoactivate TiO2.16 A review of the relevant literature in this regard signifies that doping TiO2 with a transition metal such as Au,35 Ag,36 Cr, and Pt37 is an effective approach to enhance photocatalytic potential of the host material for use in impurity degradation applications. Besides, co-doping with multiple metals serves to increase efficiency and as a result enhance the efficacy of photocatalytic process.13,38,39 Several studies using various approaches to modify TiO2 with an aim to improve its photocatalytic activity have been reported. The most achievable method thus far appears to be doping with metal or nonmetals. Doping with metallic or nonmetallic ions serves to overcome migration of excitons from the inside of photocatalyst to the surface by suppressing excitons recombination that is generated through employment of light, thus raising photo quantum efficiency.40,41 Within the TiO2 structure, recombination of excitons is inhibited through charge trapping when an appropriate amount of Zr+4 ions replaces Ti4+ which in turn causes to accelerate photocatalytic activity.42 Host Ti and dopant Zr both correspond to IV-B group of periodic table and interestingly oxides of these two materials (TiO2 and ZrO2) are n-type semiconductors that exhibit comparable physical and chemical properties. Collective precipitation of Ti and Zr salts causes to compound their mutual interaction.42 Doping of transition metal in the TiO2 lattice gives rise to surface modification and crystal defects while altering its photocatalytic activity by suppressing excitons recombination through the phenomenon of trapping.43 Furthermore, Zr belongs to isoelectric impurity element with deep energy level doping.28,44 Besides this, the presence of Zr provides synergistic effects that further contribute to the improvement in photocatalysis. Interest in Zr-doped TiO2 nanocomposite is well placed since both Zr and TiO2 have similar valance structure. Substitutional doping of Zr in TiO2 serves to enhance bond length, and stabilize anatase phase.36
Another emerging application of TiO2 nanoparticles is as an antibacterial agent. This bactericidal characteristic of TiO2 is primarily attributed to the oxidative stress present due to the production of reactive oxygen species (ROS) containing hydroxyl radicals i.e. OH˙ and generation of hydrogen peroxide (H2O2) under ultra-visible light, therefore, rendering TiO2 as a potent means to kill bacteria.45–47 The generated ROS leads to direct contact between cells and nanoparticles, which cause cell death due to the damage induced in the cell membrane and DNA, ultimately resulting in cessation of cell cycle.46,48–50 It prevents and destroys major pathogens and foodborne such as E. coli, Methicillin-resistant Staphylococcus aureus (MRSA), Bacillus subtilis, S. aureus, and Pseudomonas24,26,51–53. Several Zr-based materials show promising biological responses due to their excellent biocompatibility. Both the crystal structure and shape of TiO2 NPs are the most important factors that affect their physicochemical properties, and therefore their antimicrobial behavior.54,55 With respect to crystal structure, anatase exhibits the highest photocatalytic and antimicrobial activity. Some works have shown that anatase structure can produce OH˙ radicals in a photocatalytic reaction, and as explained above, bacteria wall and membranes are effectively terminated.55,56 Certainly, in some studies, these materials have also shown high effectiveness at reducing the feasibility of adherent bacterial species such as E. coli, Methicillin-resistant Staphylococcus aureus (MRSA), Bacillus subtilis, S. aureus, and Pseudomonas and therefore have been extensively used in biomedical applications.57–60
In the current research work, we aimed to synthesize TiO2 nanoparticles doped with various concentrations (2, 4, 6, and 8 wt%) of Zr through sol–gel method. The synthesized products were employed as photocatalysts to treat industrial wastewater and remove synthetic dye (Methylene blue). Furthermore, the level of its antimicrobial activity was evaluated against Methicillin-resistant Staphylococcus aureus (MRSA). High antibacterial activity of Zr-doped TiO2 against S. aureus was attributed to cell wall rupture and/or to other biosynthetic pathways considered vital for bacterial survival and growth. Molecular docking analysis was performed to provide an insight into the interaction pattern of Zr-doped TiO2 nanoparticles with selected protein targets such as dihydrofolate reductase (DHFR) and dihydropteroate synthase (DHPS) of folate biosynthetic pathway along with DNA gyrase from both E. coli and S. aureus.
2. Experimental section
2.1 Materials
Titanium(IV) butoxide (Ti(OBu)4) (98%), zirconium acetate (C4H6O4Zr) were purchased from Sigma-Aldrich Co. (Germany) and hydrochloric acid (HCl, 37%) was acquired from Analar. Reagents used in this research were employed without additional purification.2.2 Synthesis of pure and Zr-doped TiO2 samples
Pure TiO2 and Zr-doped TiO2 samples were synthesized using sol–gel method. Initially, 10 ml of Ti(OBu)4 was dissolved in 50 ml methanol and 3 ml deionized water with the addition of 2 ml HCL under stirring for 2 hours; this solution was considered solution 1. Various concentrations of zirconium acetate (2, 4, 6, and 8 wt%) were vigorously dissolved in deionized water referred to as solution 2. Later, solution 2 was added dropwise into solution 1 under constant stirring. During synthesis, a mixture of water and ethanol was added gradually and the solution was magnetically stirred at 50 °C for 2 hours. Finally, prepared products were annealed at 400 °C to acquire nanoparticles of anatase as shown in Fig. 1.41,612.3 Evaluation of photocatalytic activity
Photocatalytic activity of prepared products was evaluated by recording significant degradation rate of certain industrial pollutants such as synthetic and toxic methylene blue (MB) dye in aqueous solution as displayed in Fig. 2. The stock solution of MB (5 g/500 ml) was arranged and 10 mg of prepared photocatalysts (0![[thin space (1/6-em)]](https://www.rsc.org/images/entities/char_2009.gif) :
:![[thin space (1/6-em)]](https://www.rsc.org/images/entities/char_2009.gif) 1, 0.02
1, 0.02![[thin space (1/6-em)]](https://www.rsc.org/images/entities/char_2009.gif) :
:![[thin space (1/6-em)]](https://www.rsc.org/images/entities/char_2009.gif) 1, 0.04
1, 0.04![[thin space (1/6-em)]](https://www.rsc.org/images/entities/char_2009.gif) :
:![[thin space (1/6-em)]](https://www.rsc.org/images/entities/char_2009.gif) 1, 0.06
1, 0.06![[thin space (1/6-em)]](https://www.rsc.org/images/entities/char_2009.gif) :
:![[thin space (1/6-em)]](https://www.rsc.org/images/entities/char_2009.gif) 1, and 0.08
1, and 0.08![[thin space (1/6-em)]](https://www.rsc.org/images/entities/char_2009.gif) :
:![[thin space (1/6-em)]](https://www.rsc.org/images/entities/char_2009.gif) 1) were blended with 60 ml stock solution, which was retained in dark for 30 min to attain equilibrium between MB and photocatalyst before exposing it to light. After strong stirring for 15 min, the solution was transferred to a photoreactor operated with a Hg lamp (400 W with a wavelength of 400–700 nm). A distance of 15 cm was kept between the solution and light source to inhibit overheating. After complete exposure to light for a fixed time interval of 20 minutes, 3 ml of solution was extracted to measure dye concentration using a UV-vis spectrograph at λmax = 665 nm of MB absorbance. The collected solution was centrifuged at 4000 rpm for 5 minutes to extract photocatalyst from the solution to check the reusability of samples. Dye absorbance decreased gradually at λmax after fixed time intervals that demonstrated decolorization rate and PCA efficiency of photocatalysts as calculated using eqn (1).
1) were blended with 60 ml stock solution, which was retained in dark for 30 min to attain equilibrium between MB and photocatalyst before exposing it to light. After strong stirring for 15 min, the solution was transferred to a photoreactor operated with a Hg lamp (400 W with a wavelength of 400–700 nm). A distance of 15 cm was kept between the solution and light source to inhibit overheating. After complete exposure to light for a fixed time interval of 20 minutes, 3 ml of solution was extracted to measure dye concentration using a UV-vis spectrograph at λmax = 665 nm of MB absorbance. The collected solution was centrifuged at 4000 rpm for 5 minutes to extract photocatalyst from the solution to check the reusability of samples. Dye absorbance decreased gradually at λmax after fixed time intervals that demonstrated decolorization rate and PCA efficiency of photocatalysts as calculated using eqn (1).
 | (1) |
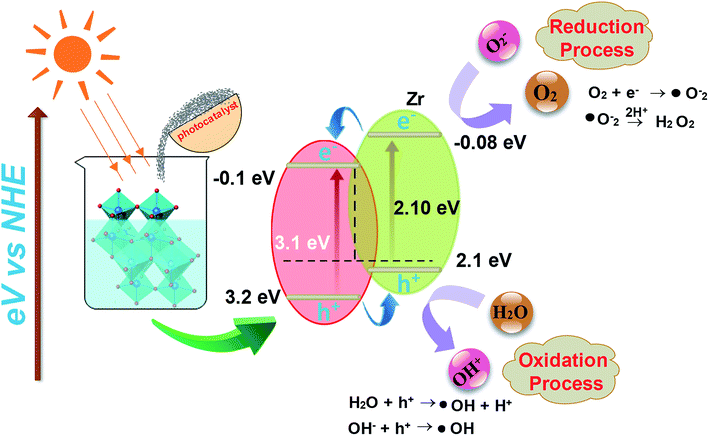
I. Photoexcitation. The photocatalytic reaction is prompted by photons of energy E = hv or those with energy higher than the band gap energy, such that photoelectrons (e−) are shifted from the lower band (valance band-VB) to higher band (conduction band-CB). The excitation process generates a hole in VB thus resulting in one electron–hole pair (e−–h+) as depicted in eqn 2
| TiO2 + hv → TiO2(e−) + h+ | (2) |
II. Ionization of water. Photogenerated h+ produce OH˙ free radical after reaction with water:
| H2O(ads) + h+ → OH˙(ads) + H+(ads) | (3) |
The HO˙ radical produced on the irradiated surface of semiconductor is a strong oxidant agent. It selectively targets adsorbed organic molecules or those which are very close to the catalyst surface that contributes to mineralization depending on the structure and degree of stability. In this manner, biological compounds are attacked easily and microorganisms are eliminated to enhance decontamination.
Not only it can quickly target biological compounds, but microorganisms can be killed to enhance decontamination.
III. Oxygen ionosorption. Photogenerated electrons are readily picked up by oxygen molecules to produce superoxide radicals (O2−) and electrons interacting with surface-bound water molecules (OH−).
| O2 + e− → O2˙−(ads) | (4) |
The superoxide ion can not only take part in more oxidation cycles, but it can also inhibit recombination of e−–h+ and thus serves to keep TiO2 molecule neutral.
IV. Protonation of superoxide. Superoxide ions (O2−) provide protonated hydroperoxylate radical (H2O˙) and finally H2O2 is dissociated into strongly reactive OH˙.
| O2˙−(ads) + H + ⇌ HOO˙(ads) | (5) |
| 2HOO˙(ads) → H2O2(ads) +O2 | (6) |
| H2O2(ads) → 2OH˙(ads) | (7) |
| Dye + OH˙ → CO2 + H2O (dye intermediates) | (8) |
| Dye + h+(VB) → oxidation products | (9) |
| Dye + e−(CB) → reduction products | (10) |
Oxidation and reduction processes take place simultaneously on the surface of photo-excited photocatalyst.64–66
2.4 Isolation and identification of S. aureus and E. coli
Goat (caprine) clinically positive mastitis milk samples were collected from private farms of Punjab (Pakistan) and cultured on 5% sheep blood agar (SBA). The cultured isolates were further purified by streaking on MacConkey agar (MA) and mannitol salt agar (MSA) in order to isolate E. coli and S. aureus, respectively in triplets. Morphological and biochemical characterization of purified isolates was undertaken through Gram's staining, catalase, and coagulase tests.672.5 Antimicrobial activity
Antimicrobial evaluation of Zr-doped TiO2 was undertaken through agar well diffusion assay by swabbing 1.5 × 10⁸ CFU ml−1 of isolated G −ve and G +ve stains on MA and MSA, respectively. Various ratios of Zr-doped TiO2 (0.5 mg/50 μl) & (1.0 mg/50 μl) were poured as low and high dose into 6 mm wells on MA and MSA plates formed with sterile cork borer with a micropipette. Ciprofloxacin (0.005 mg/50 μl) and deionized water (50 μl) were designated as positive (+ve) and negative (−ve) controls. Antimicrobial efficacy was assessed by measuring the inhibition zones (in mm) using vernier caliper after incubation of plates at 37 °C for 12 hours. The antimicrobial efficacy of Zr-doped TiO2 was considered statistically significant using a one-way analysis of variance (ANOVA).682.6 Molecular docking study
Molecular docking study of Zr-doped TiO2 nanoparticles was performed to gain insight into molecular interactions at atomic level. Since discovery of trimethoprim and other sulfonamide drugs, the folate biosynthetic pathway represents an attractive target for new antibiotics discovery.69,70 Similarly, DNA gyrase is essential for bacterial survival and represents another attractive target for antibiotics discovery.71,72 Here, we selected dihydrofolate reductase (an approved target of trimethoprim) and dihydropteroate synthase (inhibited by sulfonamide drugs) from folate biosynthetic pathway along with DNA gyrase from both E. coli and S. aureus as a possible target to explore the binding interaction of Zr-doped TiO2 nanoparticles with their binding sites.The target proteins structures were obtained as 3D-crystals from protein data bank with PDB ID: 2ANQ at 2.1 Å Resolution,73 PDB ID: 5U0V at 1.7 Å resolution,74 and PDB ID: 6KZX at 2.1 Å resolution,75 for dihydrofolate reductase (DHFR), dihydropteroate synthase (DHPS) and DNA gyrase, respectively from E. coli as shown in Fig. 3a–c. Similarly, the crystal structures used in case of S. aureus possess PDB ID: 3FY8 at 2.2 Å resolution,76 for dihydrofolate reductase, PDB ID: 4HB7 at 1.9 Å resolution for dihydropteroate synthase and PDB ID: 5CTU at 1.4 Å resolution77 for DNA gyrase as depicted in Fig. 3d–f.
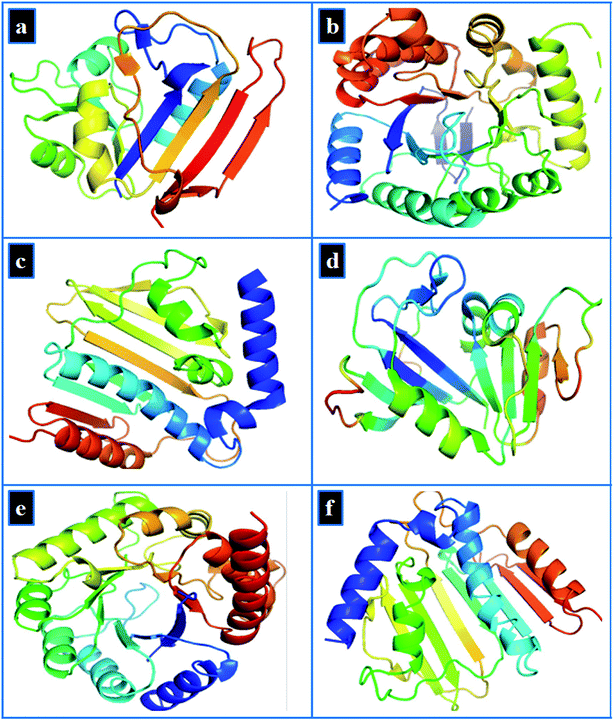 | ||
| Fig. 3 3D-structure of target proteins of E. coli, (a) dihydrofolate reductase (PDB: 2ANQ), (b) dihydropteroate synthase (PDB: 5U0V), (c) DNA gyrase (PDB: 6KZX) and for S. aureus (d) dihydrofolate reductase (PDB: 3FY8), (e) dihydropteroate synthase (PDB: 4HB7), (f) DNA gyrase (PDB: 5CTU). | ||
Molecular docking study of NPs with target proteins was performed using Molecular Operating Environment (MOE) software.42 Preparation of target protein structures was a multistep process that involved (i) removal of water, (ii) removal of crystallized ligand, (iii) addition of hydrogen atoms, and (iv) energy minimization. The target protein structure was protonated using the 3D-protonation tool of MOE and energy minimization was undertaken using default parameters of energy minimization algorithm (MMFF94x force field, gradient: 0.05) of MOE. Later, systematic conformational search at default parameters (RMS gradient of 0.001 kcal mol−1) using Site Finder was carried out on these protein models. Finally binding pocket of target protein was specified within 10 Å co-crystallized ligand. To get the best binding interaction of Zr-doped TiO2 nanoparticles inside active pocket, 10 top-ranked docking conformations were generated and the lowest energy conformation was used for further NPs-protein interaction analysis in each case. Both MOE and DS visualizer78 were used for the analysis of docking results and representation of their 3D-view.
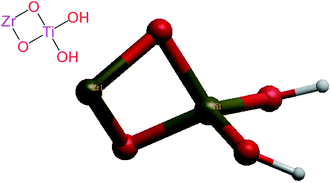
The crystal structures of anatase TiO2 in.cif format were obtained from PubChem and modified using Gaussian 09 software to generate Zr-doped TiO2 NPs structure for docking as shown in Fig. 4.
2.7 Materials characterization
Structural properties and crystallite size were measured using XRD (PAN analytical X'pert pro XRD) with Cu-Kα radiation (λ = 0.154 nm), diffraction angle varying from 20° to 80°. The presence of functional groups was detected with FTIR using PerkinElmer spectrometer. FESEM and HR-TEM were employed to study surface morphologies using JEOL JSM-6460LV, and JEM 2100F, respectively coupled with EDS spectrometer. Absorption spectra were acquired using a UV-visible-Genesys 10S spectrophotometer. PL spectroscopy was carried out to study migration and recombination of electron–hole pairs using a spectrofluorometer (JASCO, FP-8300). The Molecular Operating Environment (MOE) software was employed for molecular docking study.3. Results and discussion
XRD was employed to analyze crystal structure, phase purity, and crystallite sizes of prepared samples. Diffractogram is plotted between 10–80° as shown in Fig. 5a. In acquired spectra, distinct reflections are located around ∼25.47°, 37.79°, 48.18°, 53.87°, 55.17°, 62.68°, 68.74°, 70.29° and 75.05° which are indexed as (101), (004), (200), (105), (211), (204), (116), (220), and (215) planes, respectively. These crystallographic planes correspond to the tetragonal structure of anatase phase of Zr-doped TiO2 associated with standard spectrum (JCPDS card 21-1272) along I41/amd (141) space group.51,79–84 The interlayer spacing was ∼0.35 nm for TiO2 corresponding to (101) plane, which was also verified with HR-TEM observation (see Fig. 8). A slight shift to higher values in layer spacing (0.355 nm) upon Zr doping is attributed to homogeneous distribution of dopant elements between interlayers of host sample that is consistent with the peaks shift observed in XRD analysis.36,85,86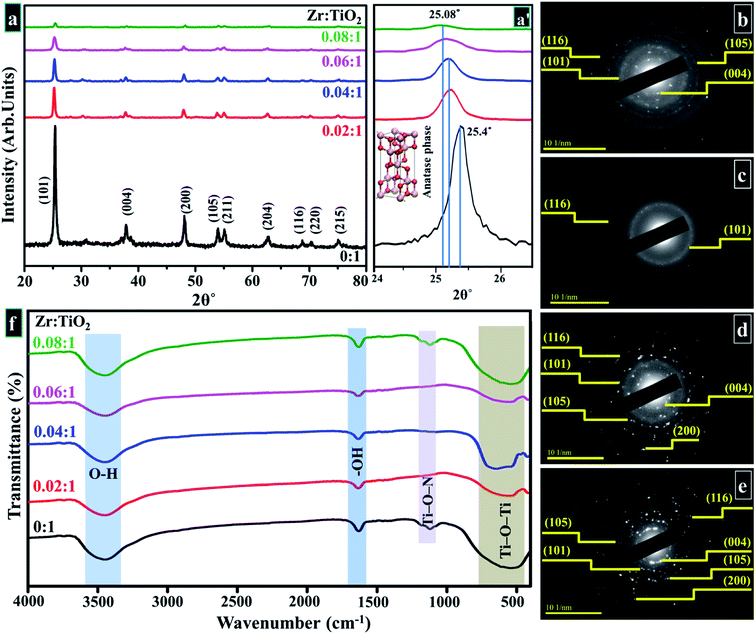 | ||
| Fig. 5 (a) XRD pattern (a′) zoomed area of (101) plane (b–e) SAED profiles of as-prepared and Zr-doped TiO2, respectively (f) FTIR spectra. | ||
With Zr incorporation, no obvious peak originating from the dopant or formation of any crystal phase of dopant species was observed in XRD spectra. This observation does not imply the absence of Zr-based plane/phases in the doped samples. It simply suggests that Zr ions are homogenously distributed in TiO2 matrix, and concentration of dopant is too low for detection with XRD.36,51,79,87 The ionic radius of Zr4+ (0.72 Å) is only slightly larger than that of Ti4+ (0.65 Å), which favors substitutional doping such that Zr4+ dopant ions replace Ti4+ ions and occupy their lattice positions within TiO2 matrix. This replacement causes an enlargement in cell volume, such an effect is larger for samples with higher doping concentrations of Zr4+ ions incorporated in host lattice. XRD spectra show a linear shift of (101) anatase peak to lower diffraction angles (25.4° to 25.08°) with increasing Zr4+ content (Fig. 5a′).51,79,87–91 However, the introduction of large-sized Zr nanoparticles contributes to the development of lattice strain and ultimately causes formation of oxygen sites and prevention of grain growth.85 The crystallite sizes of samples were calculated by using Debye Scherer formula in eqn 11.
 | (11) |
Zr![[thin space (1/6-em)]](https://www.rsc.org/images/entities/char_2009.gif) : :![[thin space (1/6-em)]](https://www.rsc.org/images/entities/char_2009.gif) TiO2 TiO2 |
Crystallite size (nm) | Eg (eV) |
|---|---|---|
0![[thin space (1/6-em)]](https://www.rsc.org/images/entities/char_2009.gif) : :![[thin space (1/6-em)]](https://www.rsc.org/images/entities/char_2009.gif) 1 1 |
22.22 | 3.23 |
0.02![[thin space (1/6-em)]](https://www.rsc.org/images/entities/char_2009.gif) : :![[thin space (1/6-em)]](https://www.rsc.org/images/entities/char_2009.gif) 1 1 |
19.51 | 2.91 |
0.04![[thin space (1/6-em)]](https://www.rsc.org/images/entities/char_2009.gif) : :![[thin space (1/6-em)]](https://www.rsc.org/images/entities/char_2009.gif) 1 1 |
18.90 | 2.53 |
0.06![[thin space (1/6-em)]](https://www.rsc.org/images/entities/char_2009.gif) : :![[thin space (1/6-em)]](https://www.rsc.org/images/entities/char_2009.gif) 1 1 |
17.26 | 2.22 |
0.08![[thin space (1/6-em)]](https://www.rsc.org/images/entities/char_2009.gif) : :![[thin space (1/6-em)]](https://www.rsc.org/images/entities/char_2009.gif) 1 1 |
15.03 | 2.10 |
FTIR spectra revealed attached functional groups corresponding to their molecular vibration modes as presented in Fig. 5f. An ample absorption band appearing between 400 - 700 cm−1 in the acquired spectrum was attributed to the vibration modes of Ti–O–Ti linkage present within TiO2 nanoparticles, which denotes the formation of TiO2.91,93–96 The low absorption band around ∼1062 cm−1 forms due to Ti–O–N bonding.97 The measurable band between 3300–3600 cm−1 is synonymous with stretching vibrations of O–H and a distinctive band at ∼1632 cm−1 was ascribed to bending vibrations of hydroxyl ions (–OH).91,93,94,98 This vibration band is related to the protons of physisorbed water in prepared samples.99,100 According to reported literature, titanium oxide conserves adsorbed un-dissociated water molecules due to strong Lewis acidity of coordinatively unsaturated Ti4+ surface sites.99
UV-vis spectroscopy was employed in the study of optical characteristics of prepared samples as seen in spectra displayed in Fig. 6a (200–700 nm). The aim was to examine optimum absorption of ultraviolet-visible light as well as to measure band gap according to band shifting. Optical electronic excitations to a conductive band from the absorptive band are generally characterized by enrichment of absorptive band with a certain wavelength in acquired absorption spectrum.99 Pristine TiO2 shows a continuous upsurge in optical absorption at a lower wavelength with maximum broad absorption range appearing in UV zone at 300 nm.91,93,101–103 Doped samples revealed a slight shift in optical absorption edge towards longer wavelength (visible region) with increasing Zr content as well as a difference in average crystallite size that leads to variations in band gap values of doped samples as depicted in Fig. 6b.58,87,91,94 Band gap energies were estimated by using the Tauc equation as labeled in eqn (12).
| αhν = K(hν − Eg)n | (12) |
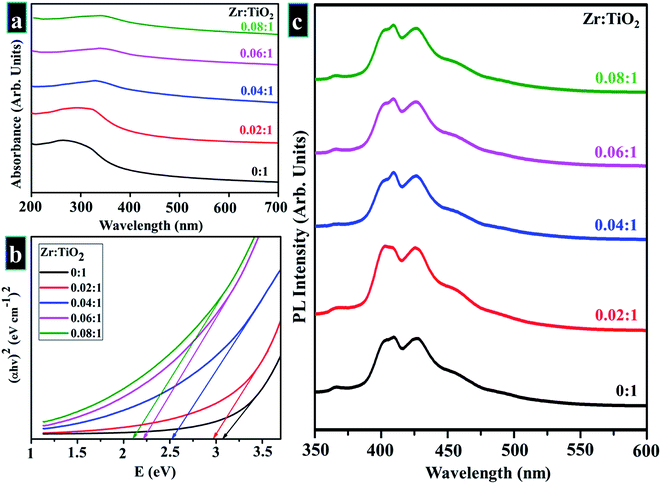 | ||
| Fig. 6 (a) Absorbance spectra obtained from pure and Zr-doped TiO2 nanoparticles (b) band gap determination (c) PL spectra of prepared samples. | ||
PL spectroscopy was employed to perceive excitons (electron–hole pairs) recombination rate under action of light, while acquired spectra are displayed in Fig. 6c. The excitation wavelength of all samples is λmax = 380 nm, and emission peak was observed at ∼415 nm, which reveals direct transition (band–band) and phonon-assisted indirect transition (via. band-gap state) of anatase TiO2.107 Rate of recombination by photo-generated charge is reduced due to surface defects. Metal ions and oxygen opening separately trap excited electron and hole. The excited electron moves from valance band to new state present due to doping, therefore it serves to decrease PL intensity.108 For all samples, PL spectra were unaffected by doping.
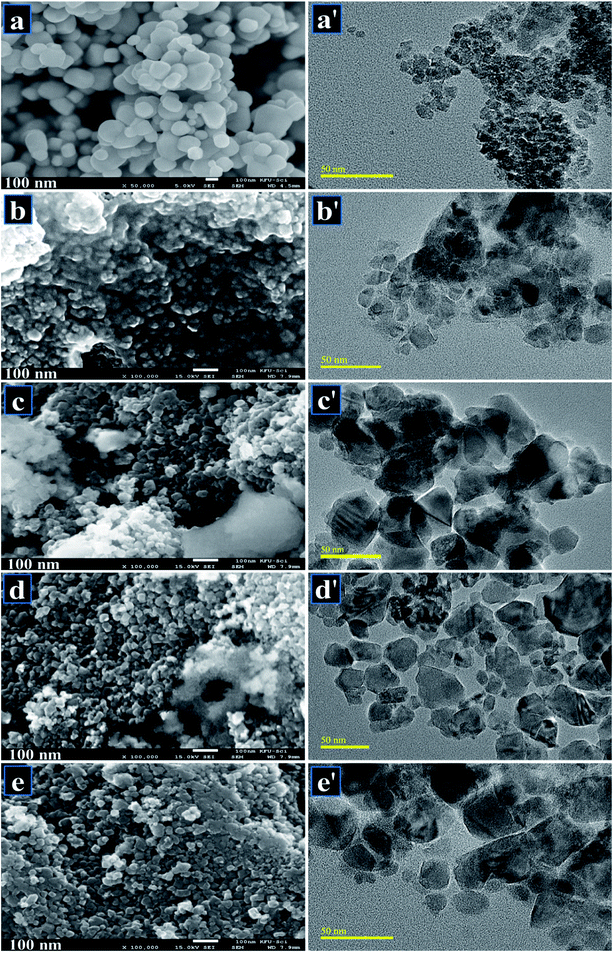
FESEM was employed to investigate surface morphology of pure and doped samples. Micrograph of host TiO2 as shown in Fig. 7a indicates agglomeration of TiO2 with spherical morphology. Fig. 7b–e also indicate spherical shape with an average particle size of ∼20 nm. Agglomeration arises due to the instability of TiO2 nanoparticles, which leads them to join together until they stabilize. The growth of nanoparticles was homogeneous and aggregation of nanoparticles was observed on the surface. It is noteworthy that large-sized finite aggregates were observed, which suggests that aggregation had occurred throughout the washing stage while the calcined temperature used during synthesis was relatively high. HR-TEM images revealed further information about the morphology of particles as depicted in Fig. 7a′–e′. Pure sample shows highly agglomerated nanoparticles with spherical morphology (Fig. 7a′). Upon doping with Zr, particles get scattered to some extent with random distribution observed in Fig. 7b′ and c′. With increasing concentration of dopant, agglomeration was observed to decrease along with slight transparency of nanoparticles (Fig. 7d′). Sample doped with the highest Zr concentration (Fig. 7e′) showed random disruption of stony particles and chunk areas with highly agglomeration trend.
HR-TEM microscopy at a higher resolution (up to 10 nm) was employed to seek detailed information about morphology and interlayer spacing. HR-TEM micrographs presented in Fig. 8a–d on a single grain show distinct atomic planes well-ordered in O–Ti–O arrangement to form a single layer and periodic atomic arrangement at particular areas, where interplanar spacing was measured to be ∼0.350 nm for pure TiO2 (Fig. 8a). According to the periodic arrangement in lattice fringe image, this matches up with (101) facet of anatase TiO2 phase and corresponds well with XRD results.85,86 In Fig. 8b–d with the addition of dopant, d-spacing of Zr–TiO2 nanoparticles was slightly enlarged and found to be ∼0.354–0.355 nm which is consistent with the peak shifts observed in XRD spectra (see Fig. 5a′).86
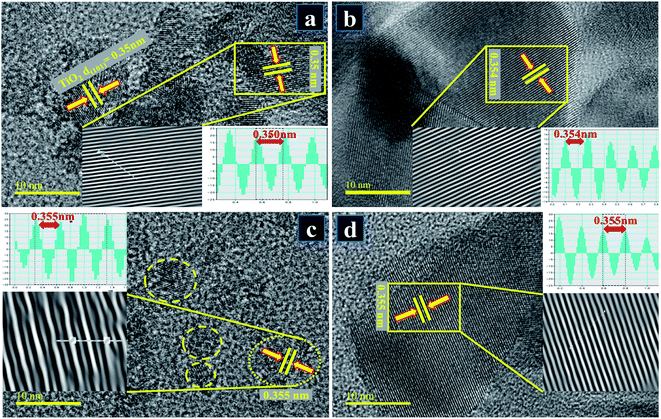 | ||
Fig. 8 HR-TEM images up to 10 nm resolution used for measuring interlayer spacing of samples for (a) pure TiO2 (b) 0.02![[thin space (1/6-em)]](https://www.rsc.org/images/entities/char_2009.gif) : :![[thin space (1/6-em)]](https://www.rsc.org/images/entities/char_2009.gif) 1 (c) 0.04 1 (c) 0.04![[thin space (1/6-em)]](https://www.rsc.org/images/entities/char_2009.gif) : :![[thin space (1/6-em)]](https://www.rsc.org/images/entities/char_2009.gif) 1 (d) 0.06 1 (d) 0.06![[thin space (1/6-em)]](https://www.rsc.org/images/entities/char_2009.gif) : :![[thin space (1/6-em)]](https://www.rsc.org/images/entities/char_2009.gif) 1. 1. | ||
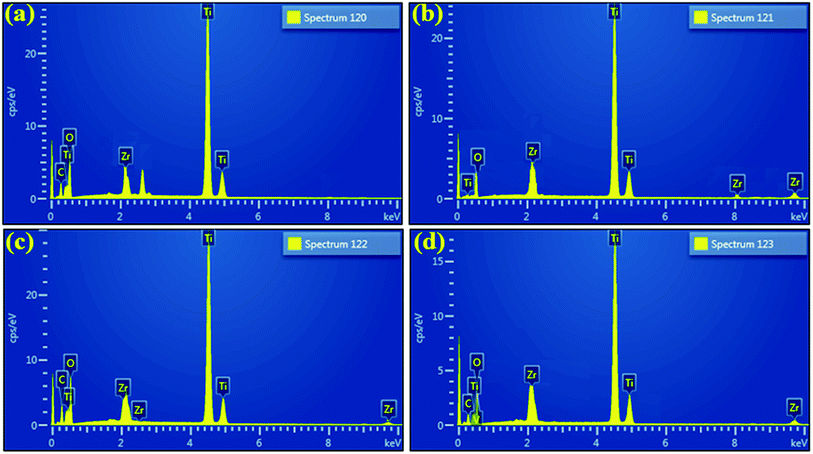
EDS was employed to evaluate the elemental composition with an aim to verify the purity of samples. According to EDS profiles illustrated in Fig. 9b–d, strong peaks of Ti element at 4.50 (Ti Kα) and 4.96 keV (Ti Kβ), oxygen peak at 0.52 keV (O Kα), and Zr peak at 2.04 keV (Zr Lα) along with various other positions were detected, which confirms the formation of pure anatase TiO2 as well as suggests the successful incorporation of dopant species. Moreover, carbon peak appearing below 1 keV is caused by carbon tabs that are utilized to hold sample during SEM analysis or/and due to background counts in SEM-EDS detector.
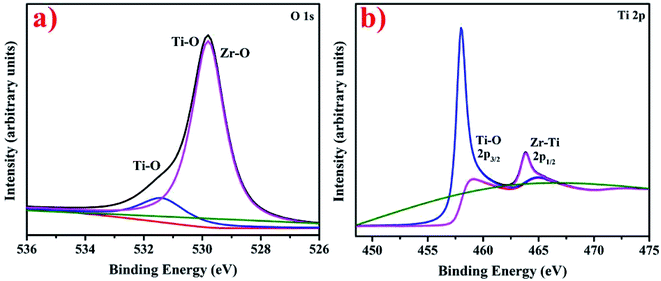
XPS analysis elucidating the chemical composition of synthesized nanostructures and presenting O 1s and Ti 2p spectra of synthesized Zr–TiO2 nanostructures is shown in Fig. 10a and b. According to the literature, pure TiO depicts two peaks in O 1s spectra at 530.0 eV and 531.8 eV corresponding to Ti–O and O–H links in TiO2, respectively.109 The peak positioned at 531.8 eV in O 1s spectra corresponds to Ti–O and similarly, peak positioned at 529.8 eV ascribes to Ti–O and Zr–O in Fig. 10a.110 The Ti 2p high-resolution XPS spectra consist of two peaks at 458.5 and 464.8 eV, which correspond to Ti–O and Zr–Ti, respectively in Fig. 10b.110 These are present in addition of pure TiO2 peaks at 458.6 eV (2p3/2) and 464.4 eV (2p1/2) indicating existence of Ti in +4 oxidation state.111 The presented 2p3/2 and 2p1/2 peaks in Ti 2p spectra in Fig. 10b depicts redshift related to pure TiO2 peaks as per literature111 thus, the resulting decrease in binding energy confirms successful Zr doping in TiO2.111
Fig. 11a and b labels parameters shown by the light-induced activity of Zr-doped TiO2 nanoparticles. According to these outcomes, absorbance is presented as time-dependent function. Fig. 11a reveals photocatalytic response of nanoparticles and clearly shows that MB degradation gradually increases with increasing concentration of the dopant. Substantial degradation is shown by the sample doped with the highest concentration of Zr (0.08![[thin space (1/6-em)]](https://www.rsc.org/images/entities/char_2009.gif) :
:![[thin space (1/6-em)]](https://www.rsc.org/images/entities/char_2009.gif) 1), which was up to 99% in 120 minutes. Lesser extent of degradation was shown by samples in dark whereas in the presence of light, samples showed considerable removal of MB within 120 minutes. Only 40% degradation occurred in case of pure TiO2, however with Zr doping, photocatalysts showed remarkable degradation since Zr reduces band gap and inhibits recombination rate. The understanding of photo-degradation kinetics by rate constants (k) that was calculated by measuring slopes on ln(Ct/Co) curves are drawn against time, as revealed in Fig. 11b. Rate constants of all samples were calculated by using pseudo-first-order kinetic theory (eqn (13)):
1), which was up to 99% in 120 minutes. Lesser extent of degradation was shown by samples in dark whereas in the presence of light, samples showed considerable removal of MB within 120 minutes. Only 40% degradation occurred in case of pure TiO2, however with Zr doping, photocatalysts showed remarkable degradation since Zr reduces band gap and inhibits recombination rate. The understanding of photo-degradation kinetics by rate constants (k) that was calculated by measuring slopes on ln(Ct/Co) curves are drawn against time, as revealed in Fig. 11b. Rate constants of all samples were calculated by using pseudo-first-order kinetic theory (eqn (13)):
| −ln(Ct/Co) = kt | (13) |
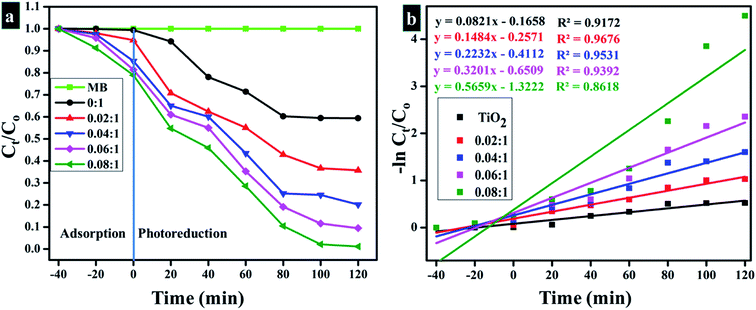 | ||
| Fig. 11 (a) Plot of concentration ratio (Ct/C0) versus time (b) Plot of −ln(Ct/Co) versus time spectra for dye reduction. | ||
Rate constant (k) increase with an increase in doping ratio (Table 2).27,112–114 As discussed above, the enhanced photocatalytic activity of nanoparticles may be ascribed mainly to these measures: firstly, the preservation of structure in nanoparticles as well as a high specific surface area that promotes broad absorption of UV irradiation within the catalyst and provides more surface active sites for reactants, thus helping to enhance the activities of photo-degradation. Secondly, the incorporation of Zr in TiO2 lattice inhibits the growth of anatase crystal during annealing, thus the resulting smaller anatase crystals provide photo-induced electron–hole pairs with shorter migration periods therefore assisting in wider availability of reaction sites, which ultimately results in the improvement of photocatalytic performance. Thirdly, Zr4+ insertion could clearly prevent the loss of surface hydroxyl related groups on nanoparticles, thereby effectively trapping photo-induced holes in preserved surface hydroxyl groups and thus creating active hydroxyl radicals with high oxidant efficiency. More decisively, the electron–hole recombination may be prevented efficiently by the establishment of hydroxyl groups and appropriate oxygen sites, subsequently, contributing to the enhancement of photocatalytic activity of nanoparticles.79
| Literature | Present study | |||||||||
|---|---|---|---|---|---|---|---|---|---|---|
| Synthesis | Phase | Max. degradation | Sample | Synthesis | Phase | Max. degradation and rate constants (min−1) | ||||
| Zr–TiO2 NPs | 8Sol–gel | Anatase | 50% | 90 min | 0![[thin space (1/6-em)]](https://www.rsc.org/images/entities/char_2009.gif) : :![[thin space (1/6-em)]](https://www.rsc.org/images/entities/char_2009.gif) 1 1 |
Sol–gel | Anatase | 40% | 0.0042 | 120 min |
| 13Mechanical ball milling | Anatase | 90% | 120 min | |||||||
| 15Sol–gel | Anatase | 82% | 180 min | 0.02![[thin space (1/6-em)]](https://www.rsc.org/images/entities/char_2009.gif) : :![[thin space (1/6-em)]](https://www.rsc.org/images/entities/char_2009.gif) 1 1 |
65% | 0.0085 | ||||
| 51Sol–gel | Anatase | 98% | 120 min | 0.04![[thin space (1/6-em)]](https://www.rsc.org/images/entities/char_2009.gif) : :![[thin space (1/6-em)]](https://www.rsc.org/images/entities/char_2009.gif) 1 1 |
80% | 0.0131 | ||||
| 86Sol–gel | Anatase | 75% | 150 min | |||||||
| 87Sol–gel | Anatase | 80% | 60 min | |||||||
| 91Acid modified sol–gel | Anatase | 62% | 80 min | 0.06![[thin space (1/6-em)]](https://www.rsc.org/images/entities/char_2009.gif) : :![[thin space (1/6-em)]](https://www.rsc.org/images/entities/char_2009.gif) 1 1 |
96% | 0.0191 | ||||
| 64Sol–gel | Anatase | 99% | 120 min | 0.08![[thin space (1/6-em)]](https://www.rsc.org/images/entities/char_2009.gif) : :![[thin space (1/6-em)]](https://www.rsc.org/images/entities/char_2009.gif) 1 1 |
99% | 0.0373 | ||||
| 115Sol–gel | Anatase | 85% | 350 min | |||||||
3.1 PH value
Outcome of a photocatalytic experiment greatly depends on pH value as the rate of reaction has been found to possess a direct correlation with pH value. Cited literature reveals that dye degradation due to photocatalytic activity yields superior results under alkaline or basic conditions. In the current study, pH value was measured which corresponds to basic alkaline condition of the performed experiment. The outcomes of this work demonstrating efficient dye degradation under alkaline conditions favorably support experimental results and reported literature25,32,603.2 Reusability
Reusability of catalysts is considered a significant factor as photocatalyst should be reusable in order to utilize it up to the maximum number of cycles for treatment of industrial wastewater. Reusability was determined for the sample as of stability up to three cycles. The obtained results are presented in Fig. 12a and b which indicates that Zr-doped TiO2 catalyst can be utilized as an effective reusable photocatalyst.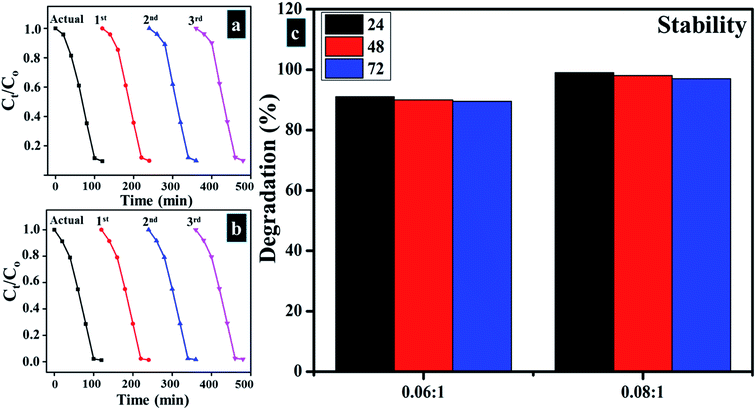 | ||
Fig. 12 (a and b) Plots of Ct/Co vs. time for reusability of 0.06![[thin space (1/6-em)]](https://www.rsc.org/images/entities/char_2009.gif) : :![[thin space (1/6-em)]](https://www.rsc.org/images/entities/char_2009.gif) 1, and 0.08 1, and 0.08![[thin space (1/6-em)]](https://www.rsc.org/images/entities/char_2009.gif) : :![[thin space (1/6-em)]](https://www.rsc.org/images/entities/char_2009.gif) 1, samples respectively (c) stability of Zr-doped samples (0.06 1, samples respectively (c) stability of Zr-doped samples (0.06![[thin space (1/6-em)]](https://www.rsc.org/images/entities/char_2009.gif) : :![[thin space (1/6-em)]](https://www.rsc.org/images/entities/char_2009.gif) 1, and 0.08 1, and 0.08![[thin space (1/6-em)]](https://www.rsc.org/images/entities/char_2009.gif) : :![[thin space (1/6-em)]](https://www.rsc.org/images/entities/char_2009.gif) 1). 1). | ||
3.3 Stability
Stability of experimental results was determined by allowing the accomplished activities to be retained for three days. Every 24 hours, absorption spectra were obtained from the samples to note any variation in dye degradation potential. Stability of catalysts is illustrated in Fig. 12c by means of percentage degradation which specifies obtained product as highly stable photocatalyst for dye degradation as no reduction in results was detected after 96 hours of stopover. As catalysts doped with higher Zr concentrations exhibited superior results, therefore, it was considered sufficient to determine the stability of (0.06![[thin space (1/6-em)]](https://www.rsc.org/images/entities/char_2009.gif) :
:![[thin space (1/6-em)]](https://www.rsc.org/images/entities/char_2009.gif) 1, and 0.08
1, and 0.08![[thin space (1/6-em)]](https://www.rsc.org/images/entities/char_2009.gif) :
:![[thin space (1/6-em)]](https://www.rsc.org/images/entities/char_2009.gif) 1) samples only.
1) samples only.
3.4 Load of catalyst
Lastly, the load of catalyst before performing catalytic and photocatalytic activity and after four cycles of reusability was assessed. The load of catalyst before performing photocatalytic activity was 10 mg, after four times of recycling it was detected as 9.6 mg by allowing 5% sensing/detecting deviation.The in vitro antimicrobial potential of Zr-doped TiO2 against G −ve and G +ve isolated from caprine mastitic milk with graphical presentations are shown in Fig. 13, and 14 and summarized in Table 3. The results depict enhanced bactericidal action and synergism of Zr-doped TiO2 against S. aureus compared with E. coli Fig. 13a–f. Statistically significant (P < 0.05) inhibition zones were recorded as (0.65–3.1 mm) and (2.25–4.95 mm) against S. aureus (Fig. 14a–f) while, (0–1 mm) and (0–2.9 mm) against E. coli at low and high doses, respectively. TiO2 control showed null efficacy against E. coli at a low and high dose. The % age efficacy increased from (28.6–43.3%) to (37.0–69.2%) against S. aureus and similarly, from (0–23.5%) to (44.7–68.2%) against E. coli. Ciprofloxacin as positive control inhibited (7.15 mm) and (4.25 mm) S. aureus and E. coli growth, respectively compared with DIW (0 mm). Overall, Zr-doped TiO2 material resulted in significant (P < 0.05) bactericidal efficacy against G +ve compared with G –ve.
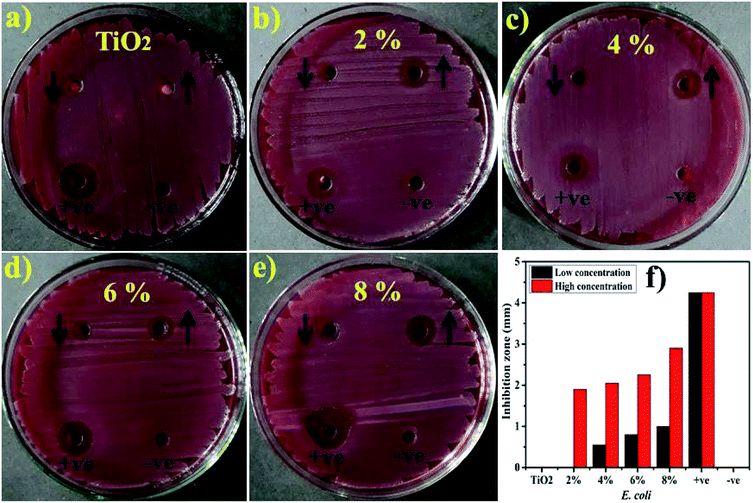 | ||
| Fig. 13 (a) In vitro antimicrobial efficacy of TiO2 (control), (b) 2% Zr-doped (c) 4%-doped, (d) 6%-doped, (e) 8%-doped against E. coli (f) graphical presentation. | ||
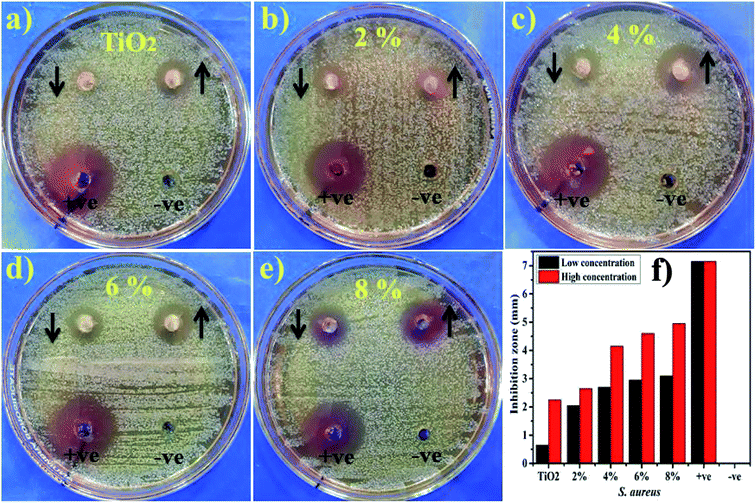 | ||
| Fig. 14 (a) In vitro antimicrobial efficacy of TiO2 (control), (b) Zr-doped TiO2 (2%), (c) (4%), (d) (6%), (e) (8%) against S. aureus (f) graphical presentation. | ||
| Sample | Inhibition zonea (mm) | Inhibition zoneb (mm) | ||
|---|---|---|---|---|
| 0.5 mg/50 μl | 1.0 mg/50 μl | 0.5 mg/50 μl | 1.0 mg/50 μl | |
| a Inhibition zone (mm) of Zr-doped TiO2 for E. coli.b Inhibition zone measurements of Zr-doped TiO2 for S. aureus. | ||||
| TiO2 | 0 | 0 | 0.65 | 2.25 |
| Zr–TiO2 2% | 0 | 1.9 | 2.05 | 2.65 |
| Zr–TiO2 4% | 0.55 | 2.05 | 2.7 | 4.15 |
| Zr–TiO2 6% | 0.8 | 2.25 | 2.95 | 4.6 |
| Zr–TiO2 8% | 1 | 2.9 | 3.1 | 4.95 |
| Ciprofloxacin | 4.25 | 4.25 | 7.15 | 7.15 |
| DIW | 0 | 0 | 0 | 0 |
The oxidative stress produced by nanoparticles directly depends on concentration, shape and size of nanoparticles. Antimicrobial activity in terms of inhibition zones (mm) increased due to higher wt% doping of Zr with maximum cations availability. Antimicrobial effectiveness depends primarily on concentration and size, which exhibits inverse relation to the size of doped material.60,67,68 Small-sized NPs generate more reactive oxygen species (ROS) which stay effective in implants of bacterial membrane resulting in cytoplasmic-contents extrusion and killing bacteria.116 Secondly, the strong cationic interaction of Zr+4 with bacterial membrane negative parts results in enhanced bactericidal activity at increasing concentrations by inducing cell lysis and collapse of bacteria.24,117
Molecular docking study was undertaken to understand the possible molecular interactions responsible for antibacterial activity of Zr-doped TiO2 nanoparticles against E. coli and S. aureus. Folate biosynthetic pathway leads to synthesis of tetrahydrofolate that plays an essential role in the biosynthesis of various bioactive constituents namely thymidylate enzyme, pantothenic acid, nitrogenous bases such as purine, ribonucleic acid and amino acids. Enzymes belonging to this pathway e.g., dihydrofolate reductase and dihydropteroate synthase have been reported as attractive targets for antibiotic discovery. Trimethoprim is a well-known antibiotic target DHFR while DHPS is inhibited by sulfonamide class of antibiotics.70,118 Keeping in view the importance and essentiality of folate biosynthetic pathway for growth and survival of bacteria, binding interaction pattern of these nanoparticles were evaluated against DHFR, DHPS and DNA gyrase enzyme from both E. coli and S. aureus.
In case of DHFR from E. coli, the Zr-doped TiO2 nanoparticle showed H-bonding interaction with Ala7 and Ile14 while Ile94 interacted through metal contact with a binding score of −9.87 kcal mol−1 as shown in Fig. 15a. Similarly, for DHPS from E. coli, the best binding score observed was −9.14 kcal mol−1 possessing H-bonding interaction with Lys221 and Asp115 along with metal contact interaction with Asp185. In addition, the binding score −4.31 kcal mol−1 in case of DNA gyrase is attributed to H-bonding interaction with Arg76 of active site along with metal contact interaction with Glu50 as depicted in Fig. 15b and c.
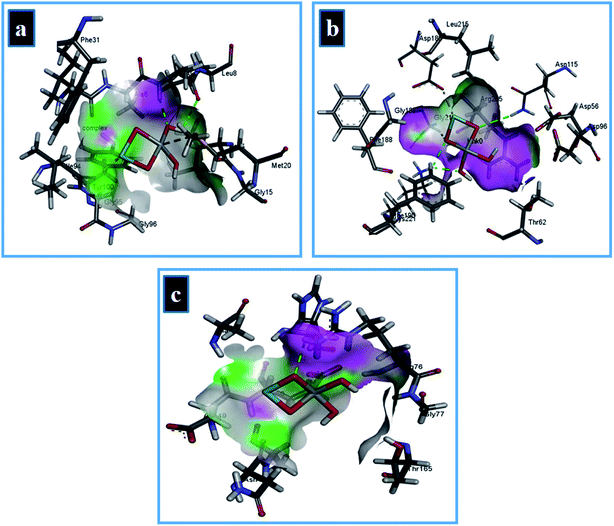 | ||
| Fig. 15 Binding interaction pattern of Zr-doped TiO2 nanoparticles with active site residues of (a) dihydrofolate reductase, (b) dihydropteroate synthase, and (c) DNA gyrase from E. coli. | ||
The best-docked conformation of Zr-doped TiO2 nanoparticles against DHFR enzyme from S. aureus has −11.32 kcal mol−1 binding score and involve H-bonding interaction with Ala7 and Leu5 while Asp27 of active site formed metal contact interaction as shown in Fig. 16a. In case of DHPS from S. aureus, NPs revealed metal contact interaction with Glu142 and Asn134 along with H-bonding interaction with Asn130 of active pocket with overall binding score of −7.61 kcal mol−1 (Fig. 16b).
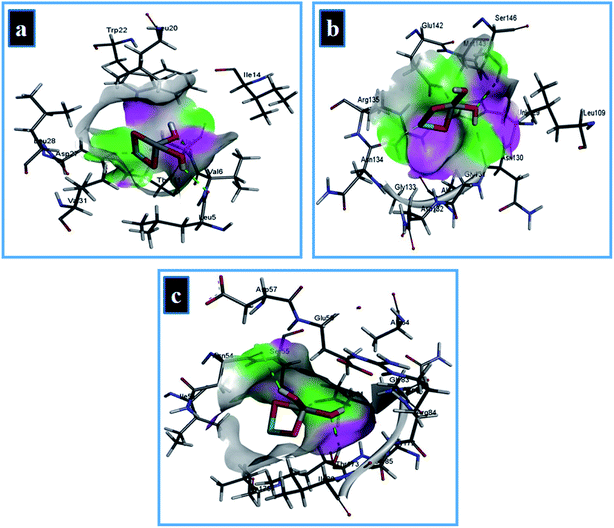 | ||
| Fig. 16 Binding interaction pattern of Zr-doped TiO2 nanoparticles with active site residues of (a) dihydrofolate reductase, (b) dihydropteroate synthase, (c) DNA gyrase from S. aureus. | ||
The Zr-doped TiO2 nanoparticles interacted with Thr173, Asp81 through H-bonding interaction and metal contact with Ser55 of binding pocket of DNA gyrase from S. aureus (binding score −8.33 kcal mol−1) as depicted in Fig. 16c. In silico findings suggested Zr-doped TiO2 nanoparticles as a possible inhibitor of enzymes from folate biosynthetic pathway and DNA gyrase and their enzyme inhibition studies are recommended for further analysis.
4. Conclusion
Zr-doped TiO2 was successfully synthesized via sol–gel chemical method and prepared samples were analyzed through various characterization techniques. XRD profiles showed the formation of anatase phase with a slight shift in (101) facet towards lower angle suggesting the presence of a dopant that is well dispersed in TiO2 crystal. Crystallite size was reduced (from 22.22 to 15.03 nm) upon incorporation of Zr. All functional groups observed were related to the samples and characteristic absorption band between 400–900 cm−1 was ascribed to the vibration modes of Ti–O–Ti linkage in TiO2 nanoparticles that indicate the formation of pure TiO2 as illustrated with FTIR. The spectrum obtained using UV-vis unveiled an absorption tail that trailed towards visible region (redshift) with increasing concentrations of dopant that caused the band gap to narrow (from 3.23 to 2.10 eV). Spherical morphology of nanoparticles exhibiting a high degree of agglomeration was visualized through SEM and HR-TEM with a d-spacing of ∼0.350 nm measured for pure sample and ∼0.353 nm for sample doped with the highest concentration. EDS data showed elemental composition that revealed successful doping of Zr. In addition, Zr-doped TiO2 depicted enhanced bactericidal action and synergism against S. aureus compared with E. coli isolated from caprine mastitis thus, opening new gateway for use of doped nanomaterials as potential bactericidal agents. The findings of molecular docking study suggested Zr-doped TiO2 as potential inhibitor against dihydrofolate reductase, dihydropteroate synthase and DNA gyrase enzyme as possible targets. In silico findings are in good agreement with observed bactericidal activity against E. coli and S. aureus. Photocatalytic activity corresponding to Zr–TiO2 (0.08![[thin space (1/6-em)]](https://www.rsc.org/images/entities/char_2009.gif) :
:![[thin space (1/6-em)]](https://www.rsc.org/images/entities/char_2009.gif) 1) degraded 99% of MB concentration. These results obtained from prepared nanocatalysts show no hazardous behavior in wastewater treatment and point toward an excellent nanocatalyst that is stable, reusable and more importantly can be employed for elimination of organic pollutants from wastewater.
1) degraded 99% of MB concentration. These results obtained from prepared nanocatalysts show no hazardous behavior in wastewater treatment and point toward an excellent nanocatalyst that is stable, reusable and more importantly can be employed for elimination of organic pollutants from wastewater.
Conflicts of interest
There are no conflicts to declare.Acknowledgements
Authors are thankful to Higher Education Commission Pakistan for financial support through SRGP-21-1669 and especially thankful to the Center for Engineering Research, Research Institute, King Fahd University of Petroleum & Minerals, Dhahran, Saudi Arabia for HR-TEM analysis. Authors are also grateful to MOU signed authorities between GC University and Riphah International University Lahore Campus.References
- A. Wypych, I. Bobowska, M. Tracz, A. Opasinska, S. Kadlubowski, A. Krzywania-Kaliszewska, J. Grobelny and P. Wojciechowski, J. Nanomater., 2014, 2014, 124814 CrossRef.
- R. Abazari, A. R. Mahjoub and S. Sanati, RSC Adv., 2014, 4, 56406–56414 RSC.
- Y. Cui, L. Zhang, K. Lv, G. Zhou and Z.-S. Wang, J. Mater. Chem. A, 2015, 3, 4477–4483 RSC.
- V. R. Desai, S. M. Hunagund, M. S. Pujar, M. Basanagouda, J. S. Kadadevarmath and A. H. Sidarai, J. Mol. Liq., 2017, 233, 166–172 CrossRef CAS.
- N. Lagopati, E. P. Tsilibary, P. Falaras, P. Papazafiri, E. A. Pavlatou, E. Kotsopoulou and P. Kitsiou, Int. J. Nanomed., 2014, 9, 3219–3230 CAS.
- R. Kumar, R. El-Shishtawy and M. Barakat, Catalysts, 2016, 6, 76 CrossRef.
- M. Ikram, E. Umar, A. Raza, A. Haider, S. Naz, A. Ul-Hamid, J. Haider, I. Shahzadi, J. Hassan and S. Ali, RSC Adv., 2020, 10, 24215–24233 RSC.
- D. Kapusuz, J. Park and A. Ozturk, J. Phys. Chem. Solids, 2013, 74, 1026–1031 CrossRef CAS.
- Z. G. Shang, Z. Q. Liu, P. J. Shang and J. K. Shang, J. Mater. Sci. Technol., 2012, 28, 385–390 CrossRef CAS.
- S. S. R. Putluru, L. Schill, A. D. Jensen, B. Siret, F. Tabaries and R. Fehrmann, Appl. Catal., B, 2015, 165, 628–635 CrossRef CAS.
- H. Sun, C. Wang, S. Pang, X. Li, Y. Tao, H. Tang and M. Liu, J. Non-Cryst. Solids, 2008, 354, 1440–1443 CrossRef CAS.
- A. R. Dalod, L. Henriksen, T. Grande and M. A. Einarsrud, Beilstein J. Nanotechnol., 2017, 8, 304–312 CrossRef CAS PubMed.
- T. Tokmakci, A. Ozturk and J. Park, Ceram. Int., 2013, 39, 5893–5899 CrossRef CAS.
- N. B. Shali and S. Sugunan, J. Sol-Gel Sci. Technol., 2007, 42, 101–105 CrossRef CAS.
- N. N. Binitha, Z. Yaakob and R. Resmi, Cent. Eur. J. Chem., 2010, 8, 182–187 CAS.
- J. Moma and J. Baloyi, in Photocatalysts-Applications and Attributes, IntechOpen, 2018 Search PubMed.
- K. Nakata and A. Fujishima, J. Photochem. Photobiol., C, 2012, 13, 169–189 CrossRef CAS.
- A. Fujishima, X. Zhang and D. A. Tryk, Surf. Sci. Rep., 2008, 63, 515–582 CrossRef CAS.
- J. Schneider, M. Matsuoka, M. Takeuchi, J. Zhang, Y. Horiuchi, M. Anpo and D. W. Bahnemann, Chem. Rev., 2014, 114, 9919–9986 CrossRef CAS PubMed.
- L. Yang, L. E. Yu and M. B. Ray, Water Res., 2008, 42, 3480–3488 CrossRef CAS PubMed.
- M. M. Matlock, B. S. Howerton and D. A. Atwood, Water Res., 2002, 36, 4757–4764 CrossRef CAS PubMed.
- Q. Wen, J. Di, Y. Zhao, Y. Wang, L. Jiang and J. Yu, Chem. Sci., 2013, 4, 4378–4382 RSC.
- A. Raza, M. Ikram, M. Aqeel, M. Imran, A. Ul-Hamid, K. N. Riaz and S. Ali, Appl. Nanosci., 2019, 10, 1535–1544 CrossRef.
- M. Ikram, M. I. Khan, A. Raza, M. Imran, A. Ul-Hamid and S. Ali, Phys. E, 2020, 124, 114246 CrossRef CAS.
- M. Ikram, J. Hassan, M. Imran, J. Haider, A. Ul-Hamid, I. Shahzadi, M. Ikram, A. Raza, U. Qumar and S. Ali, Appl. Nanosci., 2020 DOI:10.1007/s13204-020-01439-2.
- M. Hosseini, N. Fazelian, A. Fakhri, H. Kamyab, K. K. Yadav and S. Chelliapan, J. Photochem. Photobiol., B, 2019, 194, 128–134 CrossRef CAS PubMed.
- M. Ikram, A. Raza, M. Imran, A. Ul-Hamid, A. Shahbaz and S. Ali, Nanoscale Res. Lett., 2020, 15, 95 CrossRef PubMed.
- M. Ikram, R. Tabassum, U. Qumar, S. Ali, A. Ul-Hamid, A. Haider, A. Raza, M. Imran and S. Ali, RSC Adv., 2020, 10, 20559–20571 RSC.
- X. Li, Z. Zhang, A. Fakhri, V. K. Gupta and S. Agarwal, Int. J. Biol. Macromol., 2019, 136, 469–475 CrossRef CAS PubMed.
- A. Raza, U. Qumar, J. Hassan, M. Ikram, A. Ul-Hamid, J. Haider, M. Imran and S. Ali, Appl. Nanosci., 2020 DOI:10.1007/s13204-020-01475-y.
- V. S. Mohite, M. S. Mahadik, S. S Kumbhar, Y. M. Hunge, J. H. Kim, A. V. Moholkar, K. Y. Rajpure and C. H. Bhosale, J. Photochem. Photobiol., B, 2015, 142, 204–211 CrossRef CAS PubMed.
- J. Hassan, M. Ikram, A. Ul-Hamid, M. Imran, M. Aqeel and S. Ali, Nanoscale Res. Lett., 2020, 15, 75 CrossRef CAS PubMed.
- Q. Guo, C. Zhou, Z. Ma and X. Yang, Adv. Mater., 2019, 31, 1901997 CrossRef CAS PubMed.
- N. Laoufi, D. Tassalit and F. Bentahar, Global NEST J., 2008, 10, 404–418 Search PubMed.
- N. Bsiri, M. A. Zrir, A. Bardaoui and M. Bouaїcha, Ceram. Int., 2016, 42, 10599–10607 CrossRef CAS.
- A. Juma, I. Oja Acik, A. T. Oluwabi, A. Mere, V. Mikli, M. Danilson and M. Krunks, Appl. Surf. Sci., 2016, 387, 539–545 CrossRef CAS.
- D.-E. Gu, B.-C. Yang and Y.-D. Hu, Catal. Commun., 2008, 9, 1472–1476 CrossRef CAS.
- Y. Ohko, I. Ando, C. Niwa, T. Tatsuma, T. Yamamura, T. Nakashima, Y. Kubota and A. Fujishima, Environ. Sci. Technol., 2001, 35, 2365–2368 CrossRef CAS PubMed.
- A. Fakhri, V. K. Gupta, H. Rabizadeh, S. Agarwal, N. Sadeghi and S. Tahami, Int. J. Biol. Macromol., 2018, 120, 1789–1793 CrossRef CAS PubMed.
- Q. Huang, W. Ma, X. Yan, Y. Chen, S. Zhu and S. Shen, J. Mol. Catal. A: Chem., 2013, 366, 261–265 CrossRef CAS.
- B. Duan, Y. Zhou, C. Huang, Q. Huang, Y. Chen, H. Xu and S. Shen, Ind. Eng. Chem. Res., 2018, 57, 14044–14051 CrossRef CAS.
- T. W. Shattuck, Colby College Molecular Mechanics Exercises MOE (Molecular Operating Environment), Exercises, 2011, http://www.colby.edu/chemistry/CompChem/MOEtutor09.pdf Search PubMed.
- D. Das, H. K. Mishra, K. M. Parida and A. K. Dalai, J. Mol. Catal. A: Chem., 2002, 189, 271–282 CrossRef CAS.
- J. Lukáč, M. Klementová, P. Bezdička, S. Bakardjieva, J. Šubrt, L. Szatmáry, Z. Bastl and J. Jirkovský, Appl. Catal., B, 2007, 74, 83–91 CrossRef.
- Ş. Ţălu, S. Stach, M. Ikram, D. Pathak, T. Wagner and J.-M. Nunzi, Int. J. Nanosci., 2014, 13, 1450020 CrossRef.
- B. Moongraksathum, J.-Y. Shang and Y.-W. Chen, Catalysts, 2018, 8, 352 CrossRef.
- N. Perkas, A. Lipovsky, G. Amirian, Y. Nitzan and A. Gedanken, J. Mater. Chem. B, 2013, 1, 5309–5316 RSC.
- A. M. Alotaibi, B. A. D. Williamson, S. Sathasivam, A. Kafizas, M. Alqahtani, C. Sotelo-Vazquez, J. Buckeridge, J. Wu, S. P. Nair, D. O. Scanlon and I. P. Parkin, ACS Appl. Mater. Interfaces, 2020, 12, 15348–15361 CrossRef CAS PubMed.
- S. S. Surah, S. Sirohi, R. Nain and G. Kumar, AIP Conf. Proc., 2018, 1932, 030038 CrossRef.
- M. A. Ashraf, Y. Yang and A. Fakhri, Ceram. Int., 2020, 46, 8379–8384 CrossRef CAS.
- M. C. Sekhar, B. Purusottam Reddy, K. Mallikarjuna, G. Shanmugam, C.-H. Ahn and S.-H. Park, Mater. Res. Express, 2018, 5, 015024 CrossRef.
- A. Kubacka, M. S. Diez, D. Rojo, R. Bargiela, S. Ciordia, I. Zapico, J. P. Albar, C. Barbas, V. A. Martins dos Santos, M. Fernandez-Garcia and M. Ferrer, Sci. Rep., 2014, 4, 4134 CrossRef PubMed.
- A. Manafi Khajeh Pasha, M. Hosseini, A. Fakhri, V. K. Gupta and S. Agarwal, J. Mol. Liq., 2019, 289, 110950 CrossRef CAS.
- R. D. Desiati, M. Taspika and E. Sugiarti, Mater. Res. Express, 2019, 6, 095059 CrossRef CAS.
- C. L. de Dicastillo, M. G. Correa, F. B. Martínez, C. Streitt and M. J. Galotto, in Titanium Dioxide, IntechOpen, 2020 Search PubMed.
- U. Joost, K. Juganson, M. Visnapuu, M. Mortimer, A. Kahru, E. Nõmmiste, U. Joost, V. Kisand and A. Ivask, J. Photochem. Photobiol., B, 2015, 142, 178–185 CrossRef CAS PubMed.
- M. Khan, M. R. Shaik, S. T. Khan, S. F. Adil, M. Kuniyil, M. Khan, A. A. Al-Warthan, M. R. H. Siddiqui and M. Nawaz Tahir, ACS Omega, 2020, 5, 1987–1996 CrossRef CAS PubMed.
- D. Campoccia, S. Ravaioli, R. Vivani, A. Donnadio, E. Vischini, A. Russo, L. Visai, C. R. Arciola, L. Montanaro and M. Nocchetti, Materials, 2019, 12, 3184 CrossRef CAS PubMed.
- X. Wang, D. Chen, L. Cao, Y. Li, B. J. Boyd and R. A. Caruso, ACS Appl. Mater. Interfaces, 2013, 5, 10926–10932 CrossRef CAS PubMed.
- U. Qumar, M. Ikram, M. Imran, A. Haider, A. Ul-Hamid, J. Haider, K. N. Riaz and S. Ali, Dalton Trans., 2020, 49, 5362–5377 RSC.
- M. Ikram, S. Ali, R. Murray, A. Hussain, d. Islah u and S. I. Shah, Curr. Appl. Phys., 2015, 15, 48–54 CrossRef.
- S. Altaf, H. Ajaz, M. Imran, A. Ul-Hamid, M. Naz, M. Aqeel, A. Shahzadi, A. Shahbaz and M. Ikram, Appl. Nanosci., 2020 DOI:10.1007/s13204-020-01350-w.
- A. Wahab, M. Imran, M. Ikram, M. Naz, M. Aqeel, A. Rafiq, H. Majeed and S. Ali, Appl. Nanosci., 2019, 9, 1823–1832 CrossRef CAS.
- B. Gao, T. M. Lim, D. P. Subagio and T.-T. Lim, Appl. Catal., A, 2010, 375, 107–115 CrossRef CAS.
- A. Ajmal, I. Majeed, R. N. Malik, H. Idriss and M. A. Nadeem, RSC Adv., 2014, 4, 37003–37026 RSC.
- A. Gnanaprakasam, V. M. Sivakumar and M. Thirumarimurugan, Indian Journal of Materials Science, 2015, 2015, 1–16 CrossRef.
- A. Haider, M. Ijaz, M. Imran, M. Naz, H. Majeed, J. A. Khan, M. M. Ali and M. Ikram, Appl. Nanosci., 2020, 10, 1095–1104 CrossRef CAS.
- A. Haider, M. Ijaz, S. Ali, J. Haider, M. Imran, H. Majeed, I. Shahzadi, M. M. Ali, J. A. Khan and M. Ikram, Nanoscale Res. Lett., 2020, 15, 50 CrossRef CAS PubMed.
- M. V. B. Dias, J. C. Santos, G. A. Libreros-Zúñiga, J. A. Ribeiro and S. M. Chavez-Pacheco, Future Med. Chem., 2018, 10, 935–959 CrossRef PubMed.
- S. Hawser, S. Lociuro and K. Islam, Biochem. Pharmacol., 2006, 71, 941–948 CrossRef CAS PubMed.
- A. Maxwell, Trends Microbiol., 1997, 5, 102–109 CrossRef CAS PubMed.
- L. L. Silver, Cold Spring Harbor Perspect. Med., 2016, 6, a030239 CrossRef PubMed.
- R. L. Summerfield, D. M. Daigle, S. Mayer, D. Mallik, D. W. Hughes, S. G. Jackson, M. Sulek, M. G. Organ, E. D. Brown and M. S. Junop, J. Med. Chem., 2006, 49, 6977–6986 CrossRef CAS PubMed.
- M. L. Dennis, M. D. Lee, J. R. Harjani, M. Ahmed, A. J. DeBono, N. P. Pitcher, Z.-C. Wang, S. Chhabra, N. Barlow, R. Rahmani, B. Cleary, O. Dolezal, M. Hattarki, L. Aurelio, J. Shonberg, B. Graham, T. S. Peat, J. B. Baell and J. D. Swarbrick, Chem.–Eur. J., 2018, 24, 1922–1930 CrossRef CAS PubMed.
- F. Ushiyama, H. Amada, T. Takeuchi, N. Tanaka-Yamamoto, H. Kanazawa, K. Nakano, M. Mima, A. Masuko, I. Takata, K. Hitaka, K. Iwamoto, H. Sugiyama and N. Ohtake, ACS Omega, 2020, 5, 10145–10159 CrossRef CAS PubMed.
- C. Oefner, S. Parisi, H. Schulz, S. Lociuro and G. E. Dale, Acta Crystallogr., Sect. D: Biol. Crystallogr., 2009, 65, 751–757 CrossRef CAS PubMed.
- M. F. Mesleh, J. B. Cross, J. Zhang, J. Kahmann, O. A. Andersen, J. Barker, R. K. Cheng, B. Felicetti, M. Wood, A. T. Hadfield, C. Scheich, T. I. Moy, Q. Yang, J. Shotwell, K. Nguyen, B. Lippa, R. Dolle and M. D Ryan, Bioorg. Med. Chem. Lett., 2016, 26, 1314–1318 CrossRef CAS PubMed.
- BIOvIA, D. S., Discovery studio modeling environment, Dassault Systemes, San Diego, Release, 4, 2015 Search PubMed.
- J. Song, X. Wang, J. Yan, J. Yu, G. Sun and B. Ding, Sci. Rep., 2017, 7, 1636 CrossRef PubMed.
- T. Aguilar, J. Navas, R. Alcántara, C. Fernández-Lorenzo, J. J. Gallardo, G. Blanco and J. Martín-Calleja, Chem. Phys. Lett., 2013, 571, 49–53 CrossRef CAS.
- X. Wei, G. Zhu, J. Fang and J. Chen, Int. J. Photoenergy, 2013, 2013, 1–6 Search PubMed.
- K. Thamaphat, P. Limsuwan and B. J. K. J. Ngotawornchai, Kasetsart Journal - Natural Science, 2008, 42, 357–361 Search PubMed.
- S. Watanabe, X. Ma and C. Song, J. Phys. Chem. C, 2009, 113, 14249–14257 CrossRef CAS.
- S. P. Suriyaraj and R. Selvakumar, RSC Adv., 2014, 4, 39619–39624 RSC.
- I. Singh and B. I. Birajdar, in Titanium Dioxide, Material for a Sustainable Environment, 2018, ch. 5, DOI:10.5772/intechopen.74568.
- I. Singh, R. Kumar and B. I. Birajdar, J. Environ. Chem. Eng., 2017, 5, 2955–2963 CrossRef CAS.
- R. Schiller, C. K. Weiss and K. Landfester, Nanotechnology, 2010, 21, 405603 CrossRef PubMed.
- J. Lukáč, M. Klementová, P. Bezdička, S. Bakardjieva, J. Šubrt, L. Szatmáry and A. Grusková, J. Mater. Sci., 2007, 42, 9421–9428 CrossRef.
- M. Krunks, A. Mere, I. Oja Acik, A. O. Juma and A. T. Oluwabi, Proc. Est. Acad. Sci., 2018, 67, 147–157 CrossRef.
- J. Wang, Y. Yu, S. Li, L. Guo, E. Wang and Y. Cao, J. Phys. Chem. C, 2013, 117, 27120–27126 CrossRef CAS.
- P. Goswami and J. N. Ganguli, Dalton Trans., 2013, 42, 14480–14490 RSC.
- A. P. Larios, J. L. Rico, L. M. A. Esparza, O. A. G. Vargas, N. G. Silva and R. Gómez, Catalysts, 2019, 9, 938 CrossRef.
- K. V. Bineesh, D. K. Kim and D. W. Park, Nanoscale, 2010, 2, 1222–1228 RSC.
- T. V. L. Thejaswini, D. Prabhakaran and M. A. Maheswari, J. Photochem. Photobiol., A, 2017, 344, 212–222 CrossRef CAS.
- H. Sezen, M. Buchholz, A. Nefedov, C. Natzeck, S. Heissler, C. Di Valentin and C. Woll, Sci. Rep., 2014, 4, 3808 CrossRef PubMed.
- G. Mishra and M. Mukhopadhyay, Sci. Rep., 2019, 9, 4345 CrossRef PubMed.
- B. Rajamannan, S. Mugundan, G. Viruthagiri, P. Praveen and N. Shanmugam, Spectrochim. Acta, Part A, 2014, 118, 651–656 CrossRef CAS PubMed.
- Z. Topalian, G. A. Niklasson, C. G. Granqvist and L. Osterlund, ACS Appl. Mater. Interfaces, 2012, 4, 672–679 CrossRef CAS PubMed.
- R. J. Alvaro, N. D. Diana and A. M. Maria, Contemp. Eng. Sci., 2017, 10, 1539–1549 CrossRef CAS.
- Z. A. Ansari, A. Umar, H. Fouad and S. G. Ansari, J. Nanoelectron. Optoelectron., 2015, 10, 290–294 CrossRef CAS.
- X. Wang, R. L. Patel and X. Liang, RSC Adv., 2018, 8, 25829–25834 RSC.
- S.-W. Kim, R. Khan, T.-J. Kim and W. J. Kim, Bull. Korean Chem. Soc., 2008, 29, 1217–1223 CrossRef CAS.
- M. Ahamed, M. A. Khan, M. J. Akhtar, H. A. Alhadlaq and A. Alshamsan, Sci. Rep., 2016, 6, 30196 CrossRef CAS PubMed.
- S. K. Suram, P. F. Newhouse and J. M. Gregoire, ACS Comb. Sci., 2016, 18, 673–681 CrossRef CAS PubMed.
- B. D. Viezbicke, S. Patel, B. E. Davis and D. P. Birnie, Phys. Status Solidi B, 2015, 252, 1700–1710 CrossRef CAS.
- C. Gionco, M. C. Paganini, E. Giamello, O. Sacco, V. Vaiano and D. Sannino, J. Energy Chem., 2017, 26, 270–276 CrossRef.
- Y. Chen, Y. Wang, W. Li, Q. Yang, Q. Hou, L. Wei, L. Liu, F. Huang and M. Ju, Appl. Catal., B, 2017, 210, 352–367 CrossRef CAS.
- H. Tang, H. Berger, P. E. Schmid, F. Lévy and G. Burri, Solid State Commun., 1993, 87, 847–850 CrossRef CAS.
- G. W. Simmons and B. C. Beard, J. Phys. Chem., 1987, 91, 1143–1148 CrossRef CAS.
- H. Chen, G. Jiang, T. Jiang, L. Li, Y. Liu, Q. Huang and W. Chen, MRS Commun., 2015, 5, 525–531 CrossRef CAS.
- P. Victor and S. B. Krupanidhi, J. Phys. D: Appl. Phys., 2004, 38, 41–50 CrossRef.
- Z. Yao, H. Sun, H. Sui and X. Liu, Nanoscale Res. Lett., 2020, 15, 78 CrossRef CAS PubMed.
- M. Aqeel, M. Ikram, A. Asghar, A. Haider, A. Ul-Hamid, M. Naz, M. Imran and S. Ali, Appl. Nanosci., 2020, 10, 2045–2055 CrossRef CAS.
- M. Ikram, I. Jahan, A. Haider, J. Hassan, A. Ul-Hamid, M. Imran, J. Haider, A. Shahzadi, A. Shahbaz and S. Ali, Appl. Nanosci., 2020, 1–11, DOI:10.1007/s13204-020-01412-z.
- C. Belver, J. Bedia and J. J. Rodriguez, J. Hazard. Mater., 2017, 322, 233–242 CrossRef CAS PubMed.
- W. Fang, X. Chaofa, J. Zheng, G. Chen and K. Jiang, RSC Adv., 2015, 5, 39612–39619 RSC.
- M. Ikram, S. Abbasi, A. Haider, S. Naz, A. Ul-Hamid, M. Imran, J. Haider and A. Ghaffar, Nanotechnology, 2020, 31, 275704 CrossRef CAS PubMed.
- G. H. Hitchings and J. J. Burchall, Adv. Enzymol. Relat. Areas Mol. Biol., 1965, 27, 417–468 CAS.
| This journal is © The Royal Society of Chemistry 2020 |


