 Open Access Article
The electronic structures and magnetic properties of mixed-valence Fe-based metal–organic VNU-15 frameworks: a theoretical study from linear response DFT+U calculations†
Diem Thi-Xuan Dang *ab,
Hieu Cao Dongab,
Yoshiyuki Kawazoecde,
Jer-Lai Kuo
 f and
Duc Nguyen-Manh
 g
g
aCenter for Innovative Materials and Architectures (INOMAR), Ho Chi Minh City 721337, Vietnam. E-mail: dxdiem@inomar.edu.vn; xuandiemdang@gmail.com
bVietnam National University – Ho Chi Minh City, Ho Chi Minh City 721337, Vietnam
cNew Industry Creation Hatchery Center, Tohoku University, Sendai 980-8579, Japan
dDepartment of Physics, Suranaree University of Technology, Nakhon Ratchasima, Thailand
eDepartment of Physics and Nanotechnology, SRM Institute of Science and Technology, Kattankulathur, Tamil Nadu-603203, India
fInstitute of Atomic and Molecular Sciences, Academia Sinica, Taipei 10617, Taiwan
gCCFE, United Kingdom Atomic Energy Authority, Culham Science Centre, UK
First published on 18th September 2020
Abstract
The crystal symmetries, electronic structures, and magnetic properties of metal–organic VNU-15 frameworks (VNU = Vietnam National University) were investigated using density functional calculations (DFT) with an on-site Coulomb repulsion approximation, Ueff, of 4.30 eV, determined via the linear response method. Two different orientations of dimethylammonium (DMA+) cations in VNU-15 were investigated. Antiferromagnetic configurations were predicted to be the ground states, with Fe ions in high-spin states for both phases. Furthermore, VNU-15 had intrinsic semiconductor electronic behavior with a small band gap of about 1.20 eV. The change in the orientation of DMA+ led to changes in the dispersion of the band structure, the band gap, and the Fe contributions to the valence band and conduction band. A fascinating feature was found involving exchange of oxidation numbers between two adjacent Fe atoms in the two phases. Our results revealed that VNU-15 has strong oxidation activity and predicted the important role of an anisotropic effect on the hole and electron effective masses. The findings presented that the electronic and magnetic properties could be controlled via hydrogen bonds and proved VNU-15 to be a prospective material for photocatalytic applications.
I. Introduction
Metal or metal-oxide clusters can be combined with organic linkers to create a new class of crystalline material, named metal–organic frameworks (MOFs). These materials have incredible properties, such as high surface areas and porosities, and adjustable physical and chemical properties.1 For this reason, MOFs have thrived in many application areas, such as catalysis,2,3 photocatalysis,4,5 gas storage,6,7 drug delivery,8,9 proton transfer,10,11 and so on. MOF structures, consisting of infinite rod-like secondary building units (SBUs), are useful because of the potential for isoreticular expansion, resistance to interpenetration, and breathing functionality.12–14 Numerous examples of rod-based SBUs have been reported, but series of solids based on [MII3O3(CO2)3]∝ (MOF-74)15 and [MIIIO2(CO2)2]∝ (MIL-53),16 in which M = Mg, Cr, Fe, Co, etc., have risen to prominence. The II and III indices, relating to a classical chemistry interpretation, indicate the valences of the compounds. These SBUs are composed of hydroxycarboxylate or carboxylate ligands and metal octahedra sharing μ2–O atoms. Of the numerous metals, Fe rod-based SBUs have been the subject of great interest because of their fascinating electronic and magnetic properties. For instance, Fe–MOF-74 displays ferromagnetic states and dramatically disparate band gaps between majority and minority spins in metastable states.17 Computational studies have revealed that a high-spin state (S = 2) is associated with the Fe ions in this structure.17–19 Canepa et al. investigated the existence of linear magnetism in Fe–MOF-74 at low temperature.20 The magnetic ordering of nodes of Fe–MOF-74 can be tuned via absorbing olefins that coordinate with the transition metal.18 A large-pore to narrow–pore transition in breathing Fe–MIL-53, resulting in significant alterations of the electronic properties, has been observed.21 Combelles et al. showed that Fe–MIL-53 is a weak anti-ferromagnetic insulator at 0 K, with Fe ions in the high-spin S = 5/2 state, through first-principles DFT+U calculations.22Until now, materials containing mixed-valence Fe atoms, such as Fe3O4, FeIII4[FeII(CN)6]3·xH2O, [NH2(CH3)2][FeIIIFeII(HCOO)6], etc., have shown outstanding performance in several key applications.23–25 Nevertheless, the above MOFs are generally constructed from rod chains of octahedral Fe(II) or Fe(III) SBUs from an ionic bonding point of view and, indeed, MOFs composed of mixed-valence Fe(II)- and Fe(III)-based SBUs are scarcely reported in the literature. Recently, Tu et al. synthesized VNU-15 (VNU stands for Vietnam National University), formulated as Fe4(BDC)2(NDC)(SO4)4(DMA)4, where BDC, NDC, and DMA are benzene-1,4-dicarboxylate, naphthalene-2,6-dicarboxylate, and dimethylammonium, respectively. This material is composed of novel infinite rod SBUs [Fe2(CO2)3(SO4)2(DMA)2]∝ based on both Fe(II) and Fe(III).26 These SBUs connect with two BDC2− and one NDC2− linker to create VNU-15, which is an anionic MOF balanced electrically with DMA cations. VNU-15 was tested as a proton transfer material in fuel cells and the proton conductivity reached 2.90 × 10² S cm−1 at 95 °C and 60% relative humidity. One of the possibilities explaining the high proton conductivity is the formation of a H-bond network between SO42− ions and DMA+ cations through a Grotthuss-type diffusion mechanism.27 Additionally, the proton conductivity of VNU-15 can be maintained for 40 hours without noticeable loss, and it has good heating–cooling stability.
The outstanding properties of infinite rod MOFs combined with the versatility of Fe have been shown in previous works,17,18 motivating us to study VNU-15. Although VNU-15 has been synthesized and its structure has been determined via X-ray diffraction, little is known about its electronic, magnetic, and other physical properties. Obtaining a comprehensive understanding of the many interesting properties of VNU-15 still remains desirable to provide vital fundamental data for its future utilization. Meanwhile, first-principles density functional calculations have been proven to be powerful in predicting the structural, electronic, and magnetic properties and chemical bonding of a wide series of MOFs.28,29 In the present work, density functional theory (DFT) with strong-electron correction was used to accurately describe the structure of VNU-15. The electronic structure and magnetic and chemical bonding properties in the ground state of VNU-15 were predicted. Different orientations of DMA cations in the anionic MOF were found to have significant effects on the electronic and magnetic properties of the material.30 Therefore, in this paper, the influence of the two orientations of DMA cations in VNU-15 on the electronic structures and magnetic properties was also considered.
II. Calculation methods
All theoretical calculations were performed using the DFT method within the Vienna Ab Initio simulation package (VASP).31,32 The generalized gradient approximation (GGA) functional and projector-augmented wave (PAW) method were employed.33,34 The ion–electron interactions were described using Perdew, Burke, and Ernzerhof (PBE) exchange-correlation.35 Spin-polarized calculations were performed due to the presence of Fe atoms. van der Waals (vdW) interactions are fundamental in the porous and layered structure of VNU-15; therefore, this work made extensive use of DFT, especially of a functional including the vdW correction D3.36A cut-off energy of 600 eV was identified to provide effective precision based on a cut-off energy study carried out in the range from 300 eV to 800 eV. The absolute energies were converged to within 10−5 eV per atom. Fully relaxed optimization of the atomic coordinates of VNU-15 was conducted using the standard conjugate gradient algorithm until the forces on all atoms were less than 10−2 eV Å−1. Brillouin-zone integration was performed with a Gaussian broadening of 0.1 eV during all relaxations. In this paper, the PAW treatment of pseudopotentials uses the 3d and 4s electrons for Fe, the 3s and 3p electrons for S, the 2s and 2p electrons for N, C, and O, and the 1 s electron for H. Because of the large primitive cell (approximately 250 atoms per primitive cell), the Γ-point alone was sufficient for sampling the Brillouin zone for all optimization calculations, while a denser 2 × 2 × 3 k-point was utilized for the density of states calculations. To understand the chemical bonding and interactions between constituents in VNU-15, charge density difference and Bader charge analyses37 were performed. The charge density difference was calculated from the subtraction of the electron density of the compound from the electron density of free atoms in the same framework with constant volume. All crystal structures were visualized using the VESTA program.38
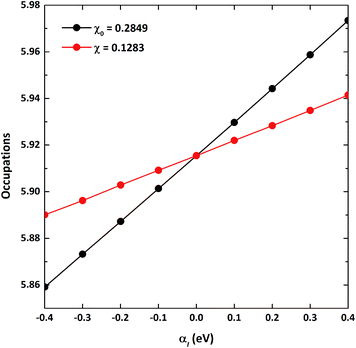
As the GGA cannot be used to express well systems containing partially filled d-orbitals, the GGA+U method was used.39 The effective correlation energy, Ueff, for Fe d-orbitals was determined via a linear response approach:
 | (1) |
 | (2) |
 | (3) |
III. Results and discussion
A. The spin configurations and structural properties
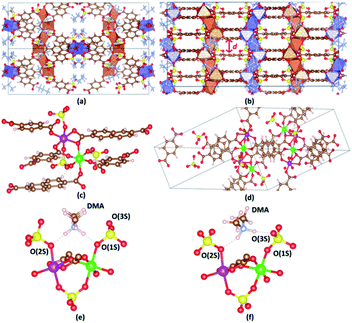
The crystal structure of VNU-15 is illustrated in Fig. 2(a and b). The conventional cell of the VNU-15 crystal structure determined from XRD experiments is orthorhombic with the Fddd space group (no. 70) and the lattice parameters a = 16.76 Å, b = 18.83 Å, c = 39.00 Å. This cell contains sixteen formula units of Fe2(CO2)3(SO4)2(DMA)2 (1088 atoms), while the primitive cell includes four formula units (272 atoms). The experimentally XRD refined crystal structure for VNU-15 includes uncertainties in determining occupancy in different atomic C, H positions in the NDC2− ligand, which is acceptable from crystallographic point of view but creates a major obstacle to applying DFT calculations to VNU-15. The elimination of the disorder can be done manually via removing some C and H atoms from the NDC2− linker; then, the conventional cell of the obtained VNU-15 is orthorhombic with the Fdd2 space group (no. 43), and the number of atoms in the obtained primitive cell is 244. When analyzing the crystal structure of VNU-15, two distinct metal nodes exist (Fe(1) and Fe(2)), which alternate consecutively in order, as shown in Fig. 2(c). Both Fe(1) and Fe(2) atoms adopt octahedral geometries, with four O atoms at in-plane coordination sites symmetrically comprising two BDC2− linkers and SO42− ions. The Fe(1) octahedron has two O atoms from two NDC2− linkers coordinated at the axial sites, whereas the Fe(2) octahedron has two O atoms from one NDC2− linker. For further analysis, calculations on the primitive cell were performed to enable a reduction in research expense and time. This primitive cell contains two independent Fe chains with four independent octahedral Fe atoms per chain (Fig. 2(d)). The relaxed positions of the eight Fe atoms in the primitive cell are shown in Table 1. In the experimental structure,26 DMA cations are found to orient symmetrically with the infinite rod SBUs because of hydrogen bonding with sulfate ligands (N–H⋯O–S distances of 1.90–196 Å), as shown in Fig. 2(e), which is denoted as DMA-1. Two hydrogen atoms from DMA are in turn bonded to two oxygen atoms connected between sulfur and iron. Upon optimizing the structure, another orientation of DMA+ was discovered, as shown in Fig. 2(f), denoted as DMA-2. A hydrogen atom of DMA is bonded to an oxygen atom connected between sulfur and iron, while the other hydrogen of DMA is bonded to an oxygen atom only connected with sulfur. Because both cases are potentially experimental, they are studied in the remainder of this paper.| Phase | Atom | Wyckoff position | Site symmetry | x | y | z |
|---|---|---|---|---|---|---|
| DMA-1 | Fe1 | 16b | 1 | 0.8283 | 0.0894 | 0.5818 |
| Fe2 | 0.5373 | 0.2938 | 0.6245 | |||
| Fe3 | 0.3264 | 0.5877 | 0.5836 | |||
| Fe4 | 0.1219 | 0.8788 | 0.5403 | |||
| Fe5 | 0.8312 | 0.5827 | 0.0884 | |||
| Fe6 | 0.8751 | 0.6255 | 0.2928 | |||
| Fe7 | 0.8329 | 0.5846 | 0.5867 | |||
| Fe8 | 0.7897 | 0.5413 | 0.8778 | |||
| DMA-2 | Fe1 | 16b | 1 | 0.8307 | 0.0886 | 0.5837 |
| Fe2 | 0.5401 | 0.2918 | 0.6251 | |||
| Fe3 | 0.3273 | 0.5851 | 0.5869 | |||
| Fe4 | 0.1235 | 0.8764 | 0.5424 | |||
| Fe5 | 0.8276 | 0.5847 | 0.0876 | |||
| Fe6 | 0.8737 | 0.6261 | 0.2908 | |||
| Fe7 | 0.8314 | 0.5878 | 0.5841 | |||
| Fe8 | 0.7884 | 0.5433 | 0.8754 |
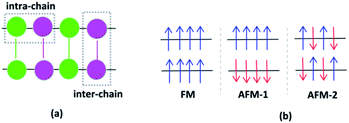
Investigating various spin configurations may be advantageous for achieving an in-depth understanding of electronic behavior.42,43 Starting from the non-spin polarized convergence geometries, spin-polarized structure optimizations were carried out as the next step, where the Fe ions were regarded as magnetic centers and distinctive configurations were studied.44 The Fe cations of VNU-15 interact with each other along the same metal rod, called intra-chain interactions, and between neighboring metal rods (intermediated by linkers), called inter-chain interactions. The directions of these interactions are shown in Fig. 3(a). Eight high-spin Fe ions in the VNU-15 primitive cell can present up and down spins, resulting in 256 (28) spin configuration possibilities. Among the 256 spin configurations that can occur in the primitive cell of VNU-15, we chose the three simplest configurations for consideration. First is the case where all Fe ions are of the same spin value, that is, all with spin up or spin down, as represented in Fig. 3(b). This state is the result of intra- and inter-chain ferromagnetic interactions, and is referred to as FM. The second state is the result of ferromagnetic intra-chain and antiferromagnetic inter-chain interactions, which is named AFM-1. The third occurs with Fe ions showing opposite spin values alternately along the rods, as well as opposite spin values between the adjacent rods of the VNU-15 channel. The latter state, designated as AFM-2, is the result of antiferromagnetic interactions both intra- and inter-chain.
Key crystal structure geometric parameters from the optimized structures of VNU-15 in the different magnetic states are listed in Table 2. The lattice parameters in this work are slightly different from those obtained from X-ray diffraction experiments, but the differences are in a reasonable range (the maximum relative lattice parameter error being smaller than 7.5%). This discrepancy comes from eliminating disorder in the simulated structure and from calculations being done at 0 K, while the experimental structure was obtained at room temperature (298 K). The DMA-2 phase has been found to have a more-negative total energy compared to the DMA-1 phase and, obviously, the DMA-2 phase is more stable than the DMA-1 phase. The lattice parameters of the DMA-1 and DMA-2 phases showed slight discrepancies, and the volume of the DMA-2 phase was smaller by about 0.3% than the DMA-1 phase.
| Experiment | Simulation | |||||||
| DMA-1 | DMA-2 | |||||||
| FM | AFM-1 | AFM-2 | FM | AFM-1 | AFM-2 | |||
| IT | 70 | 43 | ||||||
| Crystal system | Orthorhombic | |||||||
| Space group | Fddd | Fdd2 | ||||||
| Number of atoms per unit cell | 1088 | 976 | ||||||
| Lattice constant | a (Å) | 16.76 | 16.99 (+1.37%) | 17.01 (+1.49%) | 17.03 (+1.61%) | 17.19 (+2.57%) | 17.18 (+2.51%) | 17.14 (+2.27%) |
| b (Å) | 18.83 | 17.80 (−5.49%) | 17.79 (−5.52%) | 17.75 (−5.74%) | 17.42 (−7.49%) | 17.43 (−7.43%) | 17.53 (−6.90%) | |
| c (Å) | 39.00 | 39.71 (+1.82%) | 39.73 (+1.87%) | 39.72 (+1.85%) | 40.01 (+2.59%) | 40.00 (+2.56%) | 39.90 (+2.31%) | |
| V (Å3) | 12![[thin space (1/6-em)]](https://www.rsc.org/images/entities/char_2009.gif) 304.49 304.49 |
12![[thin space (1/6-em)]](https://www.rsc.org/images/entities/char_2009.gif) 012.20 (−2.38%) 012.20 (−2.38%) |
12![[thin space (1/6-em)]](https://www.rsc.org/images/entities/char_2009.gif) 016.08 (−2.34%) 016.08 (−2.34%) |
12![[thin space (1/6-em)]](https://www.rsc.org/images/entities/char_2009.gif) 006.39 (−2.42%) 006.39 (−2.42%) |
11![[thin space (1/6-em)]](https://www.rsc.org/images/entities/char_2009.gif) 976.89 (−2.66%) 976.89 (−2.66%) |
11![[thin space (1/6-em)]](https://www.rsc.org/images/entities/char_2009.gif) 980.13 (−2.64%) 980.13 (−2.64%) |
11![[thin space (1/6-em)]](https://www.rsc.org/images/entities/char_2009.gif) 990.40 (−2.55%) 990.40 (−2.55%) |
|
| Bond length (Å) | Fe(1)–Fe(2) | 3.60 | 3.51 | 3.51 | 3.51 | 3.48 | 3.48 | 3.49 |
| Fe(1)–Fe(1) | 6.30 | 6.15 | 6.15 | 6.15 | 6.12 | 6.12 | 6.13 | |
| Fe(2)–Fe(2) | 7.21 | 7.02 | 7.02 | 7.02 | 6.97 | 6.97 | 6.99 | |
| Fe(1)–O(1S) | 2.12 | 2.16 | 2.16 | 2.16 | 2.00 | 2.00 | 1.99 | |
| Fe(1)–O(1C) | 2.03 | 2.05 | 2.05 | 2.04 | 2.02 | 2.02 | 2.02 | |
| Fe(1)–O(2C) | 2.17 | 2.10 | 2.10 | 2.10 | 2.05 | 2.05 | 2.05 | |
| Fe(2)–O(2S) | 2.09 | 1.97 | 1.97 | 1.97 | 2.18 | 2.18 | 2.17 | |
| Fe(2)–O(1C) | 2.09 | 1.97 | 1.97 | 1.97 | 2.02 | 2.02 | 2.02 | |
| Fe(2)–O(2C) | 2.26 | 2.24 | 2.24 | 2.24 | 2.23–2.34 | 2.24–2.33 | 2.22–2.34 | |
| N–H⋯O–S (1) | 1.90–196 | 1.74–1.77 | 1.74 | 1.74 | 1.80–1.83 | 180–1.83 | 1.80–1.82 | |
| N–H⋯O–S (2) | — | — | — | — | 1.74 | 1.70–1.74 | 1.71 | |
| Angle | Fe1–OC2–Fe2 | 108.89 | 108.14 | 108.09 | 108.20 | 106.83 | 106.98 | 107.26 |
| OC2–Fe1–OC2 | 180.00 | 178.01 | 177.92 | 178.08 | 178.67 | 178.70 | 179.12 | |
| OC2–Fe2–OC2 | 57.49 | 58.48 | 58.47 | 58.60 | 57.42 | 57.42 | 57.51 | |
| Interlayer spacing d (Å) | 3.40 | 3.39 | 3.38 | 3.38 | 3.36 | 3.36 | 3.36 | |
Deviations from the experimentally predicted structures have been studied in more detail through analysis of bonding interactions. Fe(1) and Fe(2) octahedra are in 8b (D2h symmetry) and 32 h (C2v symmetry) sites with Fddd symmetry. After optimization, both octahedra were in 16b sites with Fdd2 symmetry. The optimized bonds agreed well with the published crystal structure at a level no worse than that corresponding to a deviation value of 0.20 Å. The different magnetic configurations affected the bond lengths by a tiny amount in the same phase. However, different DMA orientations resulted in different Fe–O(S) bond lengths in each phase. For instance, the Fe(1)–O(1S) bond length in the DMA-2 phase is shorter than that of the DMA-1 phase by 0.16 Å, whereas the Fe(2)–O(2S) length in the DMA-2 phase is longer than that in the DMA-1 phase by 0.21 Å. The Fe(1)–O(1C) bond is stronger than the Fe(1)–O(2C) bond because of its shorter bond length, similar to the Fe(2) case. The dissimilar strengths of the two BDC2− and NDC2− linkers result in the difference in bond length. To further describe the Fe–O chains, the super-exchange Fe(1)–O(2C)–Fe(2) angle and O(2C)–Fe–O(2C) angle were studied. The super-exchange angle of VNU-15 is about 107–108°, larger compared with that of Fe–MOF-74 (105.90°),45 while the distance between two nearest Fe–Fe atoms is equal to 3.60 Å, which is larger than that of Fe–MOF-74 (2.90 Å). The O(2C)–Fe(1)–O(2C) angle is 180°, which leads to an Fe(2)–Fe(2) distance equal to two times that of the Fe(1)–Fe(2) distance. The O(2C)–Fe(2)–O(2C) angle is 57.49°, which leads to an Fe(1)–Fe(1) distance smaller than two times that of the Fe(1)–Fe(2) distance. The calculated super-exchange and O–Fe–O angles were found to be smaller than those from experiments, as shown in Table 2.
Structural analysis revealed that the SBUs were connected via four linker molecules, forming layers parallel to the (001) plane. Dispersion forces are important for capturing long-range interactions, such as the π–π stacking of aromatic rings, which support the framework and are able to permanently sustain pores. Indeed, the distance between two adjacent layers predicted from the present calculations is about 3.37 Å, which is within the vdW interaction distance of 2D conjugated carbon layers, and the closest Fe distance between two layers is 3.50 Å, indicating strong vdW interactions and metal–metal interactions between the two layers, confirming the findings of a previous experimental paper.26
The relative energy per primitive cell can be used to identify the preferred magnetic coupling of VNU-15, as shown in Table 3. It was found that the AFM-1 state has the lowest total energy compared to the others and, thus, the AFM-1 state is the most stable for the DMA-1 phase, while the AFM-2 configuration is the most stable for the DMA-2 phase. It is clear that AFM ordering is the magnetic ground state of VNU-15. Meanwhile, the magnetic ground state of Fe–MOF-74 is FM ordering. This statement is explained based on the distance between adjacent Fe centers affecting the direct exchange interactions between them (dFe−Fe = 2.90 Å in Fe–MOF-74 and dFe−Fe = 3.50 Å in VNU-15). In all cases, there are two local magnetic moments of 3.80 μB and 4.30 μB per Fe ion, reflecting the different oxidation states of Fe(1) and Fe(2). Specifically, Fe(1) and Fe(2) hold values of 3.80 μB and 4.30 μB in the DMA-1 phase, respectively, but the opposite is true in the DMA-2 phase. The magnetic moment of the O atoms has a very small value of 0.10 μB, originating from the interactions of O atoms with neighboring Fe atoms.
| Phase | Magnetic model | Exchange energy (eV per primitive cell) | Fe magnetic moment (μB per atom) | Total magnetic moment (μB per primitive cell) | |||
|---|---|---|---|---|---|---|---|
| DMA-1 | FM | 0.010 | 3.793 | 4.282 | 3.793 | 4.282 | 36.0 |
| 3.793 | 4.282 | 3.793 | 4.282 | ||||
| AFM-1 | 0.000 | −3.793 | −4.282 | −3.793 | −4.282 | 0.0 | |
| 3.793 | 4.282 | 3.793 | 4.282 | ||||
| AFM-2 | 0.020 | 3.776 | −4.282 | 3.777 | −4.282 | 0.0 | |
| −3.776 | 4.282 | −3.777 | 4.282 | ||||
| DMA-2 | FM | 0.020 | 4.315 | 3.781 | 4.315 | 3.781 | 36.0 |
| 4.315 | 3.781 | 4.315 | 3.781 | ||||
| AFM-1 | 0.018 | −4.315 | −3.781 | −4.315 | −3.781 | 0.0 | |
| 4.315 | 3.781 | 4.315 | 3.781 | ||||
| AFM-2 | 0.000 | 4.311 | −3.773 | 4.311 | −3.773 | 0.0 | |
| −4.311 | 3.773 | −4.311 | 3.773 | ||||
The effect of magnetic anisotropy on the electronic structures and magnetic properties was assessed utilizing non-collinear spin calculations. The initial local magnetic moments for each Fe ion were given in different directions. The local magnetic moments of Fe ions are primarily assigned along the z-direction and give rise to small projected values in the x- and y-directions. In addition, the local magnetic moment of each Fe ion, via considering spin–orbit coupling, was found to be only 0.002 μB smaller than the values obtained in the isotropic case. Apparently, spin–orbit coupling was negligible in VNU-15. Consequently, non-collinear and spin–orbit coupling effects were not considered in the rest of the paper as the influence on the atomic magnetic moments is negligible.
In order to check whether long-range magnetic ordering exists in the framework, the spin densities of VNU-15 were calculated and plotted, as shown in Fig. 4. Positive (yellow color) spin densities allocated along each SBU direction were found in the FM state, as shown in Fig. 4(a) and (d). The AFM-1 configuration displayed negative (blue) and positive (yellow) spin densities distributed along each SBU direction, as shown in Fig. 4(b) and (e). Meanwhile, adjacent blue and yellow spin densities distributed along the same chain were presented in the AFM-2 model, as shown in Fig. 4(c) and (f). As can be seen in Fig. 4, the magnetization is utterly localized on the Fe–O chains, resulting in tiny amounts of inter-chain coupling.
B. Electronic structures and charges
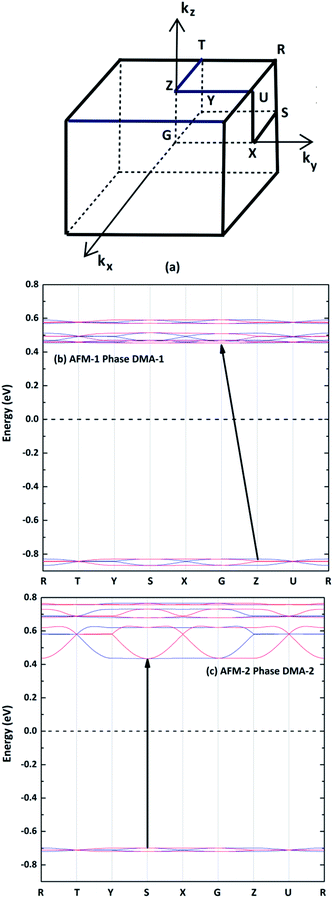
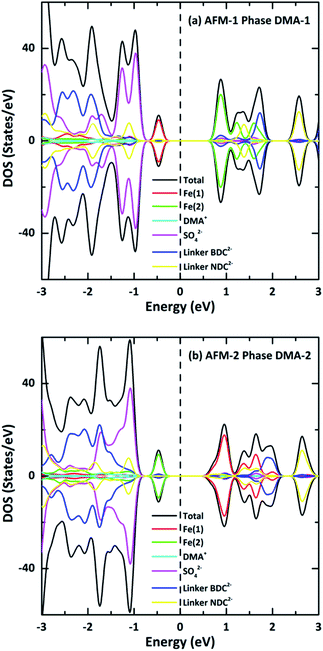
The spin-polarized electronic band structures were calculated using the GGA+U method for the AFM configurations between the high-symmetry points of the first Brillouin zone (Fig. 5(a)), as shown in Fig. 5(b) and (c). The band gaps of the DMA-1 and DMA-2 phases were 1.28 eV and 1.13 eV, respectively, indicating that VNU-15 belongs to the semiconductor class. Apparently, the reorientation of DMA cations led to the DMA-2 phase showing a narrower band gap than the DMA-1 phase and also a more disperse band structure. The AFM-1 valence band minimum (VBM) and conduction band maximum (CBM) of the DMA-1 phase were at the Z(0, 0, 0.5) and G(0, 0, 0) points, respectively. The AFM-2 VBM and CBM of the DMA-2 phase were at the S(−0.5, 0.5, 0) point. The electronic band structures for all magnetic configurations of the VNU-15 structure are depicted in Fig. S1, ESI.†To further understand the nature of the band structure, the total DOS of VNU-15 and partial DOS of ions around the Fermi energy EF were examined, as displayed in Fig. 6. The valence and conduction bands of DMA-1 show mainly Fe(1) and Fe(2) 3d-orbital contributions, respectively, whereas the situation is opposite for DMA-2. The low-lying band (below the valence band) is mainly centered on the orbitals of SO42− ions in both phases. The spin-polarized TDOS clearly displays nearly symmetric features in the spin-up and spin-down states of the AFM configurations. The electronic structures were found to be strongly influenced by on-site Coulomb repulsion. This breaks the strong Fe 3d–O 2p hybridization observed in the electronic structure calculated using the GGA (see Fig. S3, ESI†), resulting in the occupied Fe 3d states being shifted to higher energies. In contrast to the GGA, which predicts VNU-15 to be half-metal, GGA+U leads to a charge-transfer-type d–d gap of nearly 1.20 eV. It is reported that the GGA underestimates the band gap because it inadequately describes the strong correlation effect between 3d electrons localized on metal ions.29 Although there is no experimental band gap for reference, the band gap of Fe–MOF-74 was utilized for comparison. Fe–MOF-74 has a band gap of 0.30 eV, with a nearest Fe–Fe distance of 2.90 Å. Therefore, the band gap of VNU-15 may be roughly 1.20 eV with a distance of 3.50 Å. Consequently, the band gap obtained from GGA+U is more reasonable than that obtained via the GGA.17
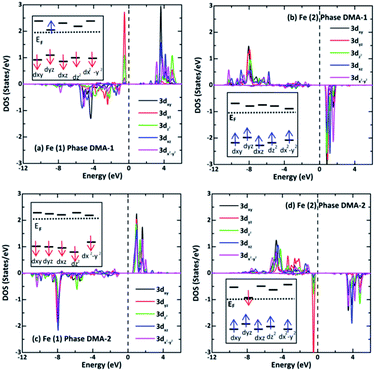
The LDOS for two adjacent Fe(1) and Fe(2) ions with reverse spins and different ml values are presented in Fig. 7 to clarify the oxidation states. It turns out that the spin-down components relocate to a much higher energy than the spin-up ones. Fe2+ has d6 configuration and four unpaired d electrons, while Fe3+ has d5 configuration and five unpaired d electrons. Fig. 7(a) and (b) show that there are four and five unpaired d electrons from Fe(1) and Fe(2), respectively, in the DMA-1 phase. Fig. 7(c) and (d) show that there are five and four unpaired d electrons for Fe(1) and Fe(2), respectively, in the DMA-2 phase. It was predicted that the oxidation states of Fe(1) and Fe(2) were +2 and +3 in the DMA-1 phase, whereas the oxidation states of Fe(1) and Fe(2) were +3 and +2 in DMA-2. These findings are supported based on the magnetic moments in Table 2 and Bader charges in Table 4. Specifically, the calculated Fe(1) and Fe(2) magnetic moments were 3.80 μB and 4.30 μB for the DMA-1 phase and, reversely, these values were 4.30 μB and 3.80 μB for the DMA-2 phase. The calculated Fe(1) and Fe(2) charges were found to be 1.80|e| and 1.48|e| for the DMA-1 phase, however, these charges were 1.45|e| and 1.86|e| for the DMA-2 phase.
| DMA-1 phase | DMA-2 phase | |||||
|---|---|---|---|---|---|---|
| Atom/state | FM | AFM-1 | AFM-2 | FM | AFM-1 | AFM-2 |
| Fe(1) | 1.804 | 1.804 | 1.805 | 1.445 | 1.445 | 1.446 |
| Fe(2) | 1.482 | 1.482 | 1.479 | 1.859 | 1.859 | 1.857 |
| O(1C) | −1.116 | −1.116 | −1.117 | −1.116 | −1.117 | −1.117 |
| O(2C) | −1.139 | −1.139 | −1.136 | −1.147 | −1.146 | −1.143 |
| O(1S) | −1.334 | −1.334 | −1.333 | −1.287 | −1.286 | −1.286 |
| O(2S) | −1.263 | −1.263 | −1.263 | −1.328 | −1.328 | −1.327 |
| O(3S) | −1.315 | −1.316 | −1.315 | −1.319 | −1.320 | −1.319 |
| C(1) | 0.353 | 0.353 | 0.356 | 0.344 | 0.344 | 0.343 |
| C(2) | 0.215 | 0.215 | 0.213 | 0.227 | 0.226 | 0.228 |
| S | 3.712 | 3.713 | 3.711 | 3.733 | 3.734 | 3.733 |
| H(linker) | 0.097 | 0.096 | 0.094 | 0.098 | 0.099 | 0.098 |
| DMA+ | 0.470 | 0.466 | 0.459 | 0.421 | 0.422 | 0.432 |
| SO42− | −1.515 | −1.515 | −1.515 | −1.518 | −1.520 | −1.518 |
From Table 4, the average charges show insignificant variations between the spin configurations in the same phase. O(2C) has similar charges to O(1C) in both phases. The change in the orientation of DMA caused S to increase by 0.02|e| in the DMA-2 phase. In addition, it also changed the charges of O(1S) and O(2S) in the two phases. The charges of O(1S) and O(2S) in DMA-1 were −1.33|e| and −1.26|e|, and these changed to −1.28|e| and −1.33|e| in the DMA-2 phase. The charge of O(3S) underwent a negligible change in the two cases. The charges of the atoms in the linker are very small, indicating the vdW interactions between the linkers. Furthermore, only the charges of O atoms are found to be negative, while the other atom charges are positive, reflecting the ionic bonds between the atoms.
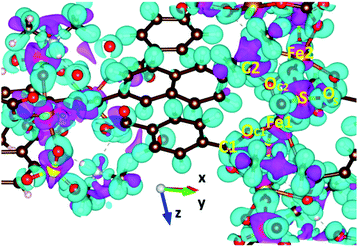
GGA+U calculations of the charge density difference were executed to clarify the nature of chemical bonding in VNU-15, as shown in Fig. 8. For BDC2− and NDC2− linkers, the plot shows that charge is mainly concentrated on the hydrogen atoms, and the charge transfer effect is insignificant. This can be explained by the fact that the stacked layers along the z-direction in the VNU-15 structure are held together by vdW interactions, which in turn is consistent with the analysis in the above discussion. For the SBUs, electrons transferring from O to Fe, C, and S sites indicates that Fe–O, C–O, and S–O bonding is ionic. Moreover, there are remarkable ionic bonds between Fe 3d–O 2p states, which stabilizes the structure. The findings relating to the nature of chemical bonding from GGA+U are similar to those from the GGA.
C. Photocatalytic activity
Because the band gap is small, VNU-15 is capable of absorbing infrared light, and we expect that VNU-15 can be used in the photocatalytic field. In order to prove the possibility of VNU-15 acting as a photocatalyst, the reduction and oxidation potentials of the CB and VB edges can be calculated as follows:
 | (4) |
| ECB = EVB − Eg, | (5) |
χ is the electronegativity of the semiconductor calculated as the geometric mean of the absolute electronegativities of the constituent atoms, x(A):
 | (6) |
 | (7) |
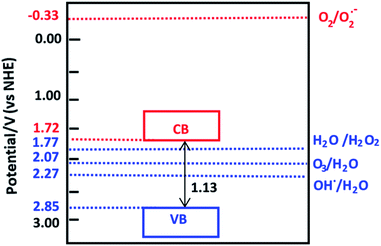
The calculated electronegativity of VNU-15 is 6.79 eV. Therefore, the calculated oxidation and reduction potentials of the VB and CB edges are 2.85 V and 1.72 V, respectively, as shown in Fig. 9. O2 is not reduced to O2•− by the photogenerated electrons in the CB of VNU-15. The VB potential of VNU-15 is more positive than the oxidation potentials of H2O2/H2O (1.77 V), O3/H2O (2.07 V), and •OH/H2O (2.27 V).48 Therefore, the photogenerated holes can oxidize H2O to produce the active species H2O2, O3, and •OH, which can further decompose dye molecules and organic pollutants.
High mobility indicates fast carrier transport speeds from the bulk to the surface. This can diminish the electron–hole recombination probability within a semiconductor and strengthen the photocatalytic activity. The mobility of photogenerated electrons and holes has been investigated in a previous study.49 Based on a nearly free electron approximation, the mobility of photoexcited carriers can be calculated via the following formula:
 | (8) |
 | (9) |
 and holes
  correspond to the positive and negative signs, respectively. Commonly, a larger effective mass implies lower migration ability and a higher recombination probability for carriers within the semiconductor. Carriers in flat and disperse bands have large and small effective masses, respectively. Because the band structure of the DMA-2 phase is more dispersed than that of the DMA-1 phase, in this section, we only focus on a discussion of the DMA-2 phase. The masses were gained by fitting parabolic functions within an energy difference of 5 meV around the VBM and CBM along the designated directions. The 3D band structures for carrying out this calculation are shown in Fig. S4† (ESI), and the effective mass results are summarized in Table 5.
 and hole
  masses in free-electron mass units for AFM-2 of the DMA-2 phase of VNU-15 from GGA+U calculations
In order to achieve good photocatalytic performance, the difference between the electron and hole effective masses should be large, to reduce the rate of recombination. Moreover, the effective hole mass should be smaller than the electron mass in order to move quickly to the surface, because only holes are involved in the photocatalytic process. In the spin-up case, the effective hole mass is lighter than the electron mass along the [100], [010], and [0![[1 with combining macron]](https://www.rsc.org/images/entities/char_0031_0304.gif) 1] directions, whereas the ratio between
1] directions, whereas the ratio between  and
and  along the [0
![[1 with combining macron]](https://www.rsc.org/images/entities/char_0031_0304.gif) 1] direction is greater than in the two remaining directions. For the spin-down case, the effective hole mass is lighter than the electron mass along the [001] direction, and the ratio between the electron and hole effective masses is around 5. Therefore, it can be predicted that the photocatalytic activity on the surfaces corresponding to the [0
1] direction is greater than in the two remaining directions. For the spin-down case, the effective hole mass is lighter than the electron mass along the [001] direction, and the ratio between the electron and hole effective masses is around 5. Therefore, it can be predicted that the photocatalytic activity on the surfaces corresponding to the [0![[1 with combining macron]](https://www.rsc.org/images/entities/char_0031_0304.gif) 1] and [001] directions is efficient in the spin-up and spin-down cases, respectively.
1] and [001] directions is efficient in the spin-up and spin-down cases, respectively.
The 3D band structures can qualitatively demonstrate the effective mass in the plane rather than special cases.50 For instance, the 3D band structures for the valence and conduction bands in the ky−kz plane are depicted in Fig. 10, where the chosen k-points are all centered at the S point. Fig. 10(a) and (c) exhibit that the projections of the valence bands are flat ellipses, hence, the effective hole masses are strongly anisotropic. Because of the much longer axis of the flat ellipse, the effective mass of photogenerated holes in the spin-up case is much larger along the [001] direction compared to the [010] direction. Meanwhile, the effective photogenerated hole mass for spin down is larger along the [010] direction compared to the [001] one. Similarly, Fig. 10(b) and (d) show that the projections of the conduction bands are flat ellipses, hence, the effective electron masses show significant differences in different directions. These findings are very supportive of the data shown in Table 5.
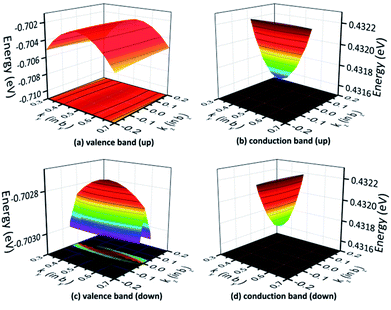 | ||
| Fig. 10 The band structure for AFM-2 of the DMA-2 phase in the ky−kz plane with the (a) valence and (b) conduction bands for spin up, and the (c) valence and (d) conduction bands for spin down. | ||
The theoretical findings in this paper can be validated by experiments in different ways. Firstly, DMA-2 formation can be detected by electric control of the orientation of H-bonding between the DMA+ molecules and the framework using second-harmonic generation techniques.30,51 The DMA+ band-structure effect could be probed using angular-resolved photoelectron spectroscopy. It is possible to study the effectiveness of VNU-15 in photocatalysis via adding its powder to RhB or TC-H solution. The suspension is stirred for a given time interval in a dark environment to reach adsorption–desorption equilibrium. After infrared light illumination, which is generated using a Xe lamp with a suitable filter, the suspension is collected after a given period of time and separated via centrifugation. This approach was used for mixed-valence FeII/FeIII Fe–MIL-53.52 Secondly, ac impedance measurements can be performed using a pelletized sample of VNU-15 in a magnetic field from low relative humidity to medium humidity at an elevated temperature. This experiment can be used to check how the intrinsic magnetic properties predicted in this work would affect the proton transport properties of VNU-15 with respect to an applied magnetic field.
IV. Conclusions
A detailed investigation into the electronic structures, magnetic properties, and bonding natures of VNU-15 with two different DMA cation orientations using linear response DFT+U methods has been presented. The calculations show that VNU-15 still retains an orthorhombic crystal structure after eliminating structural disorder. Our results imply a possible new phase of VNU-15 with another DMA cation orientation in the pores. Based on the linear response method, the Hubbard U term acting on the 3d sites of Fe was determined to be 4.30 eV. Density of states studies reveal that VNU-15 shows semiconductor behavior with a band gap of approximately 1.20 eV. The calculated magnetic moments show that VNU-15 is an antiferromagnetic system at a temperature of 0 K, with values of 3.80 μB and 4.30 μB for each different Fe atom. The valence band and conduction band of VNU-15 are mainly composed of Fe 3d states. The change in the orientation of DMA+ led to changes in the dispersion of the band structure, the band gap, and the Fe contributions to the valence band and conduction band. Such an effect could be used for spin-control in porous and molecular magnets. Charge density difference analysis consistently supports the notion that the bonding interactions between Fe–O, S–O, and C–O mainly involve ionic interactions, whereas those between ligands mainly involve van der Waals interactions. The inclusion of Hubbard correlation effects significantly improves the band gap and magnetic moment predictions for VNU-15. This strongly points to the importance of correlation for studying the physics of iron-based MOFs. The VBM potential of VNU-15 is 2.85 V and the CBM potential is 1.72 V, indicating that the photogenerated holes have strong oxidation abilities. Additionally, the separation and transfer of photogenerated carriers along the [0![[1 with combining macron]](https://www.rsc.org/images/entities/char_0031_0304.gif) 1] and [001] directions for spin up and down, respectively, are more effective compared with other directions based on analysis of the effective masses. These theoretical results suggest a wide range of applications for VNU-15 in photocatalysis, and investigations into the proton transport properties of magnetic MOF materials would be an interesting subject for future studies.
1] and [001] directions for spin up and down, respectively, are more effective compared with other directions based on analysis of the effective masses. These theoretical results suggest a wide range of applications for VNU-15 in photocatalysis, and investigations into the proton transport properties of magnetic MOF materials would be an interesting subject for future studies.
Conflicts of interest
There are no conflicts to declare.Author contributions
D. T.-X. D. and D. N.-M. designed the study and wrote and edited the main draft. D. T.-X. D. and H. C. D. performed the computational works. D. T.-X. D. analyzed data and figures and carried out administrative duties relating to the project. D. N.-M. supervised tasks. Y. K. and J.-L. K. provided computational resources and software. All authors discussed the results and commented on the manuscript.Acknowledgements
The work was supported by grants from Vietnam National University Ho Chi Minh City grant number B2018-50-01. The authors express their sincere thanks to the staff of CCMS of the Institute for Materials Research, Tohoku University, for their continuous support and help in using the MASAMUNE-IMR, CRAY-XC50 supercomputing facilities. D. T.-X. D. thanks Mr Dai-Nam Le (Ton Duc Thang University, Vietnam) for his valuable comments. The authors thank two referees for their constructive and valuable suggestions.Notes and references
- H. Furukawa, K. E. Cordova, M. O'Keeffe and O. M. Yaghi, Science, 2013, 341, 1230444 CrossRef.
- L. H. T. Nguyen, T. T. Nguyen, H. L. Nguyen, T. L. H. Doan and P. H. Tran, Catal. Sci. Technol., 2017, 7, 4346 RSC.
- P. T. K. Nguyen, H. T. D. Nguyen, H. N. Nguyen, C. A. Trickett, Q. T. Ton, E. Gutierrez-Puebla, M. Angeles Monge, K. E. Cordova and F. Gandara, ACS Appl. Mater. Interfaces, 2018, 10, 733 CrossRef CAS.
- T. L. H. Doan, H. L. Nguyen, H. Q. Pham, N.-N. Pham-Tran, T. N. Le and K. E. Cordova, Chem.–Asian J., 2015, 10, 2660 CrossRef CAS.
- H. L. Nguyen, T. T. Vu, D. Le, T. L. H. Doan, V. Q. Nguyen and N. T. S. Phan, ACS Catal., 2017, 7, 338 CrossRef CAS.
- P. T. K. Nguyen, H. T. D. Nguyen, H. Q. Pham, J. Kim, K. E. Cordova and H. Furukawa, Inorg. Chem., 2015, 54, 10065 CrossRef CAS.
- H. T. D. Nguyen, Y. B. N. Tran, H. N. Nguyen, T. C. Nguyen, F. Gándara and P. T. K. Nguyen, Inorg. Chem., 2018, 57, 13772 CrossRef CAS.
- P. Horcajada, C. Serre, M. Vallet-Regi, M. Sebban, F. Taulelle and G. Ferey, Angew. Chem., 2006, 45, 5974 CrossRef CAS.
- S. R. Miller, D. Heurtaux, T. Baati, P. Horcajada, J.-M. Greneache and C. Serre, Chem. Commun., 2010, 46, 4526 RSC.
- T. H. N. Lo, M. V. Nguyen and T. N. Tu, Inorg. Chem. Front., 2017, 4, 1509 RSC.
- M. V. Nguyen, T. H. N. Lo, L. C. Luu, H. T. T. Nguyen and T. N. Tu, J. Mater. Chem. A, 2018, 6, 1816 RSC.
- N. L. Rosi, M. Eddaoudi, J. Kim, M. O'Keeffe and O. M. Yaghi, Angew. Chem., Int. Ed., 2002, 41, 284 CrossRef CAS.
- S. Horike, S. Shimomura and S. Kitagawa, Nat. Chem., 2009, 1, 695 CrossRef CAS.
- P. Horcajada, F. Salles, S. Wuttke, T. Devic, D. Heurtaux, G. Maurin, A. Vimont, M. Daturi, O. David, E. Magnier, N. Stock, Y. Filinchuk, D. Popov, C. Riekel, G. Ferey and C. Serre, J. Am. Chem. Soc., 2011, 133, 17839 CrossRef CAS.
- H. Deng, S. Grunder, K. E. Cordova, C. Valente, H. Furukawa, M. Hmadeh, F. Gándara, A. C. Whalley, Z. Liu, S. Asahina, H. Kazumori, M. O'Keeffe, O. Terasaki, J. F. Stoddart and O. M. Yaghi, Science, 2012, 336, 1018 CrossRef CAS.
- C. Serre, F. Millange, C. Thouvenot, M. Nogues, G. Marsolier, D. Louer and G. Ferey, J. Am. Chem. Soc., 2002, 124, 13519 CrossRef CAS.
- Q. Zhang, B. Li and L. Chen, Inorg. Chem., 2013, 52, 9356 CrossRef CAS.
- J. Park, H. Kim and Y. Jung, J. Phys. Chem. Lett., 2013, 4, 2530 CrossRef CAS.
- D. Yu, A. O. Yazaydin, J. R. Lane, P. D. C. Dietzel and R. Q. Snurr, Chem. Sci., 2013, 4, 3544 RSC.
- P. Canepa, Y. J. Chabal and T. Thonhauser, Phys. Rev. B: Condens. Matter Mater. Phys., 2013, 87, 094407 CrossRef.
- S. Ling and B. Slater, J. Phys. Chem. C, 2015, 119, 16667 CrossRef CAS.
- C. Combelles, M. B. Yahia, L. Pedesseau and M.-L. Doublet, J. Power Sources, 2011, 196, 3426 CrossRef CAS.
- M. B. Gawande, P. S. Branco and R. S. Varma, Chem. Soc. Rev., 2013, 42, 3371 RSC.
- C. Mathoniere, C. J. Nuttall, S. G. Carling and P. Day, Inorg. Chem., 1996, 35, 1201 CrossRef CAS.
- J.-P. Zhao, B.-W. Hu, F. Lloret, J. Tao, Q. Yang, X.-F. Zhang and X.-H. Bu, Inorg. Chem., 2010, 49, 10390 CrossRef CAS.
- T. N. Tu, N. Q. Phan, T. T. Vu, H. L. Nguyen, K. E. Cordova and H. Furukawa, J. Mater. Chem. A, 2016, 4, 3638 RSC.
- A. Shigematsu, T. Yamada and H. Kitagawa, J. Am. Chem. Soc., 2011, 133, 2034 CrossRef CAS.
- L.-M. Yang, P. Vajeeston, P. Ravindran, H. Fjellvag and M. Tilset, Inorg. Chem., 2010, 49, 10283 CrossRef CAS.
- D. T.-X. Dang, H. T.-D. Nguyen, N. Thoai, J.-L. Kuo, N. T. T. Nguyen and D. Nguyen-Manh, Phys. Chem. Chem. Phys., 2020, 22, 1598 RSC.
- P. Jain, A. Stroppa, D. Nabok, A. Marino, A. Rubano, D. Paparo, M. Matsubara, H. Nakotte, M. Fiebig, S. Picozzi, E. S. Choi, A. K. Cheetham, C. Draxl, N. S. Dalal and V. S. Zapf, npj Quantum Mater., 2016, 1, 16012 CrossRef.
- G. Kresse and J. Furthmuller, Comput. Mater. Sci., 1996, 6, 15 CrossRef CAS.
- G. Kresse and J. Furthmuller, Phys. Rev. B: Condens. Matter Mater. Phys., 1996, 54, 11169 CrossRef CAS.
- P. E. Blochl, Phys. Rev. B: Condens. Matter Mater. Phys., 1994, 50, 17953 CrossRef.
- G. Kresse and D. Joubert, Phys. Rev. B: Condens. Matter Mater. Phys., 1999, 59, 1758 CrossRef CAS.
- J. P. Perdew, K. Burke and M. Ernzerhof, Phys. Rev. Lett., 1996, 77, 3865 CrossRef CAS.
- S. Grimme, S. Ehrlich and J. Goerigk, J. Comput. Chem., 2011, 32, 1456 CrossRef CAS.
- W. Tang, E. Sanville and G. Henkelman, J. Phys.: Condens. Matter, 2009, 21, 084204 CrossRef CAS.
- K. Momma and F. Izumi, J. Appl. Crystallogr., 2011, 44, 1272 CrossRef CAS.
- S. L. Dudarev, G. A. Botton, S. Y. Savarsov, C. J. Humphreys and A. P. Sutton, Phys. Rev. B: Condens. Matter Mater. Phys., 1998, 57, 1505 CrossRef CAS.
- M. Cococcioni and S. D. Gironcoli, Phys. Rev. B: Condens. Matter Mater. Phys., 2005, 71, 035105 CrossRef.
- H. M. Le, T.-T. Pham, T. S. Dinh, Y. Kawazoe and D. Nguyen-Manh, J. Phys.: Condens. Matter, 2016, 28, 135301 CrossRef.
- H. Li, M. Huang and G. Cao, J. Mater. Chem. C, 2017, 5, 4557 RSC.
- R. Hu, Y. H. Li, Z. H. Zhang, Z. Q. Fan and L. Sun, J. Mater. Chem. C, 2019, 7, 7745 RSC.
- M. Hosseini, D. E. P. Vanpoucke, P. Giannozzi, M. Berahman and N. Hadipour, RSC Adv., 2020, 10, 4786 RSC.
- A. M. P. Moeljadi, R. Schmid and H. Hirao, Can. J. Chem., 2016, 94, 1144 CrossRef CAS.
- Y. Xu and M. A. A. Schoonen, Am. Mineral., 2000, 85, 543 CrossRef CAS.
- R. S. Mulliken, J. Chem. Phys., 1934, 2, 782 CrossRef CAS.
- J. Zhang, W. Yu, J. Liu and B. Liu, Appl. Surf. Sci., 2015, 358, 457 CrossRef CAS.
- H. Q. Pham, D. Q. Le, N.-N. Pham-Tran, Y. Kawazoe and D. Nguyen-Manh, RSC Adv., 2019, 9, 29440 RSC.
- Z. Li, Y. Dai, X. Ma, Y. Zhu and B. Huang, Phys. Chem. Chem. Phys., 2014, 16, 3267 RSC.
- Y. Tian, J. Cong, S. Shen, Y. Chai, L. Yan, S. Wang and Y. Sun, Phys. Status Solidi RRL, 2014, 8, 91 CrossRef CAS.
- H. Chen, Y. Liu, T. Cai, W. Dong, L. Tang, X. Xia, L. Wang and T. Li, ACS Appl. Mater. Interfaces, 2019, 11, 28791 CrossRef CAS.
Footnote |
| † Electronic supplementary information (ESI) available. See DOI: 10.1039/d0ra05865c |
| This journal is © The Royal Society of Chemistry 2020 |

