 Open Access Article
Creative Commons Attribution 3.0 Unported Licence
A redox-active support for the synthesis of Au@SnO2 core–shell nanostructure and SnO2 quantum dots with efficient photoactivities†
Xiaoyang
Pan
 *a,
Wen-Jie
Chen
a,
Huizhen
Cai
a,
Hui
Li
a,
Xue jiao
Sun
a,
Bo
Weng
 *b and
Zhiguo
Yi
 *c
*c
aCollege of Chemistry and Materials, Quanzhou Normal University, Quanzhou, 362000, China. E-mail: xypan@qztc.edu.cn
bcMACS, Department of Microbial and Molecular Systems, KU Leuven, Celestijnenlaan 200F, 3001 Leuven, Belgium. E-mail: bo.weng@kuleuven.be
cState Key Lab of High Performance Ceramics and Superfine Microstructure, Shanghai Institute of Ceramics, Chinese Academy of Sciences, Shanghai 200050, China. E-mail: zhiguo@mail.sic.ac.cn
First published on 14th September 2020
Abstract
A defect pyrochlore-type Sn1.06Nb2O5.59F0.97 (SnNbOF) nano-octahedron is used as a redox-active support for fabricating Au@SnO2 core–shell and SnO2 quantum dots at room temperature without the use of organic species or foreign reducing reagents. Gold (Au) and SnO2 components were obtained through an in situ redox reaction between the HAuCl4 and reductive Sn2+ ions incorporated in SnNbOF. The composition and morphology of the resulting nanocomposites (denoted as Au–SnNbOF) could be controlled by adjusting the Au/SnNbOF ratio. The Au–SnNbOF nanocomposites exhibited efficient photoactivities for methyl orange (MO) degradation under the visible light irradiation (λ > 420 nm), during which the MO was almost completely degraded within 8 min. Among all the samples, the 5wt% Au–SnNbOF nanocomposite had the highest rate constant (0.43 min−1), which was 40 times higher than that of the blank SnNbOF.
1 Introduction
Gold (Au) nanoparticles have been the subject of extensive research because of their unique application in many areas.1–8 However, when used alone, Au nanoparticles are frequently subject to agglomeration because of their high surface energy.9–12 To overcome this disadvantage, a plausible solution is to anchor the Au nanoparticles on specific supports.9–12 Among the various types of supports, metal oxides have emerged as the most promising supports, since they are abundant in nature and are frequently used in various industry applications.9–11Over the years, a variety of Au-metal oxide nanocomposites have been fabricated to prevent Au from aggregation, and increased efforts have been put into the controllable synthesis of Au@metal oxide core–shell nanostructures.6,13–20 Encapsulation of the metal oxide shell results in the Au nanoparticles exhibiting excellent performance and prevents them from agglomeration, even under high-temperature treatment.21,22 However, the synthetic methods largely rely on a complicated and environmentally unfriendly procedure, which leads to the high cost of the product and environmental pollution.6,13–20,23,24 In view of this, it is crucial to develop a simple and green strategy for the synthesis of Au@metal oxide core–shell nanostructures.
Clearly, most of the current methods used for the synthesis of metal oxide-coated Au nanostructures require foreign reducing agents and/or organic surfactants.1,5,25–27 As a result, impurities are inevitably introduced, which is harmful to the performance of the Au@metal oxide.1 Recently, we reported a simple and green method for synthesizing the supported noble metal nanoparticles on defect pyrochlore-type Sn1.06Nb2O5.59F0.97 (SnNbOF) without the use of organic species or foreign reducing agents.28 On the basis of this method, we herein report the use of SnNbOF as a redox-active support for the synthesis of Au@SnO2 core–shell nanostructures. The successful construction of a core–shell structure is realized through an in situ redox reaction between HAuCl4 and reductive SnNbOF in an aqueous solution. Moreover, tin(IV) oxide (SnO2) quantum dots are formed simultaneously on the surface of the SnNbOF. The resulting nanocomposites demonstrate efficient photoactivities for methyl orange (MO) degradation.
In comparison with previous reports on the synthesis of core–shell nanostructures (Table S1†), our strategy has the following clear advantages: (i) the synthetic procedure involves one single step and requires no organic structure-directing agents; (ii) neither foreign reducing agents nor thermal treatment is necessary for the growth of the Au core and the SnO2 shell; (iii) SnNbOF is used as a multifunctional support-reducing agent for the Au ions, as a substrate for the growth of Au@SnO2 composites and, most importantly, as a structure-directing agent for a controllable synthesis of the core–shell nanostructure and (iv) the 5 wt% Au–SnNbOF nanocomposite demonstrates superior photoactivity for MO degradation, as compared with most of the photocatalysts in previous reports.29–36
2 Experimental
2.1. Materials
HAuCl4, SnF2, HF, NH4OH and Nb2O5 were purchased from Sinopharm Chemical Regent Co., Ltd. (Shanghai, China), whereas deionized water was obtained from local sources. All the materials were used as received without further purification.2.2. Synthesis
Sn1.06Nb2O5.59F0.97 (SnNbOF) was synthesized according to our previous report.28 The growth of Au nanoparticles on the surface of the SnNbOF was conducted as follows: 0.2 g of the as-obtained SnNbOF was dispersed in 100 mL of deionized water with the aid of ultrasonication. Then, a given quantity of HAuCl4 in an aqueous solution was mixed with the SnNbOF suspension using vigorous stirring at room temperature. After 48 h of stirring, the final products were collected, washed with distilled water and dried at 353 K in an oven.2.3. Characterization
The crystal structures of the as-prepared samples were analysed using a Rigaku Miniflex II X-ray diffractometer with Cu Kα radiation. The optical properties of the samples were characterised via a Cary 500 ultraviolet-visible (UV-vis) diffuse reflectance spectrophotometer (DRS), with BaSO4 used as the internal reflectance standard during the procedure. A field-emission scanning electron microscope (JSM-6700F) and a transmission electron microscope (TEM; JEM-2010, FEI, Tecnai G2 F20 FEG TEM) were used to determine the morphology and microscopic structure of the as-synthesized samples. X-ray photoelectron spectroscopy (XPS) measurements were performed using a Thermo Scientific ESCA Lab250 spectrometer consisting of a monochromatic Al Kα as the X-ray source, a hemispherical analyser and a sample stage with multi-axial adjustability to obtain the composition on the surface of the samples. All the binding energies were calibrated via the C 1s peak of the surface adventitious carbon at 284.6 eV. Electron Spin Resonance (ESR) signals of the radicals trapped by 5,5-dimethyl-1-pyrroline-N-oxide (DMPO) were recorded using a Bruker ESP300E spectrometer. Photoelectrochemical analysis was performed according to our previous report.37 Photoelectrochemical analysis has been performed according to our previous report.28 Photoluminescence analysis was carried out with a Varian Cary Eclipse spectrometer at an excitation wavelength of 325 nm.2.4. Photocatalytic activities
For the photocatalytic degradation methyl orange (MO), a 30 mg photocatalyst was dispersed into 60 mL of MO solution (10 ppm) in a quartz vial. The resulting suspension was stirred in the dark for 1 h to ensure the establishment of an adsorption–desorption equilibrium between the sample and the reactant. Then, the reaction system was irradiated via a 300 W Xe lamp (CEL-HXF300) system with a UV-CUT filter (λ > 420 nm). As the reactions proceeded, 3 mL of the suspension was taken at a certain time interval and was centrifuged to remove the catalyst. Following this, the residual amount of MO in the solution was analyzed on the basis of its characteristic optical absorption at 470 nm, using a UV/vis/NIR spectrophotometer (Perkin Elmer Lambda 900) to measure the change in MO concentration with an irradiation time based on Lambert–Beer's law. The percentage of degradation is denoted as C/C0. Here C is the absorption of the MO solution at each irradiation time interval of the main peak of the absorption spectrum, whereas C0 is the absorption of the initial concentration when the absorption–desorption equilibrium was achieved.3 Results and discussion
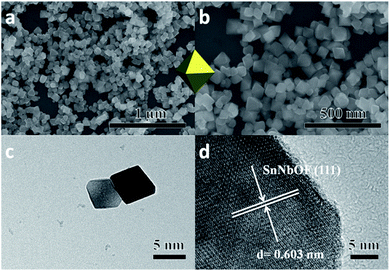
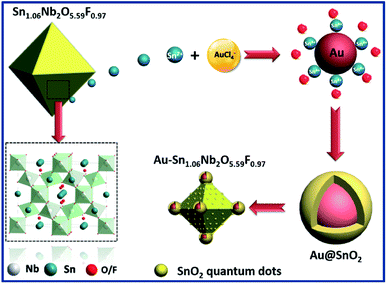
The defect pyrochlore-type Sn1.06Nb2O5.59F0.97 (SnNbOF) was prepared via a hydrothermal method at 473 K for 24 h using SnF2 and Nb2O5·nH2O as precursors. Fig. S1† displays a typical powder X-ray diffraction of the as-obtained sample, which can be indexed to cubic structure of pyrochlore compound with cell constants of a = b = c = 10.557 Å.28 The X-ray photoelectron spectroscopy analysis revealed that the sample was composed of Sn, Nb, O and F elements (Fig. S2a†). The valence states of Sn, Nb, O and F elements were determined to be +2, +5, −2 and −1, respectively (Fig. S2b–e†). The SEM image showed that the product particles are of well-defined octahedral shape. The microstructure of SnNbOF nano-octahedron was further investigated by TEM analysis. Fig. 1c shows a low-magnification TEM image of two octahedral particles. The HRTEM image in Fig. 1d exhibits a distinct lattice spacing of 0.603 nm for the (111) plane of the SnNbOF.28In terms of the defect pyrochlore SnNbOF, the characteristic structural feature is a three-dimensional framework formed by octahedral NbO6 units (Fig. 2). The Sn2+ ions can move easily in the interstitial cavities within the framework.28 Based on these unique properties, SnNbOF could be used as a reactive support for the direct growth of Au nanoparticles via an in situ redox reaction between reductive Sn2+ and HAuCl4 in an aqueous solution (Fig. 2). The synthetic procedure was conducted at room temperature without the use of foreign reductants or organic surfactants.
The variation of the concentration of HAuCl4 precursors can also modulate the composition and morphology of the final product. During the synthetic procedure, a large excess of SnNbOF was used as the precursor. Therefore, the number of Au nanoparticles and Sn4+ ions formed (Fig. 2) depended on the Au/SnNbOF ratio. At a low ratio of 0.5 wt%, the number of Sn4+ ions were correspondingly low and the hydrolysis reaction of the ions barely occurred. As a result, very little SnO2 was formed during the synthesis. Meanwhile, at relatively high ratios (≥3 wt%), the concentration of Sn4+ ions was enough to induce the hydrolysis reaction. The as-formed SnO2 was decorated onto the surface of the Au nanoparticles and the SnNbOF. The Au@SnO2 core–shell nanostructure and the SnO2 quantum dots were subsequently obtained.
The TEM observations revealed that it is possible to modulate the morphology of the nanocomposite by simply varying the Au/SnNbOF ratios (Fig. 3). For the 0.5 wt% Au-loaded SnNbOF, the resulting nanocomposite (0.5 wt% Au–SnNbOF) was composed of bare Au nanoparticles supported on the SnNbOF surface (Fig. 3a–c). No obvious SnO2 particles were observed on the surface of the Au particles. The increase in Au content resulted in a typical core–shell structure, in which an Au core was coated with the SnO2 shell (Fig. 3d–l, S3a and b†). As a result, we can obtain a surface support (0.5 wt% Au–SnNbOF) and a core–shell structure (3 wt% Au–SnNbOF, 5 wt% Au–SnNbOF and 10 wt% Au–SnNbOF), respectively.
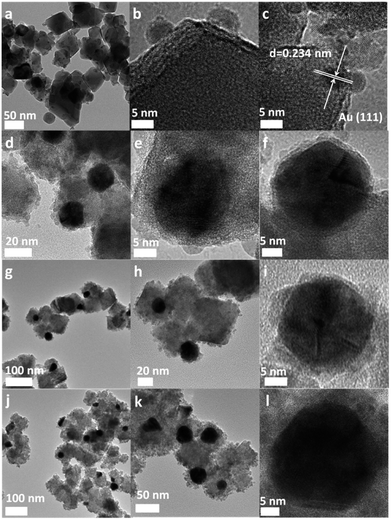 | ||
| Fig. 3 TEM and HRTEM images of 0.5 wt% Au–SnNbOF (a–c), 3 wt% Au–SnNbOF (d–f), 5 wt% Au–SnNbOF (g–i) and 10 wt% Au–SnNbOF (j–l). | ||
To further investigate the core–shell structure, 10 wt% Au–SnNbOF was chosen and the nature of the nanostructure unravelled via high-angle annular dark-field scanning (HAADF-STEM) and elemental mapping analysis. Fig. 4a and b show the TEM images of the Au@SnO2 core–shell structure. The lattice spacings measured in the HRTEM image were 0.235 nm in the core and 0.334 nm in the shell (Fig. 4c), which can be ascribed to the (111) facet of the Au and the (110) plane of the SnO2, respectively.6 The HAADF-STEM image (Fig. 4d) clearly revealed that the nanocomposite had a core–shell structure, whereas the elemental mapping analysis further demonstrated that the element Au was distributed only in the core and that the Sn and O elements of the SnO2 were homogenously distributed throughout the whole particle (Fig. 4e–g). These results suggest that the Au cores were surrounded by SnO2 shells. The energy-dispersive X-ray analysis for the 10 wt% Au–SnNbOF nanocomposites also confirmed the compositions of the Au, Sn, Nb, O and F elements (Fig. 4h), suggesting that the Au@SnO2 composite was decorated on the SnNbOF surface. The XPS analysis revealed that Au in 10 wt% Au–SnNbOF is in the metallic state (Fig. S4a†).28 The coexistence of Sn(II) and Sn(IV) in 10 wt% Au–SnNbOF suggests that some of the Sn(II) ions in SnNbOF were oxidized by the Au ions (Fig. S4b†). These results indicate that the Au and SnO2 has been successfully decorated on the surface of SnNbOF.
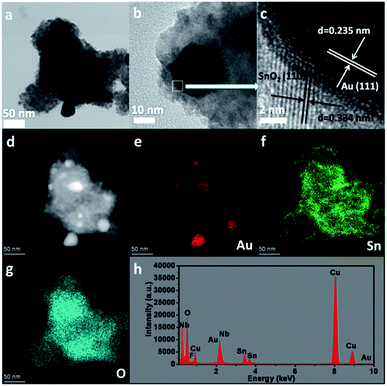 | ||
| Fig. 4 The characterizations of 10 wt% Au–SnNbOF. (a and b) TEM image, (c) HRTEM image, (d) HAADF-STEM image, (e–g) elemental mapping analysis and (h) EDX analysis. | ||
Besides the Au@SnO2 core–shell nanostructure, we also found that the surfaces of the SnNbOF nano-octahedron of the Au–SnNbOF (Au ≥ 3 wt%) were coarse (Fig. S5†) compared with the smooth surface of the blank SnNbOF (Fig. 1c) and the 0.5 wt% Au–SnNbOF (Fig. S6†). The magnified TEM image demonstrates that the SnNbOF surface of the 3 wt% Au–SnNbOF was composed of crystallized SnO2 quantum dots with ca. 3–4 nm diameters (Fig. S5a and b†). The size of the SnO2 dots increased with an increase in Au content (Fig. S5c–f†).
Fig. 5a shows the XRD patterns of the SnNbOF and Au–SnNbOF nanocomposites. It is clear that all the Au–SnNbOF nanocomposites, as well as blank SnNbOF, exhibited similar XRD patterns. The main diffraction peaks of all the samples can be attributed to the face-centered cubic crystals of pyrochlore compounds.28 The characteristic peaks of SnO2 (101)38 and Au (111)39–42 were also observed at 36.9° and 38.2°, respectively, when the weight ratio of Au was greater than or equal to 3 wt% (Fig. 5b). In contrast, 0.5 wt% Au–SnNbOF exhibited no XRD peaks of SnO2 and Au (Fig. 5b).
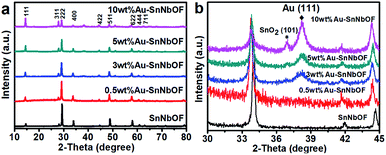 | ||
| Fig. 5 (a) XRD patterns and (b) enlarged XRD patterns of the SnNbOF and the Au–SnNbOF nanocomposites. | ||
On comparing the XRD patterns, increasing the Au content was found to result in the following: the intensity of the XRD peaks of the (111) and (311) marked in Fig. 5a progressively increased, and the reflections shifted towards lower 2θ angles (Fig. 5b). These phenomena can almost certainly be ascribed to the ion exchange reaction between the Sn2+ ions of SnNbOF and the H+ ions of HAuCl4, which has also been reported in a previous study.43 In addition, we also found that intensities of other diffraction peaks of SnNbOF such as (222) and (400) peaks decreased after Au decoration. These results can be attributed to the fact that the relative content of the SnNbOF in Au–SnNbOF nanocomposites decreased when increase the Au content.
The optical properties of the SnNbOF and Au–SnNbOF nanocomposites were investigated via UV-vis DRS (Fig. S7†). The blank SnNbOF had visible light absorption capability because of its narrow bandgap (2.33 eV), as reflected in Fig. S8a, b and S9.†28 Following Au decoration, a clear absorption peak appeared at ca. 550 nm, which can be ascribed to the surface plasmon resonance of Au nanoparticles (Fig. S7†).44 In addition, it is also found that the introduction of different Au weight ratios had a significant influence on the optical property of the samples. As shown in Fig. S7,† the absorption intensity within the range of 550–800 nm was enhanced by the increase in the Au weight ratio.
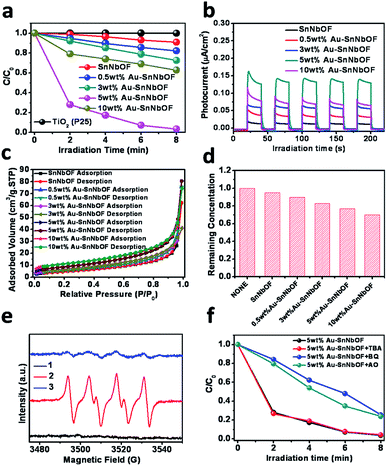
In terms of proof of concept, methyl orange (MO) photocatalytic degradation was selected as the probe reaction to demonstrate the application of the samples. As shown in Fig. 6a, the blank SnNbOF exhibited a moderate visible light photoactivity, which was higher than that of TiO2 (P25). Meanwhile, the Au–SnNbOF nanocomposites exhibited improved visible light photocatalytic activities than the blank SnNbOF. Among all the photocatalysts, the 5 wt% Au–SnNbOF nanocomposite had the highest rate constant (0.43 min−1, Fig. S10†), which was 40 times higher than that of the blank SnNbOF. Within 8 min, the MO was almost completely degraded under visible light irradiation, which significantly exceeded the performance of the SnNbOF. Moreover, the stability of the photocatalyst was also evaluated. As shown in Fig. S11,† following four cycles of photocatalytic reaction, the photocatalytic performance of the used 5 wt% Au–SnNbOF was similar to that of its fresh counterparts. In particular, the activity of the 5 wt% Au–SnNbOF was also compared with the known photocatalysts previously reported, with the photoactivity of the sample found to be superior to most of the reported photocatalysts (Table S2†).
A variety of joint characterization techniques were utilized to reveal the origin of the superior performance of Au–SnNbOF composites for MO degradation. First, the photocurrent response of the samples was measured under visible light irradiation. As shown in Fig. 6b, the photocurrent density obtained across the sample electrodes followed a sequence of 5 wt% Au–SnNbOF > 10 wt% Au–SnNbOF > 3 wt% Au–SnNbOF > 0.5 wt% Au–SnNbOF > SnNbOF. In addition, electrochemical impedance spectroscopy (EIS) Nyquist plots have also been performed (Fig. S12†). The decoration of Au results in obvious decrease of the arc as compared to blank SnNbOF, indicating that the Au–SnNbOF nanocomposites have much smaller charge-transfer resistance than the SnNbOF.37 These results suggest a longer lifetime of charge carriers photogenerated over Au–SnNbOF composites than over blank SnNbOF.37 This is also supported by the photoluminescence (PL) analysis. As shown in Fig. S13,† the blank SnNbOF exhibits a broad emission peak around 550 nm, which is attributed to the charge recombination. The 5 wt% Au–SnNbOF nanocomposite exhibited obviously reduced intensity of the PL emission of SnNbOF, indicating the reduced charge carriers recombination of Au–SnNbOF nanocomposite in comparison to the blank SnNbOF. This can be ascribed to the fact that the decoration of Au and SnO2 on SnNbOF results in an improvement in the charge separation efficiency because of the matched energy band structure (Fig. S14†). Therefore, it would appear that the observed photoactivity sequence could be well correlated with the charge separation efficiency. The highest photoactivity of the 5 wt% Au–SnNbOF was in accordance with its highest charge separation efficiency. Notably, although 10 wt% Au–SnNbOF has the highest amount of Au, its charge separation efficiency is lower than that of 5 wt% Au–SnNbOF. This indicates that the Au amount is an important factor influencing the photoactivity of the sample. At low Au content, Au can act as separation centers and thus improve the photoactivities. However, as Au amount exceed optimum loading, they can act as charge recombination centers, which are detrimental to the photocatalytic efficiency.31
Second, we also investigated the influence of the effect of Au nanoparticles on the photoactivities of the samples. Generally, two main mechanisms are proposed to explain the enhanced photoactivity via Au nanoparticles, the first of which relates to the plasmon-excited charge transfer from the Au to the semiconductor and the second to the photoexcited electron transfer from the semiconductor to the Au. In the first mechanism, the Au nanoparticles are plasmon-excited under visible light irradiation, meaning the maximum contribution of the Au particles should occur at the strongest plasmon absorption. However, the rate constant of the 5 wt% Au–SnNbOF was very low at 550 nm (Fig. S15†). This indicates that the plasmonic effect of the Au particles was not the main contributor to the enhanced photoactivity. Moreover, the matched energy band structures of SnNbOF and Au are beneficial to the transfer of photo-induced electrons from SnNbOF to Au (Fig. S14†), which could improve the charge separation efficiency, as already revealed by the photocurrent analysis (Fig. 6b). Therefore, it can be stated that Au particles most likely serve as electron collectors to retard the charge recombination.
Finally, the surface area and the adsorption ability of the samples were also investigated. As displayed in Fig. 6c, the nitrogen (N2) adsorption–desorption isotherms of the SnNbOF and Au–SnNbOF nanocomposites exhibited type IV isotherms with a typical H3 hysteresis loop characteristic of mesoporous solids.45 It is clear from Table S3† that the Au–SnNbOF nanocomposites had larger surface areas than the blank SnNbOF. It is also clear that the surface area of the nanocomposites increased with the increase in Au weight ratio. This increased surface area resulted in enhancing the adsorption capacity of the Au–SnNbOF nanocomposites, as shown in Fig. 6d. The higher photoactivities of the Au–SnNbOF were in accordance with the higher surface area and adsorption capacity. Notably, although the 10 wt% Au–SnNbOF possessed the largest specific surface area and adsorption capacity, its photoactivity was lower than that of the 5 wt% Au–SnNbOF. These results suggest that the primary factor accounting for the photoactivity improvement of Au–SnNbOF nanocomposites cannot be attributed to the differences in specific surface area and the adsorption capacity of the samples; rather, it must be attributed to the improved charge separation efficiency and synergistic interactions among Au, SnO2 and SnNbOF.
To study the active radical species involved in the MO degradation, ESR analysis was performed using the 5 wt% Au–SnNbOF sample. Under visible light irradiation, the signal of superoxide radicals (O2−˙) could be clearly observed, as shown in Fig. S16.†46 However, no hydroxyl radicals were detected in the reaction system. These results indicate that O2−˙ were the primary radical species formed during the reaction. In view of this, the interaction of the O2−˙ with the reactants was further investigated. As shown in Fig. 6e, under the dark and air atmosphere conditions, no obvious signal was detected. However, when the reaction system was irradiated with visible light, a typical ESR O2−˙ signal emerged. After adding MO into the reactor, the O2−˙ signal almost disappeared, indicating that the O2−˙ were consumed during the photocatalytic reaction.
To get further insight into reaction mechanism for MO degradation, a series of blank/controlled experiments were performed. The blank experiments without catalyst or visible light irradiation show no degradation of MO, which confirms that the reaction is truly driven by a photocatalytic process. As displayed in Fig. 6f, with the addition of benzoquinone (BQ) as superoxide-scavenger,47 the photocatalytic reaction became remarkably inhibited. An equally clear inhibition phenomenon within the photocatalytic reaction was also observed when ammonium oxalate was added as hole scavenger.46 Moreover, the reaction rate underwent very little change after tert-butyl alcohol was added as the hydroxyl radical scavenger,46 which is consistent with the ESR result. These results indicate that both superoxide radicals and photogenerated holes are the active species for MO degradation.
Based on these results, a possible reaction mechanism is proposed. Under visible light irradiation, electron–hole pairs are generated from the SnNbOF. The photoexcited electrons are then transferred from the conduction band of the SnNbOF to the Au or SnO2 because of the matched energy band structure. Following this, they are captured by the molecular oxygen to form O2−˙. These active oxygen species are capable of oxidizing MO. Meanwhile, photogenerated holes, which have an anodic potential of 2.1 V vs. NHE, are incapable of oxidising H2O to form hydroxyl radicals (anodic potential: 2.8 V vs. NHE); rather, they directly participate in the MO degradation reaction.
4 Conclusions
A simple, green and one-step method was reported in relation to the growth of an Au@SnO2 core–shell nanostructure and SnO2 quantum dots on SnNbOF nano-octahedron. During this process, SnNbOF acts as a redox-active support for the formation of composite nanostructures. The composition and morphology of the Au–SnNbOF nanocomposites can be simply tuned by varying the weight content of the Au. The Au–SnNbOF hybrids can serve as efficient visible light-driven photocatalysts for MO degradation. The improved charge separation efficiency, increased surface area and adsorption capacity efficiently boost the performance of the hybrids as compared with that of blank SnNbOF.Conflicts of interest
There are no conflicts to declare.Acknowledgements
This work was financially supported by the Natural Science Foundation of China (Grants No. 21607153, 51872311 and 21902132), Natural Science Foundation of Fujian Province (2019J01735), Program for New Century Excellent Talents in Fujian Province University; the Award Program for Tongjiang Scholar Professorship, the Innovation and Entrepreneurship Projects for High-level Talents of Quanzhou (2017Z028), the Key Research Program of Frontier Sciences of the Chinese Academy of Sciences (Grant No. QYZDB-SSW-JSC027) and the Doctoral Research Start-up Funds Project of Quanzhou Normal University; The European Union's Horizon 2020 research and innovation programme under the Marie Skłodowska-Curie grant agreement No. 891276.References
- Z. Wang, H. Fu, D. Han and F. Gu, J. Mater. Chem. A, 2014, 2, 20374–20381 RSC.
- L. Abis, S. J. Freakley, G. Dodekatos, D. J. Morgan, M. Sankar, N. Dimitratos, Q. He, C. J. Kiely and G. J. Hutchings, ChemCatChem, 2017, 9, 2914–2918 CrossRef CAS.
- M. Haruta, Gold Bull., 2004, 37, 27–36 CrossRef CAS.
- S. Yamazoe, K. Koyasu and T. Tsukuda, Acc. Chem. Res., 2014, 47, 816–824 CrossRef CAS.
- G. Li and Z. Tang, Nanoscale, 2014, 6, 3995–4011 RSC.
- G. Oldfield, T. Ung and P. Mulvaney, Adv. Mater., 2000, 12, 1519–1522 CrossRef CAS.
- E. Shaviv, O. Schubert, M. Alves-Santos, G. Goldoni, R. Di Felice, F. Vallée, N. Del Fatti, U. Banin and C. Sönnichsen, ACS Nano, 2011, 5, 4712 CrossRef CAS.
- M. Haruta and M. Daté, Appl. Catal., A, 2001, 222, 427–437 CrossRef CAS.
- W.-Z. Li, L. Kovarik, D. Mei, M. H. Engelhard, F. Gao, J. Liu, Y. Wang and C. H. F. Peden, Chem. Mater., 2014, 26, 5475–5481 CrossRef CAS.
- Y. Imura, S. Koizumi, R. Akiyama, C. Morita-Imura and T. Kawai, Langmuir, 2017, 33, 4313–4318 CrossRef CAS PubMed.
- T. V. Choudhary and D. W. Goodman, Top. Catal., 2002, 21, 25–34 CrossRef CAS.
- F. Ke, J. Zhu, L.-G. Qiu and X. Jiang, Chem. Commun., 2013, 49, 1267–1269 RSC.
- C.-H. Kuo, T.-E. Hua and M. H. Huang, J. Am. Chem. Soc., 2009, 131, 17871–17878 CrossRef CAS PubMed.
- T. D. Schladt, M. I. Shukoor, K. Schneider, M. N. Tahir, F. Natalio, I. Ament, J. Becker, F. D. Jochum, S. Weber, O. Köhler, P. Theato, L. M. Schreiber, C. Sönnichsen, H. C. Schröder, W. E. G. Müller and W. Tremel, Angew. Chem., Int. Ed., 2010, 49, 3976–3980 CrossRef CAS.
- L. Zhang, D. A. Blom and H. Wang, Chem. Mater., 2011, 23, 4587–4598 CrossRef CAS.
- Y. Sun, Y. Sun, T. Zhang, G. Chen, F. Zhang, D. Liu, W. Cai, Y. Li, X. Yang and C. Li, Nanoscale, 2016, 8, 10774–10782 RSC.
- D. D. Lekeufack, A. Brioude, A. Mouti, J. G. Alauzun, P. Stadelmann, A. W. Coleman and P. Miele, Chem. Commun., 2010, 46, 4544–4546 RSC.
- D.-Y. Liu, S.-Y. Ding, H.-X. Lin, B.-J. Liu, Z.-Z. Ye, F.-R. Fan, B. Ren and Z.-Q. Tian, J. Phys. Chem. C, 2012, 116, 4477–4483 CrossRef CAS.
- C.-H. Kuo, Y.-C. Yang, S. Gwo and M. H. Huang, J. Am. Chem. Soc., 2011, 133, 1052–1057 CrossRef CAS.
- S. M. Majhi, P. Rai and Y.-T. Yu, ACS Appl. Mater. Interfaces, 2015, 7, 9462–9468 CrossRef CAS.
- J.-N. Park, A. J. Forman, W. Tang, J. Cheng, Y.-S. Hu, H. Lin and E. W. McFarland, Small, 2008, 4, 1694–1697 CrossRef CAS.
- S. H. Joo, J. Y. Park, C.-K. Tsung, Y. Yamada, P. Yang and G. A. Somorjai, Nat. Mater., 2009, 8, 126–131 CrossRef CAS PubMed.
- L. Martinez, A. Mayoral, M. Espineira, E. Roman, F. J. Palomares and Y. Huttel, Nanoscale, 2017, 9, 6463–6470 RSC.
- N. Meir, I. Jen-La Plante, K. Flomin, E. Chockler, B. Moshofsky, M. Diab, M. Volokh and T. Mokari, J. Mater. Chem. A, 2013, 1, 1763–1769 RSC.
- H. Sun, J. He, J. Wang, S.-Y. Zhang, C. Liu, T. Sritharan, S. Mhaisalkar, M.-Y. Han, D. Wang and H. Chen, J. Am. Chem. Soc., 2013, 135, 9099–9110 CrossRef CAS.
- A. Vanderkooy and M. A. Brook, ACS Appl. Mater. Interfaces, 2012, 4, 3980–3986 CrossRef CAS.
- R. Ghosh Chaudhuri and S. Paria, Chem. Rev., 2012, 112, 2373–2433 CrossRef CAS PubMed.
- X. Pan, C. Li, J. Zheng, S. Liang, R. Huang and Z. Yi, Inorg. Chem., 2018, 57, 6641–6647 CrossRef CAS PubMed.
- W. Guo, F. Zhang, C. Lin and Z. L. Wang, Adv. Mater., 2012, 24, 4761–4764 CrossRef CAS PubMed.
- L. Ge and J. Liu, Appl. Catal., B, 2011, 105, 289–297 CrossRef CAS.
- F. Han, V. S. R. Kambala, M. Srinivasan, D. Rajarathnam and R. Naidu, Appl. Catal., A, 2009, 359, 25–40 CrossRef CAS.
- C. Han, L. Ge, C. Chen, Y. Li, X. Xiao, Y. Zhang and L. Guo, Appl. Catal., B, 2014, 147, 546–553 CrossRef CAS.
- L. Ge, C. Han and J. Liu, Appl. Catal., B, 2011, 108–109, 100–107 CrossRef CAS.
- J. Cao, B. Luo, H. Lin and S. Chen, J. Hazard. Mater., 2011, 190, 700–706 CrossRef CAS PubMed.
- S. A. Ansari, M. M. Khan, M. O. Ansari, J. Lee and M. H. Cho, RSC Adv., 2014, 4, 26013–26021 RSC.
- T. Lv, L. Pan, X. Liu and Z. Sun, Electrochim. Acta, 2012, 83, 216–220 CrossRef CAS.
- X. Pan, M.-Q. Yang, Z.-R. Tang and Y.-J. Xu, J. Phys. Chem. C, 2014, 118, 27325–27335 CrossRef CAS.
- H. Wang, Y. Wu, Y. Bai, W. Zhou, Y. An, J. Li and L. Guo, J. Mater. Chem., 2011, 21, 10189–10194 RSC.
- J. Li, C.-y. Liu and Y. Liu, J. Mater. Chem., 2012, 22, 8426–8430 RSC.
- S.-H. Wu, C.-T. Tseng, Y.-S. Lin, C.-H. Lin, Y. Hung and C.-Y. Mou, J. Mater. Chem., 2011, 21, 789–794 RSC.
- P. Zhang, C. Shao, X. Li, M. Zhang, X. Zhang, C. Su, N. Lu, K. Wang and Y. Liu, Phys. Chem. Chem. Phys., 2013, 15, 10453–10458 RSC.
- Y. Zhang, S. Liu, W. Lu, L. Wang, J. Tian and X. Sun, Catal. Sci. Technol., 2011, 1, 1142–1144 RSC.
- A. J. G. Zarbin, O. L. Alves, J. M. Amarilla, R. M. Rojas and J. M. Rojo, Chem. Mater., 1999, 11, 1652–1658 CrossRef CAS.
- X. Pan and Y.-J. Xu, Appl. Catal., A, 2013, 459, 34–40 CrossRef CAS.
- X. Pan, X. Chen and Z. Yi, ACS Appl. Mater. Interfaces, 2016, 8, 10104–10108 CrossRef CAS.
- N. Zhang, S. Liu, X. Fu and Y.-J. Xu, J. Phys. Chem. C, 2011, 115, 9136–9145 CrossRef CAS.
- Y. Zhang, N. Zhang, Z.-R. Tang and Y.-J. Xu, Chem. Sci., 2012, 3, 2812–2822 RSC.
Footnote |
| † Electronic supplementary information (ESI) available. See DOI: 10.1039/d0ra06175a |
| This journal is © The Royal Society of Chemistry 2020 |

