 Open Access Article
Creative Commons Attribution 3.0 Unported Licence
Anomalous dynamics of water at the octopeptide lanreotide surface
Florian
Pinzan
,
Franck
Artzner
and
Aziz
Ghoufi
 *
*
Institut de Physique de Rennes, UMR CNRS 6251, Université Rennes 1, 263 Avenue du Général Leclerc, 35042 Rennes, France. E-mail: aziz.ghoufi@univ-rennes1.fr
First published on 14th September 2020
Abstract
This work reports the study of water dynamics close to the cyclic octapeptide lanreotide from atomistic simulations of hydrated lanreotide, a cyclic octapeptide. Calculation of the hydrogen bonds between water molecules allows mapping of the hydrophilic regions of lanreotide. Whereas a super-diffusivity of the interfacial water molecules is established, a slowdown in rotational dynamics is observed, involving a decoupling between both processes. Acceleration in translation dynamics is connected to the hopping process between hydrophilic zones. Microscopically, this is correlated with the weakness of the interfacial hydrogen bonding network due to a hydrophobic interface at the origin of the interfacial sliding of water molecules. Heterogeneous rotational dynamics of water molecules close the lanreotide surface is evidenced and connected to heterogeneous hydration.
1 Introduction
It is now well established that molecular self-assembly is ruled by weak interactions such hydrogen bonds, hydrophobic effects, electrostatic and van der Waals interactions or π–π interactions.1–5 However, the molecular mechanisms governing biostructures such as membranes, peptide nanotubes,1,6–8 amyloid-related diseases or actin filaments need still to be elucidated. It is then fundamental to gain knowledge of the molecular mechanisms ruling self-assembly processes in order to control them.6–9 Much research has thus been devoted to the mechanisms of molecular self-assembly. Peptides have been extensively studied given their simplicity and their versatility to identify specific interactions.2,10–12 It has been established that molecular self-assembly is connected to the geometrical complementarity between chemical functions and to the van der Waals non-covalent interactions.Molecular self-assembly is mainly controlled by an enthalpic contribution related to the strength of the interactions between monomers, i.e. electrostatic and van der Waals interactions.13,14 The entropic contribution must also be considered to get a full thermodynamic picture of self-assembly. The first entropic contribution is the loss of degrees of freedom of the monomer during self-assembly, contributing to unfavorable energetics.15,16 Another factor is the dehydration of monomers during self-association, involving a positive entropic contribution. Therefore, the role of interfacial water, i.e. the water molecules located in the first and second hydration shells of the monomer, is crucial in the self-assembly process.17–19 To quantify this hydrated state, a local vision of the interfacial hydration of the monomer is necessary. Many experimental and numerical studies have thus been devoted to the hydration of biological molecules such as peptides. It has been shown that the layer of water molecules surrounding a molecule such as DNA plays an important role in both preserving the structure and ensuring its proper biochemical function.20,21 The hydration layer further protects the structure; moreover, it is involved both in processing the recognition and binding of restriction enzymes, and in DNA–ligand interactions including protein binding.22 Such processes require significant displacement and rearrangement of the water molecules surrounding DNA. A description at the atomic scale of interfacial hydration can then provide insight into the still open and important issue of association, where water-related interactions could dominate the thermodynamic signature of the formation of a dimer.
Among materials that self-organize, the cyclic octapeptide lanreotide shows spectacular assembly because it self-associates into nanotubes in the presence of water.23 Lanreotide is a synthetic therapeutic peptide used mainly in the treatment of acromegaly.6,8,23 Recently, the peptide packing in these self-assemblies has been determined9,23 and numerous levels of organization have been determined; from lowest to highest: (1) dimers of peptides, (2) amyloid filaments generated by the packing of peptide dimers, (3) nanotubes generated by the lateral packing of 26 filaments, and (4) the packing of nanotubes in a hexagonal lattice. All levels of packing organization are controlled by the formation of the dimer, which is the primitive brick ruled by the electrostatic and van der Waals interactions between two monomers. The hydration level of the monomer also plays an important role in self-assembly. Deep knowledge of the hydration of the monomer is therefore necessary to understand and control the highest level of organization. Up to now, experimental studies have been focussed on peptide–peptide interactions to elucidate the molecular mechanism controlling self-assembly, while the hydration state of lanreotide was never explored.
In this work we investigate the interfacial hydration level of a mutated lanreotide (L-diaminopropionic acid) [M-Lanr], described in Fig. 1a, by using molecular dynamics simulations, a relevant tool to explore the structure and dynamics of hydrated materials at the nanoscale.24–28 Local properties were computed to dynamically and structurally characterize the interfacial hydration state of M-Lanr. The outline of this paper is as follows. In Section 2, we present the potentials and computational details. The results and discussions are provided in Section 3. The main conclusions of this work are summarized in Section 4.
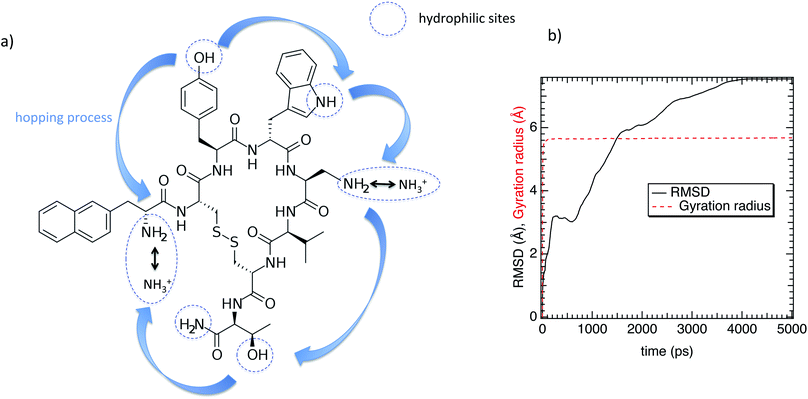 | ||
| Fig. 1 (a) Chemical structure of the lanreotide analogue (L-diaminopropionic acid). (b) Gyration radius and the RMSD as a function of time. | ||
2 Computational details
Positively charged M-Lanr (with total charge +2e) involves the presence of two anions to achieve electro-neutrality. In line with experiments, we opted for the acetate ion as a counterion.9,23 The AMBER29 model was used to build the force fields of M-Lanr and the acetate ion. In a recent study Man et al. showed that the AMBER force field could predict the structural properties of peptides in good agreement with experiments.30 Fluitt and de Pablo also identified the AMBERff99SB, AMBERff99SB*, and OPLS-AA force fields to be most suitable for studies of folding and aggregation of polypeptides.31 Water molecules were modeled by the rigid, non-polarizable TIP4P/2005 force field.32 This water model was considered as a robust model to quantitatively predict the physical properties, taking into account the hydrogen bonding network and accurately modeling the hydration of ions and small solutes.33–36 The intramolecular and intermolecular contributions were considered. The intramolecular potential is based on stretching, angle and dihedral potentials, while the intermolecular interactions were modeled from (i) the electrostatic forces between partial charges by means of the Ewald sum and (ii) the Lennard-Jones potential, allowing us to take into account the van der Waals interactions. Partial charges were calculated using the CHELPG approach (CHarges from ELectrostatic Potentials using a Grid-based method)37 from first-principles calculations using the 6-31G(d,p) Gaussian-type basis set. Let us note that lanreotide and the acetate ion were modeled by using the original AMBER force field and only the partial charges were re-calculated. The structure of M-Lanr was taken from ref. 38 from XRD measurements. Hydrogen atoms were added and the structure was optimized from the quantum calculation in line with the charge calculation.The electrostatic interactions were truncated at 12 Å and were calculated using the Ewald sum with a precision of 10−6, a convergence of 0.26506 and kmaxx = kmaxy = kmaxz = 38. Short range interactions were modeled by the Lennard-Jones potential using a cutoff of 12 Å. The simulation box was cubic and periodic boundary conditions were applied in the three directions. MD simulations were performed in the NpT statistical ensemble, such that N is the number of particles, T is the temperature and p is the pressure. Molecular dynamics simulations were performed at T = 300 K and p = 1 bar using a time step of 0.001 ps to sample 10 ns (acquisition & equilibration phases). All MD simulations were carried out using the DL_POLY package39 using a combination of the Velocity Verlet and the Nose–Hoover thermostat and barostat algorithms40,41 with relaxation times of 0.1 ps and 0.5 ps, respectively. The initial configuration was built by a random distribution of water in the presence of M-Lanr and acetate ions. To be in line with the experimental water fraction,9 11![[thin space (1/6-em)]](https://www.rsc.org/images/entities/char_2009.gif) 000 water molecules were considered in an initial cubic box with length (L) 70 Å.
000 water molecules were considered in an initial cubic box with length (L) 70 Å.
Regarding the internal structure of M-Lanr, the gyration radius and the asphericity were calculated. The shape of the macrocyclic molecule was estimated from the inertia tensor S.42 Diagonalization of S results in three eigenvalues, which sum to the mean-squared radius of gyration 〈Rg2〉, and the largest of which corresponds to an eigenvalue vector representing the long axis of the macrocycle. In Fig. 1b we report Rg as a function of time. As shown in Fig. 1b, Rg ∼ 5.4 Å with small fluctuations that suggest rigidity of the cavity. The Root Mean Square Displacement (RMSD) profile of M-Lanr was evaluated at the atomic scale to understand the overall stability. The conformational variation and flexibility of a structure is reflected by the root mean square deviation value, where a small fluctuation denotes fewer fluctuations. From Fig. 1b, the RMSD of M-Lanr deviated much more at the initial phase, as the flexible nature of the protein was higher.
3 Results and discussion
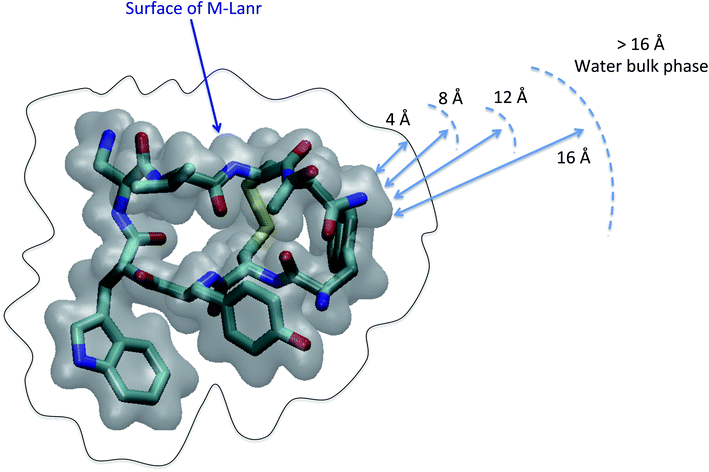
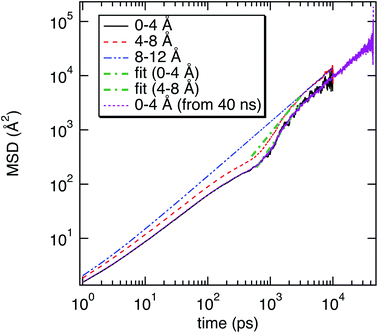
As illustrated in Fig. 2, the local properties were investigated by considering four layers of 4 Å around lanreotide, 0–4 Å, 4–8 Å, 8–12 Å, and 12–16 Å. Beyond 16 Å the bulk phase is recovered. The layers were calculated by considering the distance between each atom of lanreotide and the water molecules. This distance of 4.0 Å corresponds to the first hydration shell of M-Lanr. It was established from the calculation of the radial distribution function between the water molecules and the atoms of M-Lanr. Furthermore, as the radius of a water molecule is around 3 Å, to get a sufficient number of water molecules into the hydration shell we increased the upper limit to 8.0 Å. A distance of 3.0 Å was also considered as the distance of the first hydration shell. Nevertheless, distances smaller than 4.0 Å involved poor statistics, leading to strong fluctuations and noise in the calculations of local properties. The number of hydrogen bonds per water molecule (nHB) was managed by considering the geometrical criteria established by Chandler and Luzar,43,44 such that a hydrogen bond exists if the distance between the hydrogen and oxygen atoms of two molecules is smaller than 2.5 Å and if the distance between oxygen atoms is smaller than 3.5 Å. By considering these two distance criteria, the angle criterion corresponding to an angle between two O–H and O–O vectors smaller than 30° was fulfilled. In the bulk phase the TIP4P/2005 water model provides nHB of around 3.91, which is in line with a tetrahedral geometry.45 The local nHB values of water molecules are reported in Table 1. As shown in Table 1, close to the surface of M-Lanr, nHB falls to 3.47, breaking the tetrahedral structure. That is the result of the excluded volume due to the truncation of the hydration shell at the interface. Interestingly, nHB increases as water molecules move away from the M-Lanr surface to recover the bulk value, i.e. 3.91. A decrease in nHB indicates a less cohesive interfacial hydrogen bonding network, which could lead to an increase in the interfacial translational dynamics. Dynamics was then evaluated from the calculation of the mean square displacement (MSD) in the three shells: | (1) |
| MSD(t) = Dtα, | (2) |
| n HB | α 1 | α 2 | τ R (ps) | |
|---|---|---|---|---|
| 0–4 Å | 3.47 | 0.87 | 1.99 | 18.7 |
| 4–8 Å | 3.71 | 0.89 | 1.53 | 6.9 |
| 8–12 Å | 3.82 | 1.0 | 1.0 | 5.1 |
| 12–16 Å | 3.91 | 1.0 | 1.0 | 4.9 |
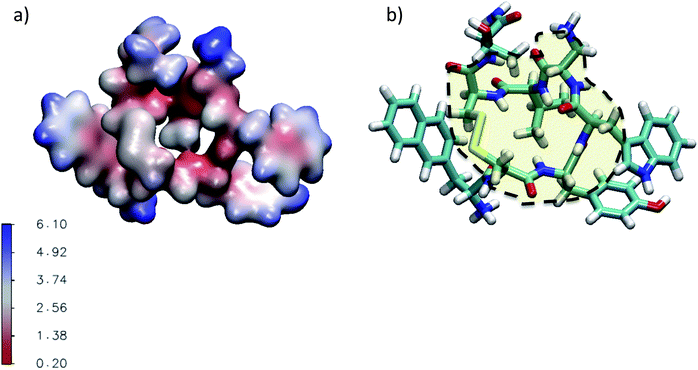 | ||
| Fig. 4 (a) Three dimensional representation of the average water number around the atoms of M-Lanr located at 4 Å. (b) Illustration of the hydrophobic cavity (yellow zone) limited by the dashed line. | ||
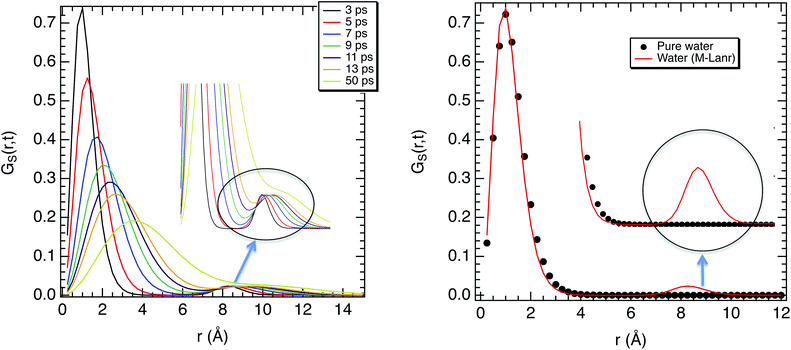
The super-diffusivity next to the M-Lanr surface could also be attributed to the heterogeneous structures in hydrogenated sites. Indeed, Fig. 1a shows different hydrogenated sites probably involved in the hopping process.51 Possible translational jumps can be evidenced by computing the self van Hove function (GS(r,t)),
 | (3) |
Fluctuations in HB number close to the interface can also be the origin of local anomalous diffusion. However, the standard deviation of nHB was found to be close to 0.02 with small fluctuations, in line with a hydrophobic surface stabilizing the structure.52 Indeed, the Root Mean Square Deviation (RMSD) between the structures obtained at t and the conformation at t = 0 was found to be tiny, close to 0.3 Å, suggesting a strong degree of rigidity of M-Lanr, probably due to the hydrophobic surface inducing a kind of folding. Furthermore, the “breathing” ability of the hydrophobic cavity has been evaluated by calculating the time evolution of its gyration radius. An average distance of 5.4 Å with a standard deviation of 0.7 Å was found, leading to evidence of low flexibility and weak structural fluctuations of the hydrophobic cavity.
To complete our study the rotational dynamics was investigated from the calculation of the relaxation time (τR) of water molecules as a function of their location with respect to the M-Lanr surface. τR was computed from  . C(t) was calculated as
 | (4) |
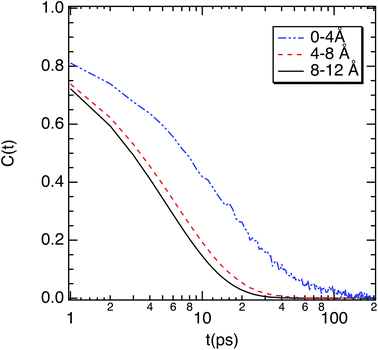 | ||
| Fig. 6 Correlation function (C(t)) of the dipole moment vector of water molecules as a function of their location with respect to the surface of M-Lanr. | ||
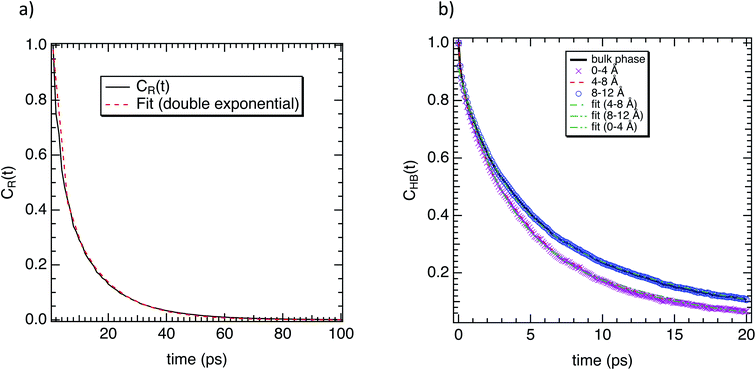
To complete our dynamical study, we consider the residence time of water molecules located in the interfacial region. The mean residence time is calculated from the correlation function CR(t), defined as
 | (5) |
Furthermore, we investigated the hydrogen-bond dynamics in the three shells by introducing the hydrogen-bond correlation function
 | (6) |
4 Concluding remarks
In this work, molecular dynamics simulations of a hydrated mutated lanreotide were carried out to dynamically and structurally characterize the hydration state of M-Lanr. Calculation of the number of hydrogen bonds (nHB) per water molecule allowed us to highlight a decrease in nHB, leading to weak hydration of M-Lanr and greater mobility of the interfacial water molecules.The translational dynamics of water was also studied and anomalous dynamics was found close to the water/M-Lanr interface. Indeed, a weak sub-diffusive regime at a short time, followed by super-diffusion, has been established. The sub-diffusive regime is the result of a confinement effect close to the surface, leading to a slowdown in the translational mobility given the constricted region at the nanoscale involving excluded volume and then a breaking of HB of the interfacial water molecules. The super-diffusive process is due to (i) the decrease in nHB between the water molecules and between water and M-Lanr (due to the hydrophobic nature of the M-Lanr surface), leading to the sliding of water molecules along its surface. Moreover, the decrease in nHB per water molecule involves a less cohesive interfacial hydrogen bonding network, leading to an increase in translational degrees of freedom, and (ii) a hopping process between hydrogenated sites speeds up the translational dynamics.
Eventually, the rotational dynamics was also explored and a decoupling with translational dynamics has been exhibited. Indeed, an increase in the relaxation time of the interfacial water molecules in relation to the water in the bulk phase has been highlighted. That was correlated with a decrease in the exchange of HB between water molecules given the decrease in the interfacial water number and the heterogeneous hydration. This work paves the way for studies of the dimerization process and formation of M-Lanr nanotubes to highlight the role of water in the self-assembly process.
Conflicts of interest
There are no conflicts to declare.Acknowledgements
The authors are grateful to the CNRS for its financial support (PICS-Waterloo).References
- G. Whitesides, J. Mathias and C. Seto, Science, 1991, 254, 1312 CrossRef CAS PubMed.
- M. Caplan, P. Moore, S. Zhang, R. Kamm and D. Lauffenburger, Biomacromolecules, 2000, 1, 627 CrossRef CAS PubMed.
- M. Ma, Y. Kuang, Y. Gao, Y. Zhang, P. Gao and B. Xu, J. Am. Chem. Soc., 2010, 132, 2719 CrossRef CAS.
- S. H. Chong and S. Ham, Proc. Natl. Acad. Sci. U. S. A., 2012, 109, 7636 CrossRef CAS.
- M. Mateescu, P. Ispas-Szabo and E. Assaad, Controlled Drug Delivery – The Role of Self-assembling Multi-task Excipients, Elsevier, 2015 Search PubMed.
- C. Valéry, F. Artzner and M. Paternostre, Soft Matter, 2011, 7, 9583 RSC.
- J.-W. Yoo, D. Irvine, D. Discher and S. Mitragotri, Nat. Rev. Drug Discovery, 2011, 10, 521 CrossRef CAS.
- I. Hamley, Angew. Chem., Int. Ed., 2014, 53, 6866 CrossRef CAS.
- E. Pouget, N. Fay, E. Dujardin, N. Jamin, P. Berthault, L. Perrin, A. Pandit, T. Rose, C. Valéry, D. Thomas, M. Paternostre and F. Artzner, J. Am. Chem. Soc., 2010, 132, 4230 CrossRef CAS.
- E. Gazit, Chem. Soc. Rev., 2007, 36, 1263 RSC.
- F. Heitz, M. C. Morris and G. Divita, Br. J. Pharmacol., 2009, 157, 195 CrossRef CAS.
- H. Cui, M. Webber and S. Stupp, Pept. Sci., 2010, 94, 1 CrossRef CAS.
- D. Chandler, Nature, 2005, 437, 640 CrossRef CAS.
- J. Wang, K. Liu, R. Xing and X. Yan, Chem. Soc. Rev., 2016, 45, 5589 RSC.
- M. Bodnarchuk, M. V. Kovalenko, W. Heiss and D. Talapin, J. Am. Chem. Soc., 2010, 132, 11967 CrossRef CAS PubMed.
- D. Packwood, P. Han and T. Hitosugi, Nat. Commun., 2017, 8, 14463 CrossRef CAS.
- T. Li, A. Hassanali, Y.-T. Kao, D. Zhong and S.-J. Singer, J. Phys. Chem. B, 2007, 129, 3376 CAS.
- F. Sterpone, G. Stirnemann and D. Laage, J. Am. Chem. Soc., 2012, 134, 4116 CrossRef CAS PubMed.
- Y. Kuo and Y. Chiang, ACS Cent. Sci., 2018, 4, 645 CrossRef CAS.
- E. Meyer, Protein Sci., 1992, 1, 1543 CrossRef CAS.
- P. Ball, Chem. Rev., 2008, 108, 74 CrossRef CAS PubMed.
- P. L. Privalov and C. Crane-Robinson, Eur. Biophys. J., 2017, 46, 203 CrossRef CAS.
- C. Valery, M. Paternostre, B. Robert, T. G.-K. T. Narayanan, J. Dedieu, G. Keller, M. Torres, R. Cherif-Cheikh, P. Calvo and F. Artzner, Proc. Natl. Acad. Sci. U. S. A., 2003, 100, 10258 CrossRef CAS.
- R. Guégan, D. Morineau and C. A. Simionesco, J. Chem. Phys., 2005, 317, 236 Search PubMed.
- N. Giovambattista, P. Debenedetti and P. Rossky, J. Phys. Chem. C, 2007, 111, 1323 CrossRef CAS.
- B. Corry, J. Phys. Chem. B, 2008, 112, 1427 CrossRef CAS PubMed.
- T.-A. Beu, J. Chem. Phys., 2011, 135, 044516 CrossRef.
- J. Hassan, G. Diamantopoulos, L. Gkoura, M. Karagianni, S. Alhassan, S. Kumar, M. Katsiotis, T. Karagiannis, M. Fardis, N. Panopoulos, H. Kim, M. Beazi-Katsioti and G. Papavassiliou, J. Phys. Chem. C, 2018, 122, 10600 CrossRef CAS.
- W. Cornell, P. Cieplak, C. Bayly, I. Gloud, K. Merz, D. Fergusson, D. Spellmeyer, T. Fox, J. Caldwell and P. Kollman, J. Am. Chem. Soc., 1995, 117, 5179 CrossRef CAS.
- V. H. Man, X. He, P. Derreumaux, B. Ji, X.-Q. Xie, P. H. Nguyen and J. Wang, J. Chem. Theory Comput., 2019, 15, 1440 CrossRef CAS PubMed.
- A. Fluitt and J. de Pablo, Biophys. J., 2015, 109, 1009 CrossRef CAS PubMed.
- J. Abascal and C. Vega, J. Chem. Phys., 2005, 123, 234505 CrossRef CAS PubMed.
- H. Zhu, A. Ghoufi, A. Szymczyk, B. Belannec and D. Morineau, Phys. Rev. Lett., 2012, 109, 107801 CrossRef CAS PubMed.
- R. Renou, A. Ghoufi, A. Szymczyk, H. Zhu, J.-C. Neyt and P. Malfreyt, J. Phys. Chem. C, 2013, 117, 11017 CrossRef CAS.
- M. Ding, A. Szymczyk, F. Goujon, A. Soldera and A. Ghoufi, J. Membr. Sci., 2014, 458, 236 CrossRef CAS.
- M. Ding, A. Szymczyk and A. Ghoufi, Desalination, 2015, 368, 76 CrossRef CAS.
- C. Breneman and K. Wiberg, J. Comput. Chem., 1990, 11, 361 CrossRef CAS.
- C. Tarabout, PhD Thesis, Ecole doctorale Sciences de la matière, university Rennes 1, 2010.
- I. Todorov, W. Smith, K. Trachenko and M. Dove, J. Mater. Chem., 2006, 16, 1911 RSC.
- S. Nose, J. Chem. Phys., 1984, 81, 511 CrossRef CAS.
- W. Hoover, Phys. Rev. A, 1985, 31, 1695 CrossRef PubMed.
- A. Mendes, C. Bonal, N. Morel-Desrosier, J. Morel and P. Malfreyt, J. Phys. Chem. B, 2002, 106, 4516 CrossRef CAS.
- A. Luzar and D. Chandler, Phys. Rev. Lett., 1996, 76, 928 CrossRef CAS PubMed.
- A. Ghoufi and P. M. F. Artzner, J. Phys. Chem. B, 2016, 120, 793 CrossRef CAS PubMed.
- J. R. Errington and P. G. Debenedetti, Nature, 2001, 409, 318 CrossRef CAS.
- J.-P. Bouchaud and A. Georges, Phys. Rep., 1990, 195, 127 CrossRef.
- Q. Berrod, S. Hanot, A. Guillermo, S. Mossa and S. Lyonnard, Sci. Rep., 2017, 7, 8326 CrossRef.
- E. Flenner, J. Das, M. Rheninstadter and I. Kosztin, Phys. Rev. E, 2009, 79, 011907 CrossRef PubMed.
- A. Ghoufi, A. Szymczyk and P. Malfreyt, Sci. Rep., 2016, 6, 28518 CrossRef.
- R. Renou, A. Szymczyk and A. Ghoufi, J. Chem. Phys., 2014, 140, 044704 CrossRef.
- D. Zhong, S. K. Pal and A. H. Zewail, Chem. Phys. Lett., 2011, 503, 1 CrossRef CAS.
- M. M. Islam, K. Kobayashi, S.-I. Kidokoro and Y. Kuroda, FEBS J., 2019, 286, 4122 CrossRef CAS.
- F. Goujon, P. Malfreyt, J.-M. Simon, A. Boutin, B. Rousseau and A. Fuchs, J. Chem. Phys., 2004, 121, 12559 CrossRef CAS.
- C. J. Fecko, J. D. Eaves, J. J. Loparo, A. Tokmakoff and P. L. Geissler, Science, 2003, 301, 1698 CrossRef CAS.
| This journal is © The Royal Society of Chemistry 2020 |

