 Open Access Article
Adsorption and sensing of CO and NH3 on chemically modified graphene surfaces
A. Sahithi and
K. Sumithra *
*
Birla Institute of Technology and Science (BITS), Pilani, Hyderabad Campus, Shamirpet, Telangana state 500078, India. E-mail: sumithra@hyderabad.bits-pilani.ac.in
First published on 20th November 2020
Abstract
We have studied the electronic structure and adsorption characteristics of environmentally potent gaseous molecules like carbon monoxide (CO) and ammonia (NH3) on chemically modified surfaces of graphene, employing ab initio density functional methods. An insight into the changes made in the electronic band structure due to intrinsic and extrinsic doping and through a combined effect of both is discussed. With this regard, the adsorption of these gaseous moieties is investigated on substitutionally p- and n- doped graphene surfaces, doped with various mole fractions and having different configurational patterns on the surface. Even though the electronic properties are modified with various mole fractions of doping they do not show a methodical increase with the increase in the dopant concentration. This is attributed to the sub-lattice induced symmetry breaking for the dopant configurations where equivalent lattice sites are occupied on the surface. An appreciable band gap opening of around 0.63 eV is observed on doping, due to sub-lattice symmetry breaking. This is further improved on molecular doping, with CO and NH3, where an increase up to 0.83 eV is noted with adsorption of ammonia. While both the molecules are physisorbed on nitrogen doped surfaces, carbon monoxide is strongly physisorbed and ammonia molecules are chemisorbed on a few boron doped surfaces resulting in notable changes in the adsorption energy. Therefore, it is clear that changes in the transport properties can be brought about by adsorption of these molecules on such surfaces and this study clearly indicates the invaluable prospects of such doped surfaces as potential sensors for these molecules.
1 Introduction
Owing to its unique two dimensional structure, high surface to volume ratio, ultra-high mobility, conductivity and exceptional mechanical and electronic properties, graphene has attracted a great deal of attention in the recent years.1,2 Materials based on graphene are widely being tested and used in various fields ranging from optoelectronics to hydrogen storage.2–4 As graphene based electronic devices have the disadvantage of being a zero band gap semi-metallic conductor, a lot of research, both experimental5 and theoretical6–8 is dedicated to modulate or engineer its band gap, to change it into the semi-conducting regime so as to tailor its optoelectronic properties. The most important ways to change the electronic band gap are, intrinsically doping the graphene7–10 with p- and n-type dopants and extrinsically by adsorbing various molecular species on its surface.11–14 One of the most important way to improve the sensing property of graphene surfaces has been established as the introduction of foreign atoms or dopants on the graphene layer.11–15 It is well established that pristine graphene is insensitive or chemically inert to the presence of almost all environmental gaseous molecules.16,17 Therefore there is a lot of interest on adsorption on doped graphene and their application for use as sensors for gaseous species.11–15,18,19Some of the previous literature show that the interaction of the graphene with adsorbed gaseous species can drastically alter the electronic properties and therefore can be made use of, in the design of ultra-sensitive gas sensors.18,21 The fact that sensors based on graphene can be used even for sensing individual gas molecules is already established through some experiments,15 as these surfaces have high sensitivity to chemical doping and show remarkable fluctuations in conductivity in the presence of gaseous molecules.18 This invaluable result has also been supported theoretically by Wehling et al.21 Such adsorbate/adsorbent systems are reported to show changes in the transport properties initiated by controlled surface adsorption of gaseous species.22 Majority of these adsorption studies deal with strong chemisorption on metal doped or transition metal doped graphene23–26 which deal with very high adsorption energy as anticipated. This has been established by few of the previous adsorption studies of gaseous molecules like CO, NH3, O2, NO2, O3, SO2, SO3 etc on doped and co-doped graphene surfaces.23–28 Most of these studies show strong chemisorptive behaviour, where the entire electronic properties of graphene gets altered. However, a semi-metal doped with a transition metal or a metal is expected to remain metallic and will not be suitable for use in semi-conductor based sensing devices. Therefore the major interest is now is to modulate the band gap of graphene through doping and molecular adsorption so as to improve its selectivity and sensitivity even with traces of adsorbates. It has been shown by a recent theoretical investigation7 that the band gap of graphene can be opened up by substitutional doping, by replacing carbon atoms with boron or nitrogen, thus inducing p- type or n- type semi-conducting characteristics. The type and the density of charge carriers can also be modulated by doping at different sites with different mole fractions.7,8
The previous adsorption studies on doped graphene surfaces focus only on surfaces with a single dopant28 and also mainly on transition metal doped surfaces23–26 our major interest in the current work involve the study of molecular adsorption on graphene surfaces doped with boron and nitrogen, with varied concentrations of the dopants. In particular, the major objectives deal not only with the electronic structure alterations with increased dopant concentrations but also with the different configurational patterns, on which adsorptions of CO and NH3 are considered. It is of interest to explore if the chemically modified graphene can serve as sensors for the toxic environmental gaseous species like CO and NH3. It was shown in one of our previous investigations that boron doped SWCNT can act as a potential sensor for gases like NH3.20
Even though there are a few adsorption studies on singly doped surfaces, the aspect of adsorption onto the surfaces with different mole fractions of dopants and also with varied configurations are not yet explored, making our study distinctive and relevant. It is of interest to have the band gap of the semi-metal graphene changed to semi-conducting regime and the study may open up its potential applications in new technologies in nanoscale electronic devices. Such doped surfaces of graphene will have an additional advantage over the conventional indirect band gap semi-conductor silicon of being a direct band gap semi-conductor. Therefore, the study on chemically modified graphene and molecular adsorptions on it are extremely interesting and pave ways for creating direct band materials for applications in optoelectronic devices. Moreover, the study of adsorption of the potent gaseous molecules like carbon monoxide and ammonia on such surfaces where the transport properties can be governed, may find application as potential sensors for these molecules.
2 Computational methodology
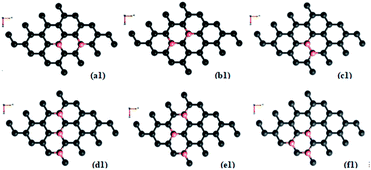
To study the adsorption characteristics of the gaseous molecules, we have made use of the first principles density functional calculations, employing periodic boundary conditions. All the density functional theory (DFT) calculations, geometry optimizations and the electronic structure calculations have been performed using the Vienna ab initio simulation package (Vasp)29,30 as integrated in the MedeA® computational environment31 with the projector augmented wave (PAW) basis sets30 and periodic boundary condition. The generalized gradient approximation (GGA) with the Perdew–Burke–Ernzerhof (PBE)29,32 exchange-correlation functional is used. The kinetic energy cutoff of the plane wave expansion is of 420 eV to represent the wave function and for the charge density with a convergence criterion of 0.01 eV −1 is kept throughout the calculation.Each simulated system consists of a 4 × 4 graphene supercell (32 carbon atoms) representing an isolated graphene sheet for which different doping concentrations and configurations are considered. In the case of a singly doped graphene sheet, a boron atom or nitrogen has substituted a carbon atom. The respective concentration of dopants when one carbon atom is substituted is 3.12%. Furthermore, increased concentrations of the dopants are also considered where the different arrangements of dopants yielded different surface configurations as listed out in Fig. 1. The supercell is extended into z in the conventional direction from the graphene surface with a lattice parameter of 10 Å along z-axis to avoid an image interaction between neighbouring graphene layers. The Brillouin zone is analysed using the Monkhorst–Pack k-point grid and the Methfessel–Paxton 0.02 eV smearing zone with the geometrical structure optimization and automated measurement, which is checked to provide converged results for all measured properties. We use a 9 × 9 × 1 Monkhorst–Pack33 array for measuring the energy band and 0.02 eV for Gaussian smearing.
For the adsorption studies we construct a cubic supercell of length 10 Å with a single adsorbate molecule inside and have implemented the spin-polarized DFT calculation with the same force and energy convergence of 0.01 eV Å−1 precision to the adsorption systems, and only the Gamma point is sampled in its Brillouin zone. Adsorption of a single molecule of CO and NH3 are considered on the different patterns where the most important physical quantity to define the strength of adsorption interactions is the binding or adsorption energy Ead. The adsorption energy can be calculated for single gas molecule adsorption on doped graphene as in eqn (1)
| Ead = E(molecule–graphene complex) − (Esurface + Egas molecule) | (1) |
3 Results and discussion
3.1. Boron and nitrogen doped graphene
Doping with boron and nitrogen is considered as the most appropriate for graphene as the two dimensional structure is least deviated with the inclusion of similarly sized dopants.20 The boron carbon distance is found to be 1.42 Å and after optimization it has increased in the range of 1.45–1.48 Å and the C–C bond length in the vicinity of doping is 1.45 Å and 1.39 Å away from it. For the nitrogen doped systems, no significant changes are observed in the bond length as the radius of carbon is 67 pm and that of nitrogen is 56 pm and the two dimensional structure is least disturbed except for slight changes in the adjacent bond lengths. This shows that the basic two dimensional structure of the surface remain largely unaffected with a slight change in the lattice constant. A system of 4 × 4 supercell, with 32 carbon atoms, is constructed with the doping of impurities like nitrogen and boron to study the adsorption characteristics of common pollutant gases like CO and NH3 on such a surface. We study three different concentrations of doping, 3.12, 6.25 and 9.37% and seven different doping patterns, each for boron and nitrogen doped graphene. These patterns are defined, except for the single boron doped, in Fig. 1 for 6.25 and 9.37% dopant concentrations of boron and similar patterns are studied for different nitrogen doped surfaces.In order to understand the effect of p- and n- type doping on the semi-metallic, Dirac cone material graphene, we have initially calculated the band structure of these various systems. The electronic band structure diagrams for all boron doped systems corresponding to various configurations and different doping concentrations, from a1 to f1 are given in Fig. 2 and the corresponding band diagrams for the nitrogen doped systems are given in Fig. 3.
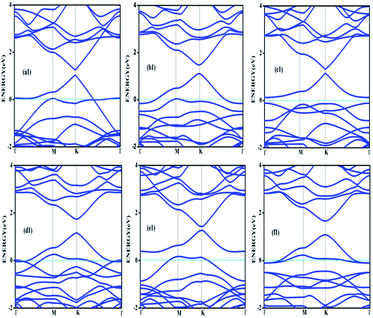 | ||
| Fig. 2 Band structures corresponding to 6.25% (a1, b1 and c1) and 9.37% (d1, e1 and f1) boron doped graphene surfaces. Fermi level is shown by the cyan line. | ||
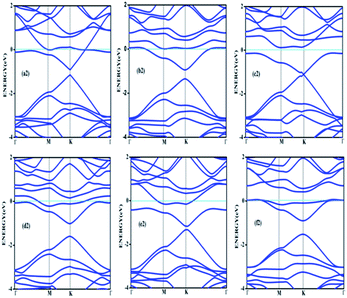 | ||
| Fig. 3 Band structures corresponding to 6.25% (a2, b2 and c2) and 9.37% (d2, e2 and f2) nitrogen doped graphene. | ||
The doping atom when enters in to the lattice, make covalent bonds with the carbon atom and change the structure of graphene. This would largely modify the electronic structure of graphene and suppress the density of states near the Fermi level, thus a gap is opened between the valence and the conduction bands. To confirm the dependability of our procedure, we have also looked into the Fermi level shift of about 0.7–0.8 eV in the band structure, below the Dirac point in the case of boron-doped systems. In all the above cases with p-type doping, the Fermi level shifts below the Dirac point since boron is electron deficient. Similar studies are carried out with nitrogen doped graphene for various doping concentrations where the Dirac point is found to be about 0.9 eV below the Fermi level as expected due to n- type doping. It is interesting to note how the electronic band gaps are getting modified with the doping. The electronic band gaps of graphene, doped with boron and nitrogen, for the various configurations are compiled in Table 1. It is interesting to see that the band gaps for certain surface configurations are improved drastically compared to the un-doped (0 eV) or singly doped surface (0.14 eV for boron doped and 0.21 eV for nitrogen doped graphene). Our values coincide with that of previous investigation of single boron doped graphene where the band gap is 0.14 eV (ref. 7) and for single nitrogen doped with the gap of 0.21 eV.35 In addition to the band gap, the boron-carbon distance of 1.48 Å and the charge transfer of 1.85e are also coinciding with the previous investigations.7 The charge transfer of 1.85e is attributed to the hole creation and associated mobility through hole transport due to the electron deficiency.
Similarly a charge transfer of −1.15e is observed for graphene with singly doped nitrogen which coincide with the values of −1.16 in the literature and is attributed to the electronic transport.7,35 It is seen that for the doping patterns labelled b1 and b2, with two boron and two nitrogen, the band gaps are 0.37 and 0.4 eV respectively. On further doping, with 9.37%, the gaps are further increased to 0.57 and 0.58 eV for the surface configurations mentioned in d1 and f1. Similar changes have been observed also for nitrogen doped configuration d2 and f2 which yield band gaps of 0.57 and 0.59 eV respectively. It is also interesting to see that the linear dispersion near the Dirac point remain almost unaffected for single doped graphene and affected moderately for 6.25 and 9.37% of doping. For certain configurations where the atoms are placed adjacent, i.e. when the dopant atoms are placed at alternate sub-lattice positions as in c2 configuration, the band gap is becoming zero in the case of nitrogen doped system and reduce to smaller values in the case of boron doped surfaces. Such effects are due to the introduction of symmetry by the dopants in the sub-lattices. Similar effects were also observed by Rani et al.7 in their studies on doped systems.
Our band gaps for 6.24% doping of boron are checked with the available literature with 6% dopant concentration calculated with a 6 × 6 supercell.7 The band gap corresponding to configurations a1, b1 and c1 are 0.21, 0.37 and 0.15 eV and the corresponding values found in the matching configurations in the literature are 0.19, 0.43 and 0.17 eV respectively. The results are almost matching and minor changes can be attributed to supercell size effects. From our results it is clear that the type of configuration or the isomer plays a part in the opening of the band gap in addition to the increased dopant concentration. It is seen that for similar type of doping as in b1, d1 and f1, the dopants are placed at the same sub-lattice positions. This confirms that the origin of the band gap is through the phenomena of symmetry breaking. This remarkable band gap opening which turns graphene into a semi-conductor is achieved via sub-lattice induced symmetry breaking.
Similar sub-lattice induced symmetry breaking leading to band gap opening has been reported in few earlier studies.7,36 In the case of configurations where the dopants are placed at the non-equivalent sites, no appreciable changes in the band gap are observed, as in configurations a, c and e. Similar patterns of doping were also studied by Rani et al.7 in their study on doped graphene surfaces and our band gap calculations yielded similar values. After the different doping studies are carried with different concentrations and different models of doping, the adsorption of pollutants gases CO and NH3 on these graphene surfaces and different electronic as well as adsorption characteristics are analyzed, which lead to interesting results for the use of such surfaces for sensor application.
3.2. Adsorption on boron- doped and nitrogen doped surfaces
Even though the adsorption of various gaseous species on the surface of graphene18 doped with single boron and nitrogen were investigated28 previously, there have been no attempts to study the adsorption phenomena on graphene surfaces with various levels of doping concentration and also with different patterns/configurations of doping. In addition to the adsorption on graphene with single boron (3.14%), we have investigated the adsorption characteristics on surfaces having dopant concentrations of 6.25% and 9.37%. Moreover, with each of these dopant concentrations, adsorption studies are carried out on various arrangements of the dopant atoms, making different patterns as mentioned in Fig. 1 and the results are presented below. The adsorption energy, closest distance of the adsorbate gas molecule and the band gaps are presented in Table 2 for the adsorption on boron doped systems.| Configuration | Adsorption energy Eads (eV) | Distance (Å) | Band gap (eV) |
|---|---|---|---|
| 1Boron doped (1B) | — | — | 0.14 |
| CO/1B | −0.105 | 3.42 | 0.18 |
| NH3/1B | −0.259 | 3.22 | 0.24 |
| a1 | — | — | 0.21 |
| CO/a1 | −0.025 | 3.59 | 0.24 |
| NH3/a1 | −0.561 | 1.67 | 0.54 |
| b1 | — | — | 0.37 |
| CO/b1 | −0.031 | 3.75 | 0.39 |
| NH3/b1 | −0.033 | 3.90 | 0.39 |
| c1 | — | — | 0.16 |
| CO/c1 | −0.028 | 4.03 | 0.16 |
| NH3/c1 | −1.021 | 1.646 | 0.26 |
| d1 | — | — | 0.57 |
| CO/d1 | −0.309 | 3.06 | 0.64 |
| NH3/d1 | −0.330 | 3.58 | 0.65 |
| e1 | — | — | 0.16 |
| CO/e1 | −0.013 | 4.66 | 0.16 |
| NH3/e1 | −0.079 | 3.35 | 0.15 |
| f1 | — | — | 0.58 |
| CO/f1 | −0.291 | 3.14 | 0.63 |
| NH3/f1 | −1.047 | 1.64 | 0.83 |
As mentioned previously, the configurations two boron doped b1 (6.25%) and three boron doped d1 and f1 (9.37%) show more band gap opening compared to the other configurations because of sub-lattice symmetry breaking. Regarding adsorption of CO on all the boron doped surfaces, the results show almost a similar trend. Though it is a fascinating molecule with both electron donating and accepting centres in the different regions, as a whole it is acting like a π-acceptor while the surface is already deficient in electrons with doped boron atoms. Due to this the attraction towards the surface is less and therefore, results in negligible adsorption energies. All the distances are found to be more than 3 Å and low adsorption energies indicate that the adsorption falls in the range of physisorption. This physisorption does not influence the electronic properties much, as is evidenced by the band gaps shown in Table 2. There are no significant changes in the band gaps which remain almost the same as that of the doped, adsorbent surface. This indicates that a π-acceptor like CO does not have any effect with respect the extrinsic doping, in terms of adsorption. However, it is clear that there are changes in the adsorption energy of the three boron doped (9.37%) cases d1 and f1 where the symmetry breaking is already present without the adsorbate. Even though it is not adequate enough to classify it as chemisorption and since it is difficult to classify the absolutely sharp dissimilarity between the intermediary cases of adsorption, one may classify cases with favourable adsorption energy greater than 0.2 eV as a stronger physisorption. Such cases are well known in the literature, for example, with the interactions as in strong hydrogen bonds. The somewhat stronger physisorptions mentioned here, CO/d1 and CO/f1 show closer distances to the surface of the order of about 3 Å compared to the adsorptions on other surfaces. For all these cases of physisorptions we have found only negligible charge transfer. However, this way of extrinsic doping of the already, intrinsically doped surface by means of adsorption, open up the band gap further to a negligible extent of 0.05–0.07 eV and therefore, is not promising. This shows that extrinsic doping fails for cases where the adsorbate has very weak interactions with the surface. In all other cases where the adsorbent symmetry is not broken due to occupation of the dopant in dissimilar sites, like in, CO/a1, CO/c1, CO/e1 etc. the band gap remains unaltered as that of the adsorbent surface.
On the other hand, the behaviour of NH3 near some of the adsorbent surfaces shows a stronger impact where clear electronic changes, as a result of extrinsic doping by means of adsorption are noticeable. It is interesting to see that for adsorption on certain configurations, considerable changes in the adsorption energy, in addition to meaningful adsorbate–adsorbent distances, corresponding to the chemisorptive behaviour are visible. In addition, the effects are also visible in the appreciable band gap opening on adsorption. For example, for ammonia adsorption on the surface configuration labelled a1, the adsorption energy is −0.561 eV, with the distance of 1.67 Å where the band gap is also increased appreciably from 0.24 eV to 0.56 eV. The charge transfer is found to be about 0.15e from ammonia to the surface which is electron deficient due to doping of boron. The appreciable opening of the gap from 0.24 to 0.54 eV is solely as a result of the adsorption phenomena where a bond is also formed between the nitrogen of ammonia and one of the boron atoms. In the case of NH3/a1, the band gap is solely due to the symmetry breaking as a result of adsorption on one of the borons on the surface. Different perspectives of adsorption are given in the optimized geometries given in Fig. 4. The bond formation is also visible in the figure.
The band diagram corresponding to this adsorption, shown in Fig. 5 shows appreciable band gap opening from 0.24 of the doped surface to 0.56 eV. The dispersion near the Dirac point is significantly affected due to the perturbations caused due to adsorption. Similar adsorption is also found on NH3 on surface configuration specified by c1. The configuration c1 by itself is one of the most undesirable adsorbent surfaces where the dopants are placed in an adjacent manner. While in the case of a1, the boron atoms are separated by two carbons which allows certain degree of distribution of electron deficiency, such a distribution is absent in the isomer c1 where it gets accumulated thereby forcing the adsorption. The band gap opening is also not appreciable in this case with 0.1 eV difference with the adsorbate surface. Therefore, here the adsorption is the sole effect and the adsorption cannot induce any appreciable change in the band gap as seen in the case of NH3/a1.
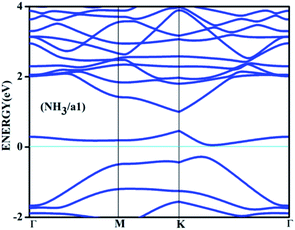 | ||
| Fig. 5 The band structure for the adsorbed complex corresponding to the adsorption of ammonia on a1 surface. | ||
It is interesting to note that the similar effect is not seen in the case of CO/a1 or CO/c1 adsorptions. The reason is that the electron donating capacity of CO from the slightly electron rich carbon is negligible compared to that of the nitrogen holding a lone pair in the case of ammonia. This again shows that the extrinsic doping is effective in causing the band gap opening only in the case of appropriate adsorbate molecules. It is also worthwhile to note that the band gap opening can be made of use of in its application for sensing the ammonia molecule with such a surface where the dopants are following a certain pattern.
Amongst the adsorptions on chemically/intrinsically modified graphene considered, the most prominent one is ammonia adsorption on boron doped surface with 9.37% dopant concentration and the boron atoms arranged in an alternate way as in NH3/f1. The adsorption caused a favourable energy of −1.047 eV with a distance of 1.64 Å between nitrogen of NH3 and the boron on the surface. The adsorption energy value and the adsorbate–adsorbent distance correspond to chemisorption. This moderate chemisorption, in comparison with the stronger adsorptions on metal or transition metal doped surfaces is an added advantage for its prospective applications for sensing the gas molecule as it can also be desorbed under milder conditions. The electronic band gap is found to be increased from the pure surface value of 0.58 to 0.83 eV. This surface configuration f1, is one where we can see symmetry breaking due to boron substitution on dissimilar sites. Therefore, the band gap opening of an additional 0.25 eV can be attributed to additional symmetry breaking due to the formation of a favourable adsorption complex. The bond distances are matching with the classical donor–acceptor bonds B–N dative bonds. The charge transfer is found to be about 0.17e from nitrogen in this case. The geometry optimized structure is shown in Fig. 6 and the corresponding band diagram and the density of states are shown in Fig. 7.
 | ||
| Fig. 6 Top and side view of 3 borons doped oppositely corresponding to the configuration f1 on a 4 × 4 supercell of graphene with NH3 as adsorbate. | ||
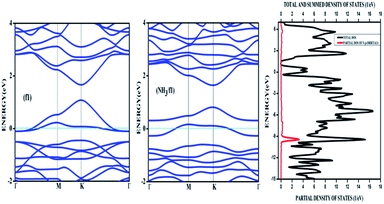 | ||
| Fig. 7 The band diagram corresponding to NH3 adsorption on the configuration f1 of three boron doped graphene and the corresponding density of states. | ||
The Fig. 7 clearly shows drastic change in the band gap on adsorption while the shifting of the Fermi level with respect to the Dirac point is affected by an amount of about 0.25 eV. This shows the additional effects due to the lone pair of electrons on nitrogen of the adsorbate. The band gap increase is also visible in the corresponding density of states (DOS) plot. Similar to the bare boron doped systems, we have also seen almost the same trend in band gaps in n-type doped surfaces with nitrogen, except that the Fermi level is shifted above the Dirac point because of the n-type doping. The similar kind of systems where the doped atoms occupy the same sub lattice positions, b2, d2 and f2 showed considerable band gap opening due to symmetry breaking of the sub-lattice. The results presented in Table 1 show clear change from the semi-metal graphene to a semi-conducting surface. The adsorption energy, distances and the band gaps summarized in Table 3 show that the molecules, CO and NH3 have little or no impact on the electronic structure on the n-type doped surfaces and that they are only feebly adsorbed on to the respective surfaces. On the other hand, favourable stronger physisorption for CO on the surfaces having dissimilar substitutions, namely, CO/d1 and CO/f1 and the chemisorption of NH3 on certain configurations (NH3/a1, NH3/f1) are clearly seen with the boron doped surfaces. Nevertheless, such stronger physisorption and chemisorption are missing for these two adsorbates, CO and NH3 on nitrogen doped surfaces. It is also worthwhile to note that stronger physisorption which was present for CO adsorption on certain p-type configurations are also absent in the case of CO adsorption on nitrogen doped surfaces. This is due to the electron rich surface in the case of n-doped cases. The reasons for the behaviour in n-doped surfaces can be well explained based on the electron transport present in these systems in contrast to the hole transport in boron doped systems. The pentavalent dopant makes four covalent bonds with the carbon atoms, leaving an electron free for transport. For obvious reasons, as the molecules CO and NH3 are equipped with lone pairs of electrons are not attracted to the electron rich surface. Therefore, with distances above 3.25 Å, these adsorbate molecules physisorb weakly onto such surfaces.
| Configuration | Adsorption energy Eads (eV) | Distance (Å) | Band gap (eV) |
|---|---|---|---|
| 1Boron doped (1B) | — | — | 0.14 |
| CO/1B | −0.105 | 3.42 | 0.18 |
| NH3/1B | −0.259 | 3.22 | 0.24 |
| a1 | — | — | 0.21 |
| CO/a1 | −0.025 | 3.59 | 0.24 |
| NH3/a1 | −0.561 | 1.67 | 0.54 |
| b1 | — | — | 0.37 |
| CO/b1 | −0.031 | 3.75 | 0.39 |
| NH3/b1 | −0.033 | 3.90 | 0.39 |
| c1 | — | — | 0.16 |
| CO/c1 | −0.028 | 4.03 | 0.16 |
| NH3/c1 | −1.021 | 1.646 | 0.26 |
| d1 | — | — | 0.57 |
| CO/d1 | −0.309 | 3.06 | 0.64 |
| NH3/d1 | −0.330 | 3.58 | 0.65 |
| e1 | — | — | 0.16 |
| CO/e1 | −0.013 | 4.66 | 0.16 |
| NH3/e1 | −0.079 | 3.35 | 0.15 |
| f1 | — | — | 0.58 |
| CO/f1 | −0.291 | 3.14 | 0.63 |
| NH3/f1 | −1.047 | 1.64 | 0.83 |
In the case of adsorption on nitrogen doped surfaces all are corresponding to weak physisorption. For example, for three-nitrogen (9.37%) doped surface f2, the band gaps remain the same, i.e. 0.62 eV before and after adsorption. From the band structures provided in the Fig. 8, it is understood that the electronic structure has not changed with the adsorbate CO molecule for all configurations unlike in the case of boron doped systems. In the case of nitrogen doped adsorbent surfaces, we have not encountered any case where the molecule CO or NH3 binds chemically. In order to confirm the category of adsorptions of CO and NH3 on boron doped and also on nitrogen doped graphene surface, we have calculated the potential energy surfaces, for few relevant cases. For all the adsorption cases with low values of adsorption energy, we have got adsorption energy curves typical of physiorption. For example the potential energy curves for NH3 on d2 and CO on f1 are drawn together in Fig. 9 show typical curves for physisorption without any defined minima indicating weak interactions.
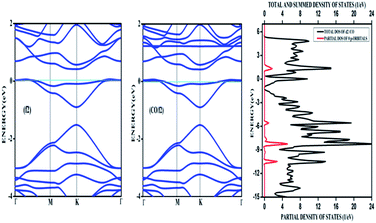 | ||
| Fig. 8 The band structure of a 4 × 4 supercell of nitrogen doped graphene surface before and after physisorption of CO. The density of states after adsorption is also given. | ||
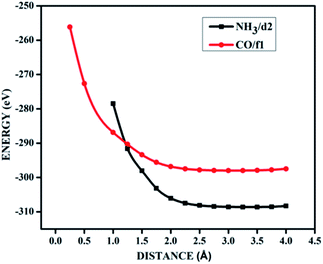 | ||
| Fig. 9 The potential energy curves for NH3 on d2 (NH3/d2) and CO on f1 (CO/f1) surfaces, showing physisorption. | ||
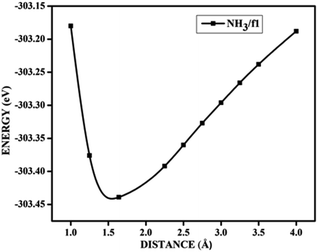
It is evident from the potential energy curves in Fig. 9 that the adsorption phenomena is purely physical and that when the single molecule of CO or NH3 approaches the surface the only interaction that it has is van der Waal's kind of weak interactions. The surfaces remain inert to the molecule and the electronic structure remains largely unaffected. On the other hand, we have seen cases where ammonia is rather strongly adsorbed on some of the surfaces, thus causing perturbations in the electronic structure. For example, for the case of NH3 adsorption on f1 surface, in addition to the band diagrams provided in Fig. 8 we can also visualise the effect of adsorption with the potential energy diagram, mentioned in Fig. 10 which shows the typical characteristics of chemisorption. Though the adsorption energy values are not very high and are of the order of about −1.04 eV, the tendency can be observed with a clear minimum at distance of 1.64 Å in the potential energy diagram. The depth of the chemical well represents the intensity of adsorption, whereas the global minimum position at the horizontal axis is equal to the equilibrium bond distance for the adsorbed species on this surface which in this case is around 1.64 Å. For any potential sensing application, it is highly appreciable to have surfaces with moderate values of adsorption energy rather than extremely high values. With respect to that, the cases that we have observed, namely NH3/a1, NH3/c1 and NH3/f1 are falling in this category and therefore such graphene adsorbent surfaces may find applications for use as sensor for ammonia molecule.
As chemisorption involves the bond formation between the gas molecule and the adsorbent surface, it involves an energy corresponds to −1.047 eV. As is evident from Fig. 5 and 7 the strong perturbation induced by the adsorbate influences the electronic structure of the doped surface lead to an increased band gap in the case of ammonia on a1 and also on f1 type of surfaces. In the case of pure physisorption, such as CO/f1, weak van der Waals forces are the only attraction between the adsorbing molecule and the surface. As illustrated in Fig. 9, the forces in the potential curve are small, at a relatively wide distance from the top, until a substantial rise in total energy is induced by strong repulsive forces resulting from overlaps in the electron density. The potential energy curve is characterized by a chemisorption minimum at shorter distance in the case where chemical bond formation can occur, such as in NH3/f1. To further study the effects of adsorbed molecules on the electronic properties of graphene, charge density surfaces are calculated for the systems with and without the adsorption for the visualizing the various interactions between the adsorbate and adsorbent. Sliced up surfaces along lattice planes are done in VESTA.37 In the Fig. 11 the charge density before and after adsorption of one of the important cases, namely NH3 on f1 surface is illustrated below as (a) and (b) respectively. As can be seen, the colours indicate that there is electron deficiency around the region where the doping is done. We chose to construct contour plots in the plane containing B–C–B bonds and the nitrogen of NH3. The charge–density plots in Fig. 11 show a dense mixture of charge density between the B of the graphene plan and N atom of NH3, indicating a distinct degree of covalent bonding between B and N atoms. The bonding states of B–N bonds lies on top of the valence bands. From Fig. 11 we can see carbon with four electrons and boron with three electrons forms covalent bond, along the contour of hkl (001). Fig. 12 shows the concentration of charge has been distributed among carbon atoms that are adjacent to borons or have formed bonds with borons.
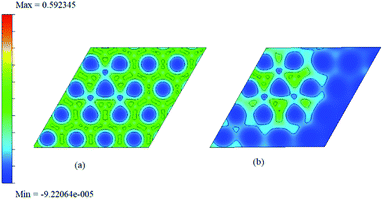 | ||
| Fig. 11 The two dimensional charge density surface for f1 (given before (a) and after (b)) adsorption of ammonia. | ||
The charge difference density is calculated according to the equation
| Δρ = ρ(NH3/f1) − (ρ(f1) + ρ(NH3)), | (2) |
The difference between charge densities of the adsorbed complex and the surface and the gas molecule NH3, according to eqn (2) is plotted in Fig. 12 in two different perspectives (a) and (b), to visualize the effect of perturbations due to adsorption. The difference density plot is to understand how the charge density redistribution takes place due to the formation of chemical bonds or due to interactions. The effect of ammonia which chemisorb on to the surface is clear from this. Near the regions where the boron atoms are present still show areas of electron deficient nature at immediate vicinity compared to the rest of the surface. On the other hand, the physisorption on doped surfaces show no appreciable change in the charge densities. The prominent charge accumulation occurs on the bond between the N atom of NH3 and the boron atom on the surface, indicating that a large electronic accumulation is the deciding factor for the formation of the strong chemical bond in this adsorption process. Overall it contributes to the understanding of the adsorption process and shows the electron distribution due to the formation of the bond between the adsorbate molecule and the doped surface.
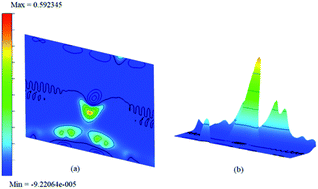 | ||
| Fig. 12 The difference charge density contour surface of NH3/f1 (a) contour plot and (b) bird-eye-view perspective. | ||
4 Conclusions
In conclusion, we have investigated the adsorption of CO and NH3 on chemically modified graphene surface. The chemical modification and alteration of the electronic properties of graphene layer is achieved by substitutional doping with boron and nitrogen. We have demonstrated that the band gaps can be significantly opened up from a value of 0 eV up to 0.83 eV on molecular adsorption on doped surfaces. It is also interesting to see that the electronic properties are modified with various mole fractions of doping and do not show a systematic increase with the increase in the dopant concentration. This is attributed to the sub-lattice induced symmetry breaking for certain dopant configurations on the surface. Therefore it can be concluded that an increased band gap cannot be achieved solely with an increased concentration of doping, the dopant sites and more importantly, the doping configurational patterns play a crucial role. It is observed that for adsorption of CO on certain isomers of the boron doped surface falls in the stronger physisorption regime. The ammonia molecule adsorbs chemically on certain configurations of boron doped surfaces with high adsorption energies ranging from −0.56 to −1.46 eV, whereas the interaction of both CO and NH3 with nitrogen doped surfaces fall in the physisorption range. Furthermore, our work also suggests that chemically modified graphene surface could be used new promising and useful materials, not only for possible sensing applications, but also for its potential applications in new technologies in nanoscale optoelectronic devices as a direct band gap semi-conductor.Conflicts of interest
The authors declare that there are no conflicts to declare.Acknowledgements
A. Sahithi acknowledges support from Birla Institute of Technology and Science-Hyderabad Campus for financial support in the form of a Junior Research Fellowship.References
- K. S. Novoselov, A. K. Geim, S. V. Morozov, D. Jiang, M. I. Katsnelson, I. V. Grigorieva, S. V. Dubonos and A. A. Firsov, Nature, 2005, 438, 197–200 CrossRef CAS.
- F. Bonaccorso, L. Colombo, G. Yu, M. Stoller, V. Tozzini, A. C. Ferrari, R. S. Ruoff and V. Pellegrini, Science, 2015, 347, 6217 CrossRef.
- J. Yu, L. Yu, H. Yang, Q. Liu, X. Chen, X. Jiang, X. Chen and F. Jiao, Sci. Total Environ., 2015, 502, 70–79 CrossRef CAS.
- R. H. Miwa, T. B. Martins and A. Fazzio, Nanotechnology, 2008, 19, 155708 CrossRef CAS.
- D. R. Cooper, B. D'Anjou, N. Ghattamaneni, B. Harack, M. Hilke, A. Horth, N. Majlis, M. Massicotte, L. Vandsburger, E. Whiteway and V. Yu, ISRN Condens. Matter Phys., 2012, 56, 501686 Search PubMed.
- R. Garg, N. K. Dutta and N. R. Choudhury, Nanomaterials, 2014, 4, 267–300 CrossRef.
- P. Rani and V. K. Jindal, RSC Adv., 2013, 3, 802–812 RSC.
- M. Alattas and U. Schwingenschlögl, Sci. Rep., 2018, 8, 17689 CrossRef CAS.
- S. Ullah, A. Hussain and F. Sato, RSC Adv., 2017, 7, 16064–16068 RSC.
- Q. Zhou, X. Su, W. Ju, Y. Yong, X. Li, Z. Fu and C. Wang, RSC Adv., 2017, 7, 31457–31465 RSC.
- Y. Zhou, W. Chu, F. Jing, J. Zheng, W. Sun and Y. Xue, Appl. Surf. Sci., 2017, 410, 166–176 CrossRef CAS.
- T. Hussain, P. Panigrahi and R. Ahuja, Nanotechnology, 2014, 25, 325501 CrossRef.
- X. Liu, J. Zhang, K. Xu and V. Ji, Appl. Surf. Sci., 2014, 313, 405–410 CrossRef CAS.
- N. Tit, K. Saida, N. M. Mahmouda, S. Kouser and Z. H. Yamani, Appl. Surf. Sci., 2017, 394, 219–230 CrossRef CAS.
- L. Kong, A. Enders, T. S. Rahman and P. A. Dowben, J. Phys. Condens. Matter, 2014, 26, 953 CrossRef.
- H. Gao and Z. Liu, RSC Adv., 2017, 7, 13082 RSC.
- M. A. Kang, S. Ji, S. Kim, C. Y. Park, S. Myung, W. Song, S. S. Lee, J. Lim and K. S. An, RSC Adv., 2018, 8, 11991–11996 RSC.
- F. Schedin, A. K. Geim, S. V. Morozov, E. W. Hill, P. Blake, M. I. Katsnelson and K. S. Novoselov, Nat. Mater., 2007, 6, 652–655 CrossRef CAS.
- E. Akbari, Z. Buntat, A. Afroozeh, S. E. Pourmand, Y. Farhang and P. Sanati, RSC Adv., 2016, 6, 81647–81653 RSC.
- T. Vikramaditya and K. Sumithra, J. Comput. Chem., 2014, 35, 586–594 CrossRef CAS.
- T. O. Wehling, K. S. Novoselov, S. V. Morozov, E. E. Vdovin, M. I. Katsnelson, A. K. Geim and A. I. Lichtenstein, Nano Lett., 2008, 8, 125–130 CrossRef.
- R. K. Joshi, H. Gomez, F. Alvi and A. Kumar, J. Phys. Chem. C, 2010, 114, 6610–6613 CrossRef CAS.
- W. Wang, Y. Zhang, C. Shen and Y. Chai, AIP Adv., 2016, 6, 025317–025322 CrossRef.
- S. Yang, G. Lei, H. Xu, B. Xu, H. Li, Z. Lan, Z. Wang and H. Gu, Appl. Surf. Sci., 2019, 480, 205–211 CrossRef CAS.
- J. Ni, M. Quintana and S. Song, Phys. E, 2020, 116, 113768 CrossRef CAS.
- C. Zhang, B. Li and Z. Shao, Appl. Surf. Sci., 2019, 469, 641–646 CrossRef CAS.
- A. S. Rad, S. S. Shabestari, S. Mohseni and S. A. Aghouzi, J. Solid State Chem., 2016, 237, 204–210 CrossRef CAS.
- J. Dai, J. Yuan and P. Giannozzi, Appl. Phys. Lett., 2009, 95, 232105 CrossRef.
- G. Kresse and J. Furthmüller, Phys. Rev. B: Condens. Matter Mater. Phys., 1996, 54, 11169 CrossRef CAS.
- G. Kresse and D. Joubert, Phys. Rev. B: Condens. Matter Mater. Phys., 1999, 59, 1758 CrossRef CAS.
- MedeA®, Materials Exploration and Design Analysis, Software Package, Ver. 2.22, Materials Design, Inc., San Diego, CA, USA, 2019 Search PubMed.
- J. P. Perdew, K. Burke and M. Ernzerhof, Phys. Rev. Lett., 1996, 77, 3865–3868 CrossRef CAS.
- H. J. Monkhorst and J. D. Pack, Phys. Rev. B: Solid State, 1976, 13, 5188–5192 CrossRef.
- R. F. W. Bader, Chem. Rev., 1991, 91, 893–928 CrossRef CAS.
- X. Zhou, C. Zhao, G. Wu, J. Chen and Y. Li, Appl. Surf. Sci., 2018, 459, 354–362 CrossRef CAS.
- R. Skomski, P. A. Dowben, M. Sky Driver and J. A. Kelber, Mater. Horiz., 2014, 1, 563–571 RSC.
- K. Momma and F. Izumi, VESTA 3 for three-dimensional visualization of crystal, volumetric and morphology data, J. Appl. Crystallogr., 2011, 44, 1272–1276 CrossRef CAS.
| This journal is © The Royal Society of Chemistry 2020 |

