 Open Access Article
Layered black phosphorus as a reducing agent – decoration with group 10 elements†‡
Jan Plutnar a,
Zdeněk Sofer
 a and
Martin Pumera
 *abc
*abc
aCenter for Advanced Functional Nanorobots, Department of Inorganic Chemistry, University of Chemistry and Technology in Prague Technická 5, Prague 6, 166 28 Czech Republic. E-mail: martin.pumera@vscht.cz; Web: www.twitter.com/PumeraGroup
bFuture Energy and Innovation Laboratory, Central European Institute of Technology, Brno University of Technology, Purkyňova 123, 61200 Brno, Czech Republic
cDepartment of Medical Research, China Medical University Hospital, China Medical University, No. 91 Hsueh-Shih Road, Taichung, Taiwan
First published on 2nd October 2020
Abstract
Black phosphorus is prone to surface oxidation under ambient conditions. This attribute is often seen as a negative property of this interesting material. However, its proneness to oxidation – thus the reductive properties – can also be employed in modification of its surface and in preparation of composite materials. Here we describe the process of decoration of BP particles with nickel, palladium and platinum in form of a phosphide or in metallic form, respectively. The deposits have forms of films or nanoparticles and the reported method represents a general way of modifying the surface of black phosphorus with metals or their respective compounds for desired applications.
Introduction
Black phosphorus (BP) belongs to the group of materials re-discovered by material scientists after many decades since their original discovery.1 Analogous to, for example, graphene, boron nitride, and silicene (and related materials), black phosphorus is a material with a possible future in (sub)micron electronic devices. The structure of the orthogonal BP consists of puckered double-layered sheets of phosphorus atoms arranged into hexagons with ‘chair’ conformation. Each of the phosphorus atoms in this structure is covalently bound to three adjacent neighbours forming a bond 2.18 Å long. The double-layered sheets are non-covalently stacked, with inter-layer spacing approximately 5 Å.2 BP is a direct band gap semiconductor (0.3–2.3 eV) with the value of the band gap inversely proportional to the number of the phosphorus double layers in the structure of the material. A material consisting of a single double-layer is commonly known as ‘phosphorene’ and has the highest value of the band gap,3 whereas for the bulk material the lowest value of the range was reported. Although BP is the thermodynamically most stable allotrope of phosphorus, it also suffers from an instability towards oxidation by air. This oxidation process can be even faster than the air oxidation of red phosphorus.4,5 The reason of this behavior can be found in the structure of BP. Arrangement of the phosphorus atoms into the puckered layers results in inevitable orientation of the non-bonding electron pairs above the plane formed by the atoms of the folds of the double layer thus exposing them for a possible reaction. Although an oxidation with oxygen in absence of moisture may result in passivation of the surface, any contact of this layer with water or other protic solvents results in complete deterioration of the material.6 Much effort was, and still is being made, to surmount the issue of stability of the BP and BP-based materials and devices usually relying on formation of a protective layer of an inert material, e.g. aluminum oxide or a polymethyl-methacrylate, thus preventing a contact of BP with the oxidizing environment. However, the reactivity of the surface could also be utilized in its modifications resulting in a change of the properties of the material. This can be achieved via formation of either covalent or non-covalent binding interactions with a protective (or substituting) agent.7–9 The routes of non-covalent modification of BP mostly rely on formation of a relatively strong interaction between the electron-rich surface of BP and an electron-poor guest as reported e.g. in modification of BP with 7,7,8,8-tetracyano-p-quinodimethane (TCNQ)10 or with anthraquinone,11 whereas the covalent modification methods exploit a formation of either P–C or P–O–C bonds.7–9 Although there were other methods of decoration of the surface of BP reported, they do not exploit the chemical reactivity of the material but rather the structural features of the grooves on the surface of BP to align suitable materials along these wrinkles.12The proneness of BP to oxidation, thus its reductive properties, can also be used in modification of its surface. A brief exposure of a BP sheet to aqueous solution of HAuCl4 results in formation of Au-nanoparticles adhered to the surface of BP.13,14 Similarly, Ag-nanoparticles can be formed by action of BP nanosheets upon aqueous solution of AgNO3 and 1-dodecylamine.15 There are also several reports describing an unintended reduction of a metallic precursor to metallic particles, as e.g. in the case of the preparation of Co-nanoparticles from an N-methylpyrrolidone solution of cobalt(II) acetate at 245 °C16 or preparation of palladium decorated BP sheets by reduction of Pd(NO3)2.17 Oleylamine and gaseous hydrogen were considered as the reducing agents in these reactions, however, BP might play the role of the actual reducing agent here as well. Although these procedures result in inevitable damage to the electronic structure of BP the as-deposited materials can have interesting photocatalytic15 or electrocatalytic properties.16
Leaving aside the electronic properties of BP after such reactions, its reductive properties obviously offer an interesting tool for new preparations of nanomaterials. In addition to the above-mentioned publications – Rosenstein and Donaldson were experimenting with reductive properties of red phosphorus in order to get some insight into its possible use as an agent for qualitative analysis and detection of various elements. In the years 1916–1919, they conducted dozens of experiments involving many compounds, mostly transition metal salts as the reduced species.18 Inspired also by their work, we had utilized BP as an agent for reduction conjoined with the deposition of the group 10 metals (i.e. Ni, Pd, and Pt) or their compounds on its surface via reductive formation of either amorphous or crystalline deposits, in form of a layer or separate nanoparticles. These materials were thoroughly studied and possible mechanisms of their formation were suggested.
Results and discussion
Black phosphorus was prepared by a known procedure involving a phosphorus vapor transfer assisted by a presence of SnI2.19 The as grown crystals were exfoliated under an inert atmosphere of argon in acetonitrile (MeCN) using shear force milling. The resulting powder was used throughout the experiments as the starting material (BP). Simple salts of the group 10 elements (i.e. Ni, Pd, and Pt) were used in the experiments as sources of the metals, namely NiCl2·6H2O, PdCl2, PtCl2, and K2PtCl4 and the reactions were done in various solvents (H2O, MeCN, aq. NH3) resulting in formation of different morphologies of the metal deposits. The solubility of the salts significantly varies in this series – while NiCl2 is easily soluble in water, PdCl2 and PtCl2 are not. On the other hand, PdCl2 is well soluble in hot MeCN (due to a formation of the PdCl2(MeCN)2 complex) and could also be dissolved in diluted aqueous HCl (due to the formation of PdCl42− anions). Similarly, PtCl2 can be dissolved in aqueous HCl or ammonia solutions. Typically, the reactions were conducted at 70 °C under an inert atmosphere with the molar ratio of BP to the metal 10![[thin space (1/6-em)]](https://www.rsc.org/images/entities/char_2009.gif) :
:![[thin space (1/6-em)]](https://www.rsc.org/images/entities/char_2009.gif) 1. All the materials were characterized by High-Resolution Transmission Electron Microscopy (HRTEM) associated with the Energy-Dispersive X-ray Spectroscopy (EDS) and Selected Area Diffraction (SAD), Raman spectroscopy, X-ray Photoelectron Spectroscopy (XPS) and also an Inductively Coupled Plasma (ICP) analysis in order to assess the chemical composition of the bulk material.
1. All the materials were characterized by High-Resolution Transmission Electron Microscopy (HRTEM) associated with the Energy-Dispersive X-ray Spectroscopy (EDS) and Selected Area Diffraction (SAD), Raman spectroscopy, X-ray Photoelectron Spectroscopy (XPS) and also an Inductively Coupled Plasma (ICP) analysis in order to assess the chemical composition of the bulk material.
Nickel (BP–Ni)
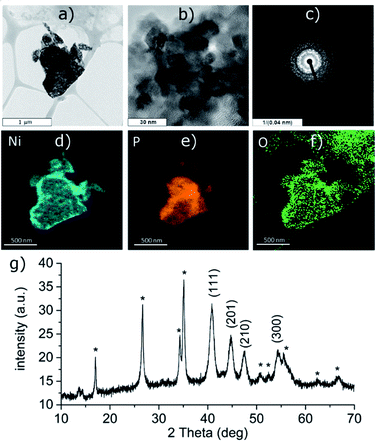
The reduction of the Ni(II) salt was attempted in deoxygenated water in strongly acidic (aq. HCl), neutral and alkaline (aq. NH3) solution. Depending on the reaction conditions, the reaction either resulted in a formation of black phosphorus particles completely covered with a nickel-containing layer (in neutral and alkaline solution, Ni-1 and Ni-2 samples, respectively) or no reaction occurred (acidic solution). The ICP analysis results show that the obtained bulk materials consist of 26 wt% of nickel and 70 wt% of phosphorus in the case of the sample Ni-1 and of 35 wt% of nickel and 56 wt% of phosphorus in the case of Ni-2 (the remaining 4 wt% or 9 wt%, respectively, were ascribed to oxygen). The HRTEM analysis of Ni-1 reveals that the layer actually consists of crystalline zones or blended nanoparticles of a size between 8 and 12 nm; the EDS analysis of the particles confirms the presence of nickel evenly spread on their surface (Fig. 1d–f). The polycrystallinity of the nickel layer was also confirmed by the presence of a rich ring-like diffraction pattern visible with the selected area diffraction (SAD) technique (see Fig. 1c). The initial suspicion that this layer consists of a metallic nickel was however not confirmed by the XRD of the material. The diffraction pattern of both materials corresponds to the hexagonal form of dinickel phosphide (Ni2P, ICDD 74-1385) with characteristic diffraction peaks at 2θ values 40.81, 44.70, 47.41 and 54.33° for Ni-1 and 41.16, 45.00, 47.72 and 54.54° for Ni-2, corresponding to reflections on the (111), (201), (210) and (300) planes, respectively, adhered on the surface of black phosphorus (Fig. 1g and 3g). The (111) reflections were used to approximate the apparent size of the crystalline zones in the materials with the Scherrer equation – d = λ/(Kβ![[thin space (1/6-em)]](https://www.rsc.org/images/entities/char_2009.gif) cos
cos![[thin space (1/6-em)]](https://www.rsc.org/images/entities/char_2009.gif) θ) – where d represents the apparent size of a crystallite, λ is the wavelength of the radiation (Cu Kα in our case, λ = 0.15406 nm), K represents the Scherrer constant (set to 1.0747 as the zones are close to spherical20), β is the additional broadening (simplified as a full width of the fitted peak at its half maximum – FWHM) and θ is the Bragg angle in radians. The resulting apparent sizes of the crystalline zones – approximately 10 nm for Ni-1 and 9 nm for Ni-2, respectively – correspond to the results of the HRTEM analyses.
θ) – where d represents the apparent size of a crystallite, λ is the wavelength of the radiation (Cu Kα in our case, λ = 0.15406 nm), K represents the Scherrer constant (set to 1.0747 as the zones are close to spherical20), β is the additional broadening (simplified as a full width of the fitted peak at its half maximum – FWHM) and θ is the Bragg angle in radians. The resulting apparent sizes of the crystalline zones – approximately 10 nm for Ni-1 and 9 nm for Ni-2, respectively – correspond to the results of the HRTEM analyses.
The XPS analysis of the samples also confirms the presence of nickel on the surface of the materials. A deconvolution of the high-resolution spectra of the Ni 2p regions reveals a presence of nickel in two oxidation states (Fig. 2 and S5‡). The lower oxidation state represented by a peak with EB = 853.4 eV corresponds to nickel in Ni2P. The other signal located at 856.0 or 856.1 eV (in Ni-1 and Ni-2, respectively) was assigned to a Ni(II) species, either a Ni–O from an oxide or hydroxide, or Ni–O–P of the oxidized BP. A deconvolution of the high-resolution spectra of the P 2p regions reveals presence of three peaks at 129.8, 130.7 and 134.4 eV in case of Ni-1 and 129.7, 130.5 and 133.4 eV in case of Ni-2, corresponding to P 2p3/2, P 2p1/2 and a mixed signal of the 2p electrons of oxidized phosphorus atoms, respectively (see Fig. 2 and S5‡). The slightly positive shift of the binding energy value of the Ni 2p3/2 peak together with the slightly negative shift of the P 2p3/2 peak (when compared with the values of metallic nickel – 852.8 eV – and black phosphorus – 130.3 eV, respectively) indicate a partial positive charge on Ni and partial negative charge on P in Ni2P. Because of the thickness of the Ni2P layer, no signals corresponding to BP were identified on the XPS spectra of the samples. On the other hand, the Raman spectra of the materials show the common features of BP materials, with the energies of the main vibration modes slightly shifted when compared to those of the pristine black phosphorus,21 namely the B1g, B3g, A1g, B2g and A2g modes with energies at 192.0, 227.0, 359.1, 434.3 and 461.6 cm−1, and 194.2, 229.4, 361.7, 438.3 and 466.6 cm−1 for Ni-1 and Ni-2, respectively (Fig. S9 and S10‡).
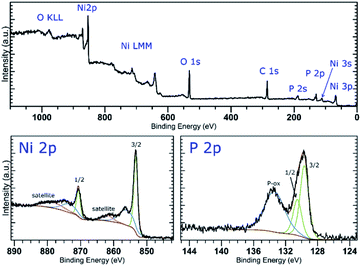 | ||
| Fig. 2 XPS survey spectrum (top) and high-resolution spectra of the Ni 2p and P 2p regions (bottom) of Ni-2. | ||
Palladium (BP–Pd)
PdCl2 was used as a precursor for preparation of palladium-decorated black phosphorus particles; the morphology and composition of the particles were dependent on the solvent and reaction conditions used for the preparation of the material. Whereas the reaction of the Pd(II) salt in acetonitrile resulted in a formation of BP particles completely covered with an amorphous palladium layer (Pd-1), the reaction of an acidic aqueous solution of the Pd(II) salt resulted in a formation of BP particles decorated with discrete crystalline palladium nanoparticles (Pd-2). A reaction in concentrated aqueous ammonia resulted in deposition of palladium nanoparticles on the surface of BP in some cases (Pd-3), according to the XRD analysis is the majority of the deposited palladium amorphous. The ICP analysis shows that the materials contain 47 wt%, 61 wt%, and 55 wt% of palladium and 46 wt%, 35 wt%, and 35 wt% of phosphorus (for Pd-1, Pd-2, and Pd-3, respectively) with 7, 4, and 10 wt% assigned to oxygen. XRD analysis of the materials revealed the amorphous character of Pd-1 as only the diffraction peaks corresponding to BP were observed being overlapped by the characteristic peak of an amorphous material (Fig. S2‡). On the other hand, the peaks corresponding to a presence of crystalline metallic palladium were identified in the XRD pattern of Pd-2. The diffraction patterns correspond to the face centered cubic structure of palladium (ICDD 87-0641) with characteristic diffraction peaks at 2θ values 40.25, 46.80, 68.26, 82.22 and 86.75°, corresponding to reflections on the (111), (200), (220), (311) and (222) planes, respectively, adhered onto the surface of BP (Fig. 3). The XRD pattern of Pd-3 suggests the material consists of a majority of an amorphous palladium deposit with hardly distinguishable peaks at 40.4 and 47.0° corresponding to diffractions along the (111) and (200) planes. The HRTEM and EDS analyses of Pd-1 reveal an almost homogeneous coverage of the BP particles with palladium (Fig. S2‡). In the case of Pd-2, clearly distinguishable particles of a size 10–16 nm are visible (Fig. 3). The HRTEM analysis of Pd-3 reveals presence of some BP particles almost homogeneously covered with Pd together with few decorated with discrete crystalline Pd nanoparticles (Fig. S3‡). As already mentioned, the XRD indicates the prevailing presence of the amorphous palladium layer. An analysis of the XRD data of Pd-2, using the (111) diffraction peak and the Scherrer equation, reveals an apparent particle size 14 nm. The XPS analysis of all samples does not show much difference in the composition of valence states of palladium. A deconvolution of the high-resolution spectra of the Pd 3d region reveals the presence of majority of palladium in zerovalent state in all the samples (81, 83, and 96% for Pd-1, Pd-2, and Pd-3, respectively) with binding energy Pd 3d5/2 peaks at 335.0 eV (Fig. 4, S6 and S7‡).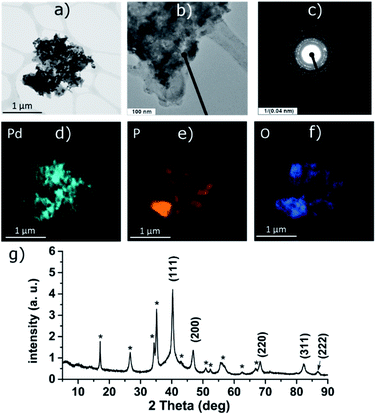 | ||
| Fig. 3 HRTEM images (a and b), selected area diffraction pattern (c), distribution of the elements (d–f) and the XRD pattern (g) of Pd-2. Asterisk-labeled peaks represent BP diffractions. | ||
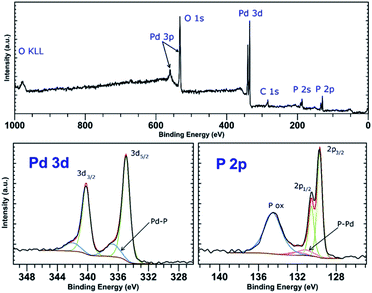 | ||
| Fig. 4 Survey XPS spectrum (top) and high-resolution spectra of the Pd 4d and P 2p regions (bottom) of Pd-2. | ||
The other Pd state represents only a minor component of the Pd 3d signal in all cases, with the Pd 3d5/2 binding energy peaks at 336.4, 336.7 and 337.5 eV (for Pd-1, Pd-2, and Pd-3, respectively). The value of the binding energy observed for the higher valence state of palladium, although attributable to Pd(II), also well corresponds to the values of Pd(0) in coordination compounds in which the palladium central atom is surrounded solely by phosphorus atoms (e.g. [Pd(PPh3)4] or [Pd2(PPh3)2]).22 We presume that the electrons of these binding energies are being emitted from the palladium atoms located in the areas of the Pd layer or the Pd particles which are in direct contact with the phosphorus atoms. An overlap of the valence orbitals of these palladium atoms and BP might cause an electron redistribution in the affected Pd(0) atoms resulting in the observed shift in the binding energies of the Pd 3d electrons.17,23 On the other hand, the composition of the valence states of phosphorus significantly differs amongst the samples. A deconvolution of the high-resolution spectra of P 2p regions reveals a presence of peaks at 129.8 and 130.7 eV corresponding to the 2p3/2 and 2p1/2 spin orbit peaks together with a broad peak corresponding to phosphorus in higher oxidation states in all the samples (Fig. 4, S6 and S7‡). While in the case of the amorphous sample Pd-1 the material contains approximately 64% of phosphorus in a higher oxidation state (P 2p EB = 134.6 eV), the crystalline sample Pd-2 contains only approximately 30% of the same (P 2p EB = 134.4 eV), and the mixed morphology sample Pd-3 also contains approximately 34% of the higher oxidation state phosphorus (P 2p EB = 134.4 eV). In addition to these two main signals an additional pair of peaks can be identified in the deconvoluted data of both samples that could be assigned to phosphorus coordinated to palladium.17,22 The 2p3/2 peaks were identified at 131.2 eV and 130.9 eV in Pd-1 and Pd-2, respectively. In the case of Pd-3 is the amount of the Pd-coordinated phosphorus very small (approximately 4% according to the analysis of the Pd 3d core line XPS spectrum) and we were not able to properly fit the respective signals in the P 2p spectrum of the sample. Analogously to the nickel-containing sample, the Raman spectra of all three materials show the common features of a BP material. The energies of the B1g, B3g, A1g, B2g and A2g vibration modes are located at 194.2, 229.5, 361.8, 437.9 and 466.4 cm−1, respectively, for Pd-1 (Fig. S11‡) and at 193.4, 228.5, 360.4, 436.4 and 465.0 cm−1, respectively, for Pd-2 (Fig. S12‡) and 194.2, 229.4, 361.7, 438.3 and 466.6 cm−1, respectively, for Pd-3 (Fig. S13‡).
Platinum (BP–Pt)
PtCl2 and K2PtCl4 were used as the precursors for preparations of the platinum-decorated BP. As PtCl2 is neither soluble in any organic solvent or in water, concentrated aqueous ammonia was used to dissolve it via formation of the tetraammineplatinum(II) chloride complex. In both cases, platinum nanoparticles were deposited on the surface of BP. The ICP analysis shows the content of platinum is approximately 32 and 38 wt% in Pt-1 and Pt-2, respectively. At the same time, the content of phosphorus was 59 and 52 wt% in the same respective samples, leaving approximately 9 and 10 wt% of the material to oxygen. XRD analyses of both samples revealed crystallinity of the deposited material on the surface of BP. In both cases the material deposited on BP consists of face centered cubic phase of platinum (ICDD 04-0802) deposited over the BP particles. The main diffraction peaks corresponding to the diffractions along the (111), (200), (220), (311) and (222) planes were found at 2θ values 40.12, 46.60, 67.86, 81.74 and 86.15°, respectively, for Pt-1 (Fig. S4g‡) and at 2θ values 40.06, 46.43, 67.74, 81.63 and 86.18°, respectively, for Pt-2 (Fig. 5g). The HRTEM analysis of the materials confirms the presence of the nanoparticles on the surface of the BP particles in both cases and the EDS analysis showed that these particles actually consist of platinum (Fig. S4a–f‡ for Pt-1 and Fig. 5a–f for Pt-2). The SAD patterns confirm the crystallinity of the particles. The average size of the nanoparticles was determined by the analysis of the HRTEM images and approximated from the XRD data according to the Scherrer with (111) diffraction peaks used for the approximation resulting in the apparent size of the metallic nanoparticles approximately 10 nm in Pt-1 and approximately 6 nm in Pt-2. These values well correspond to the size of the particles determined by the analysis of the HRTEM images (approximately 11 nm for the former and 5 nm for the latter one, respectively). The HRTEM images also reveal, that in the case of Pt-1 are the particles aggregated into larger ‘clusters’ of platinum (of a size around 250 nm), while in the case of Pt-2 the particles are more evenly spread on the surface of the BP particles. A deconvolution of the high-resolution spectra of the Pt 4f region of the XPS spectra of both samples revealed a presence of platinum in two valence states (Fig. 6 and S8‡). The majority of both samples (72 and 89%, respectively) is represented by platinum in zerovalent state as indicated by a presence of peaks with Pt 4f7/2 EB = 70.7 and 70.6 eV for the Pt-1 and Pt-2, respectively. We presume, that similarly to the Pd samples, the signals corresponding to a higher valence state of the platinum atoms (with 4f7/2 EB = 72.3 and 72.6 eV, respectively) belong to the atoms of the outer shells of the particles that are in direct contact with the phosphorus atoms. The high-resolution spectra of the 2p core level of phosphorus reveal presence of almost 31% and 48% of BP being oxidized in Pt-1 and Pt-2, respectively, as indicated by a presence of signals with EB = 134.0 and 133.7 eV, respectively. In addition, the peaks corresponding to the 2p3/2 and 2p1/2 spin orbit components of black phosphorus in both samples were identified at 129.7 and 130.6 eV, respectively. As in the case of the palladium-containing materials, additional signals were identified in the deconvoluted spectra. The 2p3/2 peaks were found at 130.8 and 130.7 eV in Pt-1 and Pt-2, respectively. Also, these signals were assigned to phosphorus atoms coordinated to platinum. Analogously to the previous materials, the Raman spectra of Pt-1 as well as of Pt-2 exhibit the common features of a BP material. The energies of the B1g, B3g, A1g, B2g and A2g vibration modes are located at 192.8, 228.3, 359.2, 434.3 and 462.2 cm−1, respectively, for Pt-1 (Fig. S14‡) and at 193.5, 229.6, 361.2, 437.7 and 465.3 cm−1, respectively, for Pt-2 (Fig. S15‡).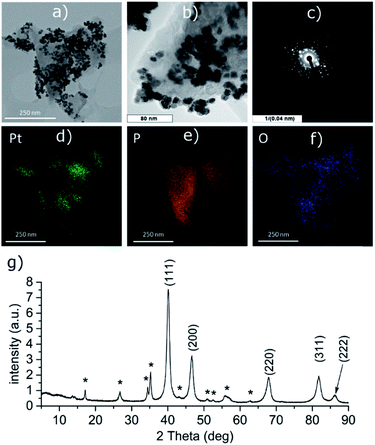 | ||
| Fig. 5 HRTEM images (a and b), selected area diffraction pattern (c), distribution of the elements (d–f) and the XRD pattern (g) of Pt-2. Asterisk-labeled peaks represent BP diffractions. | ||
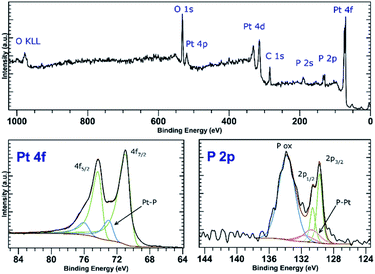 | ||
| Fig. 6 Survey XPS spectrum (top) and high-resolution spectra of the Pt 4f and P 2p regions (bottom) of Pt-2. | ||
Several different materials containing nickel, palladium and platinum, either in a form of a binary compound (Ni2P) or in a metallic form were deposited on the surface of BP particles (Table 1) utilizing a redox reaction in which the BP plays a role of the reducing agent. On the contrary to the reported methods of preparation of Ni2P deposited on black phosphorus, comprising of high temperature annealing of metallic nickel electrodes touching the surface of BP24 or a nickel(II)-doped surface of BP in the presence of tri-n-octylphosphine,25 our method consists of a simple low-temperature treatment of a BP/Ni(II) salt mixture in water or in aqueous ammonia using even milder conditions than in the reported preparation of Ni2P nanoparticles using red phosphorus as the reducing agent and the phosphide precursor at the same time.26 The morphology of the obtained materials could be described as a continuous film of the Ni/P alloy with randomly oriented crystalline domains of the hexagonal Ni2P rather than an agglomerate of regular nanoparticles. We hesitate to speculate excessively about the mechanism of the Ni2P formation but we presume that the overall progress of the process could be expressed by eqn (1).
| 2Ni2+ + Px + 4H2O → Ni2P + 4H+ + P(x−1)(OH)4 | (1) |
| Metal | Precursor | pH | Solvent | T [°C] | Product | Appearance | Label |
|---|---|---|---|---|---|---|---|
| Ni | NiCl2·6H2O | Neutral | Water | 70 | Ni2P | Continuous layer, crystalline | Ni-1 |
| Ni | NiCl2·6H2O | Acidic | Water | 70 | Ni2P | Continuous layer, crystalline | Ni-2 |
| Pd | PdCl2 | — | Acetonitrile | 70 | Pd | Continuous layer, amorphous | Pd-1 |
| Pd | PdCl2 | Acidic | Water | 70 | Pd | Discrete nanoparticles (∼14 nm), crystalline | Pd-2 |
| Pd | PdCl2 | Basic (NH3) | Water | 70 | Pd | Mixed amorphous–crystalline | Pd-3 |
| Pt | K2PtCl4 | Neutral | Water | 70 | Pt | Aggregated nanoparticles (∼10 nm), crystalline | Pt-1 |
| Pt | PtCl2 | Basic (NH3) | Water | 70 | Pt | Discrete nanoparticles (∼6 nm), crystalline | Pt-2 |
In this reaction, Ni2+ represents both, [Ni(H2O)6]2+ in the neutral aqueous solution as well as [Ni(NH3)6]2+ in the aqueous ammonia. BP here formally acts as both, the reducing and the reduced species. In the progress of the reaction, the oxidized BP slowly dissolves in water6 or aqueous ammonia as confirmed by a relatively low intensity of the signal corresponding to the higher oxidation states of phosphorus in the XPS spectra of the materials. 31P NMR spectroscopy of the mother liquors confirmed the presence of phosphorus in phosphates and phosphites (Fig. S16‡). Presumably, the overall mechanism of the reaction resembles the processes involved in the hypophosphite-based electroless nickel-coating process,27 although in this case the phosphide represents the major product of the reaction.
Surprisingly, no reaction between the solution of the nickel(II) salt and BP in strongly acidic medium (1 M aq. HCl) occurred. The XPS spectrum of the material isolated after the reaction reveals only a hardly detectable contamination of BP with nickel (Fig. S17‡). Also, no oxidation of BP is detected. Although we have no direct confirmation of the following explanation, we presume that a synergy of the possible repulsion of the negatively charged NiCl42− ions by the partially negatively charged surface of the partially oxidized BP surface and the relatively lower difference between the redox potentials of the Ni2+ to Niδ+ reduction and P(0) to P(III) and P(V) oxidations in acidic than in basic solutions is the key.28
In the case of palladium, three reactions under different conditions were tested, all of them using palladium(II) chloride as the source of palladium. Due to the limited solubility of PdCl2 in water, acetonitrile was chosen as the solvent for the first experiment. Upon dissolution of the chloride, [Pd(MeCN)4]2+ complex is initially formed, which subsequently reacts with BP. Amorphous palladium layer is formed as the result of this reaction (Pd-1). In the second experiment, PdCl2 was dissolved in a diluted solution of hydrochloric acid thus resulting in formation of the PdCl42− anion. The subsequent reaction with BP resulted in discoloration of the initially orange-yellow solution and formation of crystalline Pd nanoparticles on the surface of the BP (Pd-2). In the third reaction, PdCl2 was dissolved in concentrated aqueous ammonia thus forming the Pd(NH3)42+ cation solution. The mechanism of the metallic palladium formation remains unclear in the case of formation of the amorphous material, however, as we presume that the reaction in acidic water might proceed according to the eqn (2), a similar mechanism (involving a presence of traces of water in the reaction media) might be found behind the formation of Pd-1 as well. The presence of some source of oxygen is evident from the XPS spectra of the Pd-1 sample. We presume that some moisture might be present in the solvent. On the other hand, the amount of the such introduced water was most likely small as it was not sufficient to dissolve the oxidized BP layer in Pd-1, on the contrary to the relatively low amount of oxygen (or indirectly, the phosphorus in higher oxidation states) detected in the XPS spectra of the Pd-2 and Pd-3 samples prepared in acidic or ammonia water (55.6 vs. 34.8 and 34.0 at%, respectively) which presumably results from dissolution of the oxidized surface in water (as confirmed by NMR, see below).
| [MCl4]2− + 2H2O + Px → M(s) + 2Cl− + 2HCl + Px(OH)2 | (2) |
Similarly, the reaction of Pd(NH3)42+ could follow the reaction suggested in eqn (3) below.
| [M(NH3)4]2+ + 2H2O + Px →M(s) + 2NH4+ + 2NH3 + Px(OH)2 | (3) |
In the above-mentioned reactions, M represents either palladium or platinum. On the contrary to nickel, the value of the pH of the solution (or in other words, the charge of the complex ion) wasn't the decisive property in the redox process as in all cases elemental palladium was formed. Similarly to Ni, both P(III) and P(V) oxidation products were detected in mother liquors of the chemical reactions by NMR. Besides the phosphite and phosphate anions, also some orthophosphate was detected (Fig. S18‡).
Reduction of PtCl2 dissolved either in diluted HCl or in concentrated aqueous NH3 solutions with BP resulted in a formation of crystalline platinum nanoparticles in both cases. A reduction of the in situ formed [Pt(NH3)4]2+ complex yielded crystalline nanoparticles only negligibly larger than those prepared by an analogous reduction of the in situ formed PtCl42− complex. The nanoparticles in the former material (Pt-1) aggregate to form 250 nm large clusters whereas the nanoparticles in the latter material (Pt-2) are spread over the surface of the BP particles without any apparent clustering. The mechanism of the PtCl42− reduction is most likely identical to the one of the palladium analogues described by the eqn (2). Similarly, the reductive process of formation of platinum in ammonia is analogous to eqn (3).
Conclusion
As shown in the preceding text, black phosphorus can be successfully used as a reducing agent for production of various materials containing group 10 elements. In some cases (Ni, Pd), BP particles covered by a continuous layer of the produced material (Ni2P or Pd) are prepared under the given reaction conditions. Under some reaction conditions, BP covered with discrete metallic particles (Pd, Pt) as nanoparticles or their aggregates can be obtained. Interestingly, the reaction of BP with Ni(II) salt under relatively mild conditions resulted in formation of Ni2P instead of metallic nickel film or nickel particles. The procedure of Ni2P preparation described herein offers an alternative route towards preparation of this promising hydrogen evolution catalytic system. Although the presented data suggest an inevitable damage to the surface of the BP particles as the result of the redox reaction, the as prepared Pt and Pd–BP composites possess interesting structural features and could possibly serve e.g. as catalysts in various chemical processes where the presence of platinum group metals is required, taking advantage of the BP carrier as a “green” (in terms of the oxidative degradability to phosphates) material on one side and the possibility of their relatively simple in situ preparation (if desired) on the other. The above-described results also confirm, that in many of the already mentioned procedures black phosphorus (intended as a substrate or carrier of another material) also acted as the actual reducing agent instead of the added reducing agent (hydrogen17 etc.).Conflicts of interest
There are no conflicts to declare.Acknowledgements
This work was supported by the project Advanced Functional Nanorobots (Reg. No. CZ.02.1.01/0.0/0.0/15_003/0000444 financed by the EFRR).References
- P. W. Bridgman, J. Am. Chem. Soc., 1914, 36, 1344–1363 CrossRef CAS.
- A. Brown and S. Rundqvist, Acta Crystallogr., 1965, 19, 684–685 CrossRef CAS.
- Z. Guo, H. Zhang, S. Lu, Z. Wang, S. Tang, J. Shao, Z. Sun, H. Xie, H. Wang and X.-F. Yu, et al., Adv. Funct. Mater., 2015, 25, 6996–7002 CrossRef CAS.
- M. R. Somayajulu, G. K. Gautam and A. S. Rao, Def. Sci. J., 2007, 57, 817–824 CrossRef CAS.
- Y. Abate, D. Akinwande, S. Gamage, H. Wang, M. Snure, N. Poudel and S. B. Cronin, Adv. Mater., 2018, 30, 1704749 CrossRef.
- J. Plutnar, Z. Sofer and M. Pumera, ACS Nano, 2018, 12, 8390–8396 CrossRef CAS.
- C. R. Ryder, J. D. Wood, S. A. Wells, Y. Yang, D. Jariwala, T. J. Marks, G. C. Schatz and M. C. Hersam, Nat. Chem., 2016, 8, 597–602 CrossRef CAS.
- Z. Sofer, J. Luxa, D. Bouša, D. Sedmidubský, P. Lazar, T. Hartman, H. Hardtdegen and M. Pumera, Angew. Chem., Int. Ed., 2017, 56, 9891–9896 CrossRef CAS.
- M. van Druenen, F. Davitt, T. Collins, C. Glynn, C. O'Dwyer, J. D. Holmes and G. Collins, Chem. Mater., 2018, 30, 4667–4674 CrossRef CAS.
- G. Abellán, V. Lloret, U. Mundloch, M. Marcia, C. Neiss, A. Görling, M. Varela, F. Hauke and A. Hirsch, Angew. Chem., Int. Ed., 2016, 55, 14557–14562 CrossRef.
- R. Gusmão, Z. Sofer and M. Pumera, ACS Nano, 2018, 12, 5666–5673 CrossRef.
- D. W. Kim, H. S. Jeong, K. O. Kwon, J. M. Ok, S. M. Kim and H.-T. Jung, Adv. Mater. Interfaces, 2016, 3, 1600534 CrossRef.
- H. Huang, Q. Xiao, J. Wang, X.-F. Yu, H. Wang, H. Zhang and P. K. Chu, npj 2D Mater. Appl., 2017, 1, 20 CrossRef.
- Q. Wu, M. Liang, S. Zhang, X. Liu and F. Wang, Nanoscale, 2018, 10, 10428–10435 RSC.
- X. Wang, B. Zhou, Y. Zhang, L. Liu, J. Song, R. Hu and J. Qu, J. Alloys Compd., 2018, 769, 316–324 CrossRef CAS.
- F. Shi, Z. Geng, K. Huang, Q. Liang, Y. Zhang, Y. Sun, J. Cao and S. Feng, Adv. Sci., 2018, 5, 1800575 CrossRef.
- M. Vanni, M. Serrano-Ruiz, F. Telesio, S. Heun, M. Banchelli, P. Matteini, A. M. Mio, G. Nicotra, C. Spinella and S. Caporali, et al., Chem. Mater., 2019, 31, 5075–5080 CrossRef CAS.
- L. Rosenstein, J. Am. Chem. Soc., 1920, 42, 883–889 CrossRef CAS.
- M. Köpf, N. Eckstein, D. Pfister, C. Grotz, I. Krüger, M. Greiwe, T. Hansen, H. Kohlmann and T. Nilges, J. Cryst. Growth, 2014, 405, 6–10 CrossRef.
- J. I. Langford and A. J. C. Wilson, J. Appl. Crystallogr., 1978, 11, 102–113 CrossRef CAS.
- S. Sugai and I. Shirotani, Solid State Commun., 1985, 53, 753–755 CrossRef CAS.
- NIST X-ray Photoelectron Spectroscopy Database, NIST Standard Reference Database Number 20, National Institute of Standards and Technology, Gaithersburg MD, 20899 ( 2000), (retrieved [15.02.2020]) Search PubMed.
- M. Caporali, A. Guerriero, A. Ienco, S. Caporali, M. Peruzzini and L. Gonsalvi, ChemCatChem, 2013, 5, 2517–2526 CrossRef CAS.
- Z.-P. Ling, S. Sakar, S. Mathew, J.-T. Zhu, K. Gopinadhan, T. Venkatesan and K.-W. Ang, Sci. Rep., 2015, 5, 1–8 Search PubMed.
- Y. Lin, Y. Pan and J. Zhang, Int. J. Hydrogen Energy, 2017, 42, 7951–7956 CrossRef CAS.
- Y. Deng, Y. Zhou, Y. Yao and J. Wang, New J. Chem., 2013, 37, 4083–4088 RSC.
- J.-P. Randin and H. E. Hintermann, J. Electrochem. Soc., 1968, 115, 480–484 CrossRef CAS.
- S. G. Bratsch, J. Phys. Chem. Ref. Data, 1989, 18, 1–21 CrossRef CAS.
Footnotes |
| † This work was supported by the project Advanced Functional Nanorobots (reg. no. CZ.02.1.01/0.0/0.0/15_003/0000444 financed by the EFRR). |
| ‡ Electronic supplementary information (ESI) available. See DOI: 10.1039/d0ra06884e |
| This journal is © The Royal Society of Chemistry 2020 |

