 Open Access Article
Enzymatic preparation of glycerophosphatilcholine catalyzed by combinational phospholipases: a comparative study of concerted versus stepwise catalysis
Shaohua Liang,
Shukun Wang,
Yannan Meng and
Cong Sun *
*
College of Food Science and Engineering, Henan University of Technology, Lianhua Road 100, Zhengzhou 450001, Henan Province, P. R. China. E-mail: suncong0511@haut.edu.cn; Fax: +86-371-67758022; Tel: +86-371-67758022
First published on 21st October 2020
Abstract
Glycerophosphatilcholine (GPC) is widely applied in medical, pharmaceutical, food and cosmetic industries. Due to the lack of natural resources, enzymatic preparation of GPC has been explored in recent years. This study aimed to investigate and compare the effects of different addition methods of combinational phospholipases (PLA1 and PLA2) and various process parameters (time, temperature, pH, substrate concentrate, enzyme load, and stirring rate) on the preparation of GPC. The results showed that compared with concerted catalysis, the catalytic efficiency of adding PLA2 and then PLA1 (PLA2 → A1) was higher, whereas that of adding PLA1 and then PLA2 was lower. The main reason might be that the method of PLA2 → A1 could reduce acyl migration and the competition between PLA1 and PLA2, which was beneficial to improve the GPC yield and shorten the reaction time. This paper could provide a novel approach for the future preparation of GPC catalyzed by combinational phospholipases.
1. Introduction
Glycerophosphatilcholine (GPC) is the intermediate product of phospholipid decomposition, the precursor of neurotransmitter acetylcholine and phosphatidylcholine (PC), and also the precursor of membrane phospholipid.1–3 Many studies have shown that GPC can promote the secretion of growth hormone to treat Alzheimer's disease, and it can also increase the release of individual hormones to treat cognitive disorders, schizophrenia and emotional disorders. In addition, GPC also has the functions of treating cardiovascular diseases and promoting non rapid eye movement sleep.4–9 Therefore, GPC is widely applied in medical, pharmaceutical, food and cosmetic industries.10In general, there are three methods for preparing GPC, including animal tissue extraction, chemical and enzymatic methods. Natural GPC exists in the liver, brain and semen of animals.11 However, these natural resources are limited and the extraction yield is low, which is not suitable for large-scale industrial application.12–14 The purity and yield of GPC prepared by chemical catalysis is generally high, but it is also accompanied by toxic reagents or high energy consumption.15 Marrapu et al. prepared GPC from soybean/yolk powder phospholipid catalyzed by tetra butyl ammonium, the yield of which could reach 99%.16 Park et al. used benzyl alcohol to protect hydroxyl group, and prepared GPC by five-steps method.10 Although this method utilized the non-toxic reagents, the process was quite complex and the reaction temperature reached 120 °C.
Enzyme is considered as a kind of environment-friendly and high-effective catalyst, which has been generally applied in the preparation of GPC in recent years.17,18 The common phospholipases are mainly phospholipase A1 (PLA1), phospholipase A2 (PLA2), phospholipase B (PLB), phospholipase C (PLC) and phospholipase D (PLD).19–22 Their action sites are shown in Fig. 1. In terms of enzymatic preparation of GPC, single phospholipase is generally used. Zhang et al. studied the preparation of GPC by hydrolyzing soybean powder phospholipid with PLA1 as catalyst in aqueous system.23 Under the optimum conditions, the yield of GPC reached 94.5%. Lu et al. used a fed-batch process to catalyze the egg yolk lecithin with PLA1.24 The results showed that Tween 20 was the most effective surfactant for enhancing GPC concentration, and the GPC was obtained with a yield of 91.36% within 3 h. Kim et al. prepared GPC via Novozyme 435 catalyzed hydrolysis of soy phosphatidylcholine or a fractionated soy lecithin, in which a water-soluble fraction containing 98.6% of GPC was obtained.25 Although the yield of GPC was quite high with single phospholipase, high purity of substrate, such as lecithin, powder phospholipid and other high concentration phospholipids, was required, which led to high cost of production. In theory, GPC preparation catalyzed by single phospholipase is inefficient due to acyl migration.26 Take PLA1 for example, the sn-2-lysophosphatidylcholine (sn-2-LPC) generated by the initial hydrolysis is easily transformed into sn-1-lysophosphatidylcholine (sn-1-LPC) via acyl migration. Then, the sn-1-LPC was catalyzed by PLA1 to prepare GPC. However, the sn-1-LPC or sn-2-LPC generated by acyl migration have negative effects on the reaction rate. Therefore, Blasi et al. have attempted to add Lipozyme IM and PLA2 at the same time to the egg yolk microemulsion system, and the 94% GPC yield was obtained after 48 h at 35 °C.27 Although the GPC yield could reach a high level, the reaction time was so long, which might be due to acyl migration and competition between the two phospholipases. Thus, it may be a feasible method to prepare GPC by stepwise catalysis of combinational phospholipases.
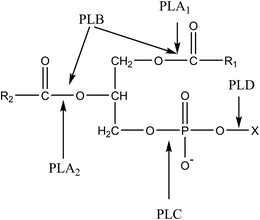 | ||
| Fig. 1 The action sites of four phospholipases. PLA1, phospholipase A1; PLA2, phospholipase A2; PLB phospholipase B; PLC, phospholipase C; PLD, phospholipase D. | ||
In this work, the preparation of GPC was carried out in the presence of two phospholipases (PLA1 and PLA2) with soybean concentrated phospholipid as raw material. The influences of the three adding methods of PLA1 and PLA2 (including PLA1 + A2, PLA1 → A2 and PLA2 → A1) on the yield of GPC under various process parameters were investigated and compared to obtain a more efficient method.
2. Materials and methods
2.1. Materials
Soybean concentrated phospholipid was purchased from COFCO Excel Joy (Tianjin) Co., Ltd. GPC (>98%) and PC (>99%) were purchased from Sigma-Aldrich Chemical (Shanghai, China). PLA1 (Lecitase® Ultra) is a sn-1 specific and protein-engineered carboxylic ester hydrolase (EC 3.1.1.3), which is extracted from Thermomyces lanuginosus/Fusarium oxysporum and produced by submerged fermentation of a genetically modified Aspergillus oryzae microorganism (activity, 10 KLU g−1; temperature, 40–60 °C; pH, 5–9), and was obtained from Novozyme Biotechnology Co., Ltd (China). PLA2 is a sn-2 specific hydrolase (EC 3.1.1.4) extracted from genetically modified Streptomyces violaceoruber (LysoMax Oil; activity, 900–1100 U g−1; temperature, 35–50 °C; pH, 5–8), and was obtained from DuPont Danisco. DSM Co., Ltd (China). Methanol and chloroform were HPLC grade and obtained from Fisher (Fair Lawn, NJ, USA). Ultrapure water was made in laboratory. The other solvents were all of analytical grade (Tianjin Kemiou Chemical Reagent Co., Ltd., Tianjin, China).2.2. Emulsification of soybean concentrated phospholipid
Soybean concentrated phospholipid was mixed with water in 250 mL round-bottom flask with magnetic agitation at 500 rpm for 30 min, and then homogenize it at 10![[thin space (1/6-em)]](https://www.rsc.org/images/entities/char_2009.gif) 000 rpm for 5 min with a high-speed shear dispersing emulsifier (Fluko FA28, Shanghai, China) to obtain a certain concentration of mixture.
000 rpm for 5 min with a high-speed shear dispersing emulsifier (Fluko FA28, Shanghai, China) to obtain a certain concentration of mixture.
2.3. Enzymatic preparation of GPC
The obtained mixture with different concentrations was hydrolyzed by PLA1 and PLA2 at various temperatures and pH with a magnetic stirrer. The phospholipases were added to the reaction system by means of the following ways.(I) PLA1 + A2: PLA1 and PLA2 were added at the same time (Fig. 2A).
 | ||
| Fig. 2 Schemes of GPC enzymatic preparation from PC via PLA1 + A2 (A), PLA1 → A2 (B) and PLA2 → A1 (C). | ||
(II) PLA1 → A2: PLA1 was firstly added for a certain time, and then PLA2 was added (Fig. 2B).
(III) PLA2 → A1: PLA2 was firstly added for a certain time, and then PLA1 was added (Fig. 2C).
2.4. GPC isolation
Once the reaction was finished, a 3 g of the reaction product was dehydrated in vacuum at 80 °C. Then, 5 mL of acetone was added, and the mixtures were shaken vigorously using a vortex mixer. This process was repeated 3 times. After the oil was removed, acetone was evaporated in vacuum at 40 °C. The mixed solvents of chloroform and methanol (v/v, 2![[thin space (1/6-em)]](https://www.rsc.org/images/entities/char_2009.gif) :
:![[thin space (1/6-em)]](https://www.rsc.org/images/entities/char_2009.gif) 1) were added with shaking, and the mixture was centrifuged at 10
1) were added with shaking, and the mixture was centrifuged at 10![[thin space (1/6-em)]](https://www.rsc.org/images/entities/char_2009.gif) 000 rpm for 10 min. The upper layer was filtered through a 0.22 μm polypropylene filter and used for the analysis of GPC.
000 rpm for 10 min. The upper layer was filtered through a 0.22 μm polypropylene filter and used for the analysis of GPC.
2.5. GPC analysis
The analysis of GPC was analyzed by high-performance liquid chromatography (Agilent 1260) equipped with an evaporative light scattering detection (ELSD). The ELSD was set at 65 °C with a nitrogen gas flow rate of 1.6 L min−1. The separation procedure was carried out on a SunFire™ Prep Silica column (5 μm, 4.6 × 250 mm, Waters, USA) and eluted with a binary gradient of methanol (A) and water (B). The proportion of elution B increased from 15% to 25% within the first 7 min, then increased to 30% within 5 min, and decreased to 15% within 0.1 min and maintained for 6.9 min. The flow rate was 1.0 mL min−1, and the injection volume was 10 μL. The concentrations of GPC and PC were measured using the external standard method. The yield of GPC and the conversion of PC were calculated as follows:where CGPC is the GPC concentration in the sample; V is the volume of the sample; MGPC is the theoretical mass of GPC; C0 and V0 are the concentration and volume of PC in the sample before reaction, while C1 and V1 are the concentration and volume of PC in the sample after reaction.
2.6. Statistical analysis
The experiments were carried out at least in triplicate, and the results were expressed as average. One-way analysis of variance was adopted to identify differences. Statistical significance was considered at P < 0.05.3. Results and discussion
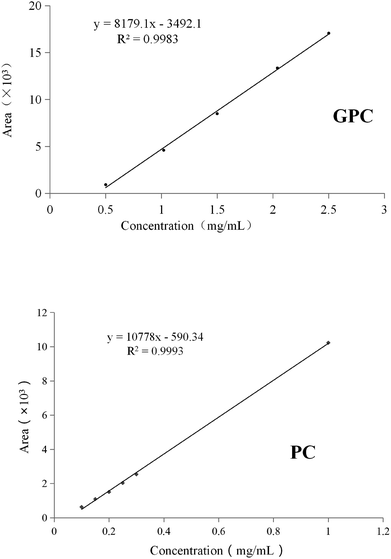
The soybean concentrated phospholipid was mainly composed of PC, phosphatidylethanolamine, phosphatidylinositol, phosphatidic acid and a small amount of sn-2-LPC. GPC was not detected in the raw material. The PC and GPC standards were used to build the calibration curves (Fig. 3), which were necessary to carry out the quantitative analysis of the remaining PC and generated GPC. In order to easily understand the paper, a general scheme of this study was shown in Fig. 4.3.1. Effect of reaction time on the preparation of GPC
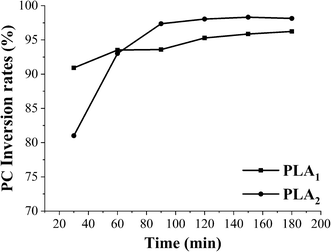
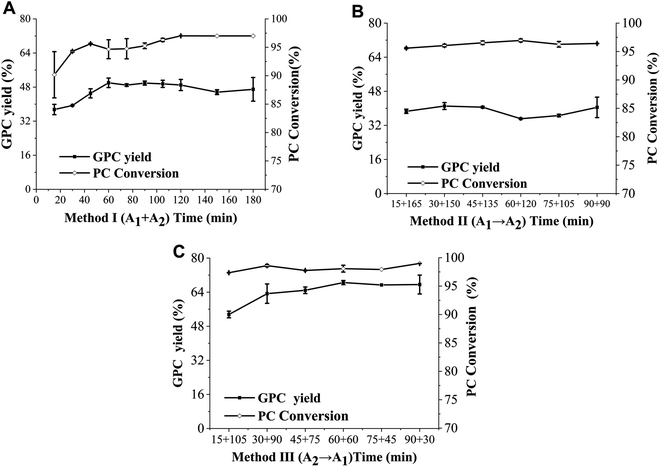
In order to provide a reference for the total reaction time of the combinational phospholipases, the time course of PC conversion in enzymatic hydrolysis catalyzed by PLA1 and PLA2 was determined. As shown in Fig. 5, the PC conversion catalyzed by PLA2 reached balanced at 90 min, whereas there was no significant difference in the PC conversion catalyzed by PLA1. Therefore, in order to adequately hydrolyze PC with PLA1 and PLA2 for obtaining a high yield of GPC, the total reaction time of method II (PLA1 → A2) and method III (PLA2 → A1) were determined to be 180 min and 120 min, while the shortest reaction time of PLA2 in method II (PLA1 → A2) and PLA1 in method III (PLA2 → A1) were set as 90 min and 30 min.The influence of reaction time in method I (PLA1 + A2) on the GPC yield and PC conversion in enzymatic hydrolysis was shown in Fig. 6A. The GPC yield increased with reaction time during 20–60 min, and reached equilibrium at 60 min (50.00%). A similar trend was observed in the PC conversion. The influences of the respective reaction time of PLA1 and PLA2 in method II (PLA1 → A2) and method III (PLA2 → A1) on the GPC yield and PC conversion were shown in Fig. 6B and C, respectively. As the reaction time of PLA1 in method II (PLA1 → A2) increased from 15 min to 90 min, there was little difference in the GPC yield and PC conversion, which indicated that the reaction time of PLA1 had little effect on the GPC yield and PC conversion when the total time was constant. However, GPC yield in method III (PLA2 → A1) increased by 14.98% with the reaction time of PLA2 from 15 min to 60 min and reached equilibrium at 60 min, which was 18.50% higher than that in method I (PLA1 + A2). In terms of the three methods, when the reaction time was appropriate and enough, there was no obvious difference in the PC conversion (>95%), whereas GPC yield was method III (PLA2 → A1) > method I (PLA1 + A2) > method II (PLA1 → A2), and the total reaction time was method I (PLA1 + A2) < method III (PLA2 → A1) < method II (PLA1 → A2). These results could be explained that the primary hydrolysate (sn-2-LPC) of method II (PLA1 → A2) was unstable and easily converted into sn-1-LPC, which reduced the catalytic efficiency of PLA1. Compared with method I (PLA1 + A2), PLA2 can completely act on PC at the initial stage of method III (PLA2 → A1) to generate a large number of stable sn-1-LPC and reduce acyl migration, and then PLA1 was added to completely act on sn-1-LPC, which improved the catalytic efficiency of PLA2. In addition, the reaction time of method III (PLA2 → A1) was shorter than that of single phospholipase.23,24,28
In terms of method I (PLA1 + A2) and method III (PLA2 → A1), PLA1 and PLA2 act on the substrates together at the second stage, whereas only PLA2 is used for catalytic hydrolysis at the initial stage in method III (PLA2 → A1). However, the GPC yield of method III (PLA2 → A1) was higher than that of method I (PLA1 + A2), which means that the catalytic efficiency of PLA2 was higher than the concerted effect of PLA1 and PLA2 at the initial stage. This phenomenon might be due to the competition between the two phospholipases. In addition, in terms of method II (PLA1 → A2) and method III (PLA2 → A1), the concerted catalysis of PLA1 and PLA2 act on the substrates at the second stage, whereas PLA1 and PLA2 catalyze the substrates at the initial stage, respectively. The GPC yield of method II (PLA1 → A2) was lower than that of method III (PLA2 → A1), which was related to the easier acyl migration of the primary hydrolysate of the former method.
3.2. Effect of reaction temperature on the preparation of GPC
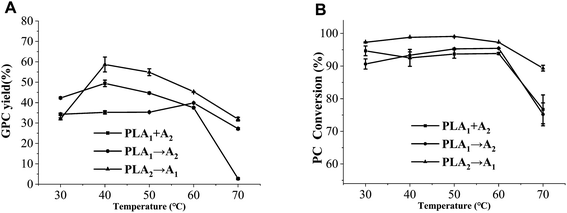
As reaction temperature increased, the GPC yields of method I (PLA1 + A2) and method III (PLA2 → A1) firstly increased from 30 °C to 40 °C, then significantly decreased from 40 °C to 70 °C, whereas there was no significant difference in method II (PLA1 → A2) (Fig. 7A). In detail, the GPC yield of method III (PLA2 → A1) reached the highest level (58.68%) at 40 °C, which was 9.26% higher than that of method I (PLA1 + A2) and nearly 20% higher than that of method II (PLA1 → A2) at the optimum temperatures. This was because there was less acyl migration in method III (PLA2 → A1). Moreover, both of the optimal temperatures in method I (PLA1 + A2) and method III (PLA2 → A1) were 40 °C, while it was 60 °C in method II (PLA1 → A2). The former was closer to the optimal temperature of PLA2, and the latter was closer to the optimal temperature of PLA1, which indicated that the two phospholipases might be competitive during the catalytic reaction.23,29As seen from Fig. 7B, there was no obvious difference in the PC conversion from 30 °C to 60 °C, whereas the PC conversion significantly decreased from 60 °C to 70 °C. This trend was found in the three methods. However, the PC conversions of method III (PLA2 → A1) within the temperature range were higher than those of the other methods.
3.3. Effect of pH on the preparation of GPC
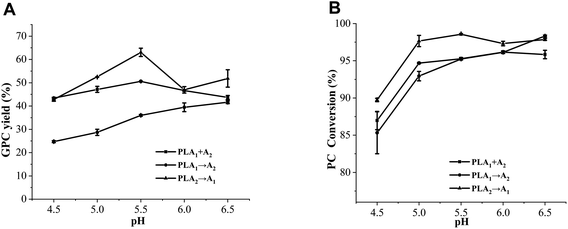
The pH of the reaction mixture not only affects the active site of phospholipase, but also affects the acyl migration of sn-2-LPC.30–32 As shown in Fig. 8A, a positive correlation between pH and GPC yield in method II (PLA1 → A2) was found, and the GPC yield reached the maximum (41.67%) at pH 6.5. This is because low pH can promote the acyl migration of the hydrolysate (sn-2-LPC) in the early stage.33 However, the GPC yield of method I (PLA1 + A2) firstly increased and then decreased with the increase of pH, and obtained the highest level (50.60%) at pH 5.5. Although a similar trend was also found in method III (PLA2 → A1), the GPC yield was 12.46% higher than that of method I (PLA1 + A2) at pH 5.5. This situation might be caused by the fact that PLA1 and PLA2 were simultaneously added to the reaction system in method I (PLA1 + A2), and the acidic environment of the reaction system accelerated the acyl migration of sn-2-LPC. However, the amount of PLA1 was definite, which led to the decrease of the GPC yield.Similar to GPC yield, the PC conversion of method II (PLA1 → A2) continuously increased with the increase of pH, whereas those of method I (PLA1 + A2) and method III (PLA2 → A1) increased from 4.5 to 5.0 and reached balanced at 5.0 (Fig. 8B). In addition, some studies have reported that the optimum temperatures of PLA1 and PLA2 are 4–5 and neutral, respectively.27,34,35 According to our results, the optimum pH values of method I (PLA1 + A2) and method III (PLA2 → A1) were 5.5 (in the optimum range of PLA1 and PLA2), which was lower than that of method II (PLA1 → A2). This phenomenon indicated that the optimum pH of the combinational phospholipases was not consistent with those of single phospholipases.
3.4. Effect of substrate concentration on the preparation of GPC
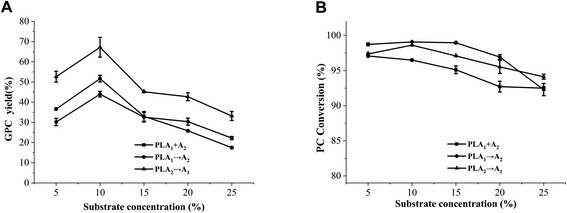
Phospholipid, oil and water can form an emulsion after homogenization. The mass and heat transfer of the reaction system are affected by emulsion viscosity, thus affecting the generation rate of GPC. As shown in Fig. 9, the PC conversion decreased with the increase of substrate concentration, whereas the GPC yield increased from 5% to 10% then decreased from 10% to 25%. This trend was found in the three methods. In theory, when the reaction mixture concentration is relatively low, the reaction system viscosity is low, and the substrate exists as single molecules or small aggregates, which leads to a large reaction interface area in favor of GPC preparation. As substrate concentration continues to increase, the active sites of phospholipases become insufficient to completely hydrolyze the substrates, resulting in the decrease of the GPC yield and PC conversion. Similar results were also discovered by Lu et al.24Although the optimal concentrations of the three methods was 10%, the GPC yield of method III (PLA2 → A1) was 23.92% higher than that of method II (PLA1 → A2) and 15.53% higher than that of method I (PLA1 + A2). Moreover, the GPC yields of method III (PLA2 → A1) at the substrate concentration range of 5–25% were higher than those of the other two methods. These results reflect the facts that the stepwise catalysis and adding order of the combinational phospholipases have an important influence on the preparation of GPC.
3.5. Effect of enzyme load on the preparation of GPC
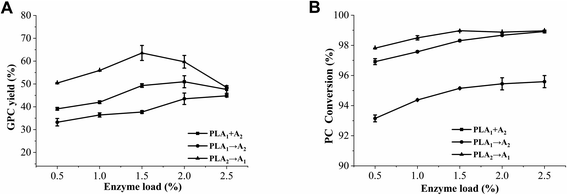
Many studies have confirmed the importance of enzyme load in the preparation of GPC.25,36 According to our preliminary experiments, it was found that the same amount of PLA1 and PLA2 was beneficial to improve the GPC yield. Thus, we only discuss the effect of total enzyme load on the GPC preparation in this paper. As shown in Fig. 10, when the enzyme load was 0.5–2.5%, the GPC yield and PC conversion of method I (PLA1 + A2) were always higher than those of method II (PLA1 → A2), which was due to the reduction of the acyl migration of sn-2-LPC by adding PLA1 and PLA2 at the same time. Opposite to the other two methods, the GPC yield of method III (PLA2 → A1) firstly increased then shapely decreased with the increase of enzyme load, which might be explained that excessive phospholipase might affect the binding probability of phospholipid and phospholipase. Luis et al. found that the initial rate had a significantly decrease when the lipase concentration was above 5% (W/W).37 In addition, although the optimum enzyme load was 1.5% in method I (PLA1 + A2) and method III (PLA2 → A1), the GPC yield of method III (PLA2 → A1) was 14.26% higher than that of method I (PLA1 + A2). These results indicated that the method, in which PLA2 is firstly added then PLA1 is added, had a positive role on the reduction of the acyl migration of sn-2-LPC and was beneficial to the preparation of GPC at the relatively low enzyme load.3.6. Effect of stirring rate on the preparation of GPC
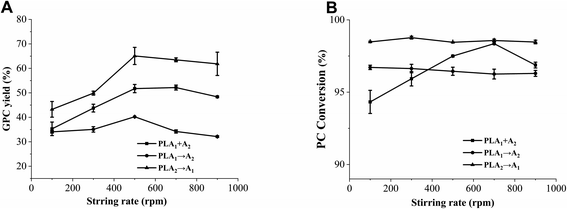
Since this hydrolysis reaction was carried out in a heterogeneous system, the mixing intensity of the reaction mixture affected the rate of enzymatic reaction. The effect of stirring rate on the GPC yield and PC conversion was shown in Fig. 11. With different stirring rate, there was no significant difference in the PC conversion of method II (PLA1 → A2) and method III (PLA2 → A1), whereas that of method I (PLA1 + A2) firstly increased and then decreased. In terms of GPC yield, the three methods showed that it increased with stirring rate from 100 to 500 rpm, and then slightly decreased with stirring rate from 500 to 900 rpm. Li et al. also discovered that high stirring rate could result in the reduction of catalytic activity.38 In theory, with the increase of stirring rate, the interface area of substrate at the aqueous phase gradually increases, and the probability of phospholipase active sites on phospholipids also increases, which is beneficial to the increase of the GPC yield. However, high stirring rate will make the reaction mixture and phospholipases suffer too much centrifugal force, resulting in being thrown to the inner wall of the reactor and reducing the GPC yield.Moreover, although the optimal stirring rate was 500 rpm among the three methods, the GPC yield of method II (PLA1 → A2) was 13.33% higher than that of method I (PLA1 + A2), and 24.84% higher than that of method II (PLA1 → A2). These results reflected that stirring rate had an obvious influence on hydrolysis efficiency, but had little influence on the different stepwise catalysis methods.
4. Conclusions
This study innovatively found that the addition method of PLA1 and PLA2 had a vital influence on the preparation of GPC. In particular, method III (PLA2 → A1) was superior to method I (PLA1 + A2), followed by method II (PLA1 → A2). The main reason was that the former method could effectively reduce the occurrence of acyl migration and the competition between PLA1 and PLA2, thus shortening the reaction time and improving the GPC yield. In addition, temperature, pH and enzyme load had significant effects on the different addition methods of PLA1 and PLA2, whereas reaction time, substrate concentrate and stirring rate had little effect on them. These results could provide a novel approach for the preparation of GPC catalyzed by combinational phospholipases in future.Conflicts of interest
There are no conflicts of interest to declare.Acknowledgements
This work was financially supported by the National Key Research and Development Program of China (2018YFD0401102).References
- Y. Du, W. He, W. Zhou and X. Li, Chem. Commun., 2019, 55, 8434–8437 RSC.
- W. S. Arrata, T. Burt and S. Corder, Fertil. Steril., 1978, 30, 329–333 CrossRef CAS.
- T. Ziegenfuss, J. Landis and J. Hofheins, J. Int. Soc. Sports Nutr., 2008, 5, P15 CrossRef.
- H. Komatsu, J. Westerman, G. T. Snoek, T. F. Taraschi and N. Janes, Biochim. Biophys. Acta, 2003, 1635, 67–74 CrossRef CAS.
- J. V. Greiner, T. Glonek, D. R. Korb, M. E. Lindsay and P. J. Oliver, Exp. Eye Res., 2020, 192, 107932 CrossRef CAS.
- A. Haider, Y. C. Wei, K. Lim, A. D. Barbosa, C. H. Liu, U. Weber, M. Mlodzik, K. Oras, S. Collier, M. M. Hussain, L. Dong, S. Patel, A. Alvarez-Guaita, V. Saudek, B. J. Jenkins, A. Koulman, M. K. Dymond, R. C. Hardie, S. Siniossoglou and D. B. Savage, Dev. Cell, 2018, 45, 481–495 CrossRef CAS.
- L. Marcus, J. Soileau, L. W. Judge and D. Bellar, J. Int. Soc. Sports Nutr., 2017, 14, 39 CrossRef.
- G. Strifler, E. Tuboly, A. Gorbe, M. Boros, D. Pecz and P. Hartmann, PLoS One, 2016, 11, e0166682 CrossRef.
- S. H. Lee, B. Y. Choi, J. H. Kim, A. R. Kho, M. Sohn, H. K. Song, H. C. Choi and S. W. Suh, Brain Res., 2017, 1654, 66–76 CrossRef CAS.
- J. M. Park, K. A. De Castro, H. Ahn and H. Rhee, Bull. Korean Chem. Soc., 2010, 39, 2689–2691 CrossRef.
- C. R. Scholfield, J. Am. Oil Chem. Soc., 1981, 58, 889–892 CrossRef CAS.
- H. Brockerhoff and M. Yurkowski, Can. J. Biochem., 1965, 43, 1777 CrossRef CAS.
- E. Baer, J. Am. Oil Chem. Soc., 1965, 42, 257–266 CrossRef CAS.
- G. Schmidt, B. Hershman and S. J. Thannhauser, J. Biol. Chem., 1945, 161, 523–536 CAS.
- H.-Y. Li, X.-L. Zhang, J.-B. Zhang, T.-T. Zhang and B.-X. Zhao, Int. J. Chem. Kinet., 2014, 46, 169–175 CrossRef.
- B. Marrapu, L. K. Mallampalli, S. S. Kaki and B. N. P. Rachapudi, Eur. J. Lipid Sci. Technol., 2015, 117, 1049–1055 CrossRef CAS.
- Y. Iwasaki and T. Yamane, Adv. Biochem. Eng./Biotechnol., 2004, 90, 151–171 CrossRef CAS.
- E. D. Yushkova, E. A. Nazarova, A. V. Matyuhina, A. O. Noskova, D. O. Shavronskaya, V. V. Vinogradov, N. N. Skvortsova and E. F. Krivoshapkina, J. Agric. Food Chem., 2019, 67, 11553–11567 CrossRef CAS.
- M. Murakami, Proc. Jpn. Acad., Ser. B, 2017, 93, 677–702 CrossRef CAS.
- A. M. Astudillo, M. A. Balboa and J. Balsinde, Biochim. Biophys. Acta, Mol. Cell Biol. Lipids, 2019, 1864, 772–783 CrossRef CAS.
- M. Murakami, Biochim. Biophys. Acta, Mol. Cell Biol. Lipids, 2019, 1864, 763–765 CrossRef CAS.
- H. Li, Y. Pang, X. Wang, X. Cao, X. He, K. Chen, G. Li, P. Ouyang and W. Tan, RSC Adv., 2019, 9, 6548–6555 RSC.
- K. Zhang, Y. Liu and X. Wang, Eur. J. Lipid Sci. Technol., 2012, 114, 1254–1260 CrossRef CAS.
- Y. Lu, A. Zhang, X. Wang, N. Hao, K. Chen and P. Ouyang, Biocatal. Biotransform., 2019, 37, 361–366 CrossRef CAS.
- J. Kim, Y. Song, S. J. Lee, J. E. Lee, M. Y. Chung, I. H. Kim and B. H. Kim, Biotechnol. Prog., 2020, 36, e2910 CrossRef CAS.
- A. F. Vikbjerg, H. Mu and X. Xu, J. Am. Oil Chem. Soc., 2006, 83, 609–614 CrossRef CAS.
- F. Blasi, L. Cossignani, A. Maurizi, M. S. Simonetti and P. Damiani, Ital. J. Food Sci., 2008, 20, 39–47 CAS.
- H. J. Bang, I. H. Kim and B. H. Kim, Food Chem., 2016, 190, 201–206 CrossRef CAS.
- J. Choi, W. Zhang, X. Gu, X. Chen, L. Hong, J. M. Laird and R. G. Salomon, Chem. Res. Toxicol., 2011, 24, 111–118 Search PubMed.
- D. Adlercreutz, H. Budde and E. Wehtje, Biotechnol. Bioeng., 2002, 78, 403–411 CrossRef CAS.
- R. Durrani, F. I. Khan, S. Ali, Y. Wang and B. Yang, Biomolecules, 2020, 10, 231 CrossRef CAS.
- R. A. Bouley, V. Hinkovska-Galcheva, J. A. Shayman and J. J. G. Tesmer, Biochemistry, 2019, 58, 1709–1717 CrossRef CAS.
- A. Pluckthun and E. A. Dennis, Biochemistry, 1982, 21, 1743–1750 CrossRef CAS.
- K. Clausen, Eur. J. Lipid Sci. Technol., 2001, 103, 333–340 CrossRef CAS.
- L. Poisson, M. Devos, S. Godet, F. Ergan and G. Pencreac'h, Biotechnol. Lett., 2009, 31, 743–749 CrossRef CAS.
- F. Blasi, L. Cossignani, M. S. Simonetti, M. Brutti, F. Ventura and P. Damiani, Enzyme Microb. Technol., 2006, 39, 1405–1408 CrossRef CAS.
- L. J. L. Giraldo, M. Laguerre, J. Lecomte, M.-C. Figueroa-Espinoza, N. Barouh, B. Barea and P. Villeneuve, Enzyme Microb. Technol., 2007, 41, 721–726 CrossRef.
- H. Li, X. Cao, Y. Lu, Y. Ni, X. Wang, Q. Lu, G. Li, K. Chen, P. Ouyang and W. Tan, Catalysts, 2019, 9, 237, DOI:10.3390/catal9030237.
| This journal is © The Royal Society of Chemistry 2020 |


