 Open Access Article
Electrocatalytic activity sites for the oxygen evolution reaction on binary cobalt and nickel phosphides†
Lin-Nan Zhoua,
Lan Yua,
Cai Liu*b and
Yong-Jun Li *a
*a
aState Key Lab of Chemo/Biosensing and Chemometrics, College of Chemistry and Chemical Engineering, Hunan University, Changsha 410082, China. E-mail: liyje@hnu.edu.cn
bCollege of Chemical Engineering, Beijing Institute of Petrochemical Technology, Beijing 102617, China. E-mail: liucai@bipt.edu.cn
First published on 2nd November 2020
Abstract
Binary cobalt and nickel phosphides have been widely developed owing to their remarkable activities for the oxygen reduction reaction (OER) as well as their low cost. However, the OER active sites of binary cobalt and nickel phosphides are still controversial. Here, we use a CoNiP nanocage as a model catalyst and systematically investigate the correlation between the composition and the OER activity, clarifying how the ratio of CoOOH/NiOOH affects the OER activity. With the increase of the atomic ratio of Ni/Co (y/x, 0 < y/x < 3.5), the amount of NiOOH generated during the OER always increases; and the CoOOH initially increases and subsequently decreases, showing a similar changing tendency to the OER activity of CoNiP. When y/x = 1.5, CoNiP has the best OER activity with an overpotential of 278 mV at a current density of 10 mA cm−2 and a low Tafel slope of 67 mV dec−1. All tested CoNiP catalysts show better catalytic activity than pure CoP, indicating that the catalytic activity of CoNiP should be attributed to the synergistic effect of CoOOH and NiOOH rather than exclusively to CoOOH or NiOOH. This study clarifies the origin of the catalytic activities of CoNiP, helpful for designing high-efficiency CoNiP catalysts.
Introduction
The oxygen evolution reaction (OER) has attracted intensive attention in recent years because of its vital role in energy conversion and storage technologies,1,2 such as metal–air batteries3,4 and electrochemical water splitting.5,6 The OER has intrinsically sluggish reaction kinetics due to the participation of multiple proton-coupled electron transfer steps, and usually requires electrocatalysts to accelerate the reaction rate. To date, RuO2 and IrO2 are the most effective OER electrocatalysts, but are not practical for large-scale applications because of their scarcity and high costs.7,8Therefore, many inexpensive electrocatalysts have been developed, where cobalt9–12 or nickel13–16 phosphides have raised great interest owing to their low cost and remarkable OER activities comparable to RuO2 or IrO2. In fact, binary cobalt and nickel phosphides (CoNiP)17–22 are demonstrated to have much better OER activity than most monometallic phosphides17,19,23 due to the synergistic effect between the host and guest metals.19,24,25 Moreover, the introduction of the second metal Ni or Co atoms can turn their electronic structures by forming a CoNiP composite, which can optimize binding energies for OER intermediates and make CoNiP to exhibit OER activity. For example, after the introduction of Co atoms, homogeneous Ni2P,17,19,22 CoP18 and NiCoP26–28 phases were found in as-formed ternary CoNiP composites: CoP and Ni2P phases were detected in CNTs@NiCoP/C,20 NiCoP/C21 and Ni2P–CoP29 composite, and the CoP and CoNiP phases were detected in NiCo2Px.30 Of course, the unique structure features of NiCoP with a high specific surface area also contribute to the OER performance.
In particularly, strong evidences14,15,31 show that the OER activity of CoP or NiP does not directly originate from its bulk, but from metal oxyhydroxide (CoOOH or NiOOH) produced during the OER process. Zhao and co-workers20 reported that high-valence-state Co species in the NiCoP can be more easily oxidized into CoOOH species as actual surface-active sites during OER process. Wang and co-workers32 prove that the large surface area offered by the 3D hierarchical nanostructure and the formation of NiOOH together contribute to the OER activity. He and co-workers21 demonstrate that the actual surface-active sites in NiCoP/C nanoboxes may be from the formed core–shell structures of Ni2P/NiOOH and CoP/CoOOH. Additionally, some argues that the catalytic activity of the NiCoP may be originated from the formation of Ni–Co oxo/hydroxide on the surface of catalysts during the OER process.19,27,28 Nevertheless, which, NiOOH or CoOOH, mainly contributes the catalytic activity is still a controversy for CoNiP. To further understand the origin of the catalytic activity of CoNiP, the following issues have to be addressed: (i) how does the Ni/Co atomic ratio affect the amount of CoOOH or NiOOH? and (ii) how does the ratio of CoOOH to NiOOH affect the OER performance?
Herein, we use CoNiP nanocage as a model catalyst, systematically investigate the composition-dependence of its catalytic activity, and clarify CoOOH and NiOOH contributions to the OER activity. CoNiP nanocages with controllable Ni/Co atomic ratio were fabricated by the hydrolyzing-phosphorization of Co-based zeolitic imidazolate framework-67 (ZIF-67). Accordingly, the OER activity of CoNiP first increases (0 < y/x < 1.5) and then decreases (1.5 < y/x < 3.5). At y/x = 1.5, the CoNiP nanocages exhibit the best OER performance with an overpotential of 278 mV at a current density of 10 mA cm−2 and a low Tafel slope of 67 mV dec−1. The results indicate that neither NiOOH nor CoOOH can exclusively contribute for the OER activity, which should be attributed to the synergistic effect of NiOOH and CoOOH.
Experimental
Chemicals
Co(NO3)2·6H2O (98.5%), Ni(NO3)2·6H2O (98.5%), KOH (85%) and NaH2PO2 (99%) were supplied by Sinopharm Chemical Reagent Co. Ltd. (China). 2-Methylimidazole was purchased from Aladdin Biochemical Technology Co. Ltd (China). All chemicals were used as received. Milli-Q water (18.2 MΩ cm) was used in all experiments.Materials preparation
For comparison, CoCo-LDH was also prepared by a similar procedure except that Co(NO3)2·6H2O (400 mg) was used as the precursor.
Preparation of catalyst ink
Isopropanol (50 μL) and Nafion ethanol solution (50 μL, 5 wt%) were added into 900 μL of water, to which was added 5 mg of catalysts under ultrasonication, forming a catalyst ink. The catalyst ink (10 μL) was applied over a rotating disk electrode (RDE, 5 mm) and dried in the air. The catalyst mass loading is ∼0.25 mg cm−2.Electrochemical measurements
Electrochemical measurements were performed in a traditional three-electrode configuration. A platinum wire and a Ag/AgCl electrode were used as the counter electrode and the reference electrode, respectively. Catalyst-modified RDE electrode was used as the working electrode.The OER activities of all catalysts were evaluated by linear sweep voltammetry (LSV) at a scan rate of 5 mV s−1 in O2-saturated 1.0 mol L−1 KOH solution, and the working electrode was rotated at 1600 rpm to remove the oxygen bubbles produced during OER. The catalyst stability was evaluated by cyclic voltammetry (CV) and chronoamperometry. Electrochemical impedance spectroscopy (EIS) measurements were performed over the frequency range from 0.1 to 105 Hz with an AC amplitude of 5 mV at open circuit potentials. All reported potentials refer to RHE (ERHE = EAg/AgCl + 0.059 pH + 0.197 V) unless otherwise specified. All electrochemical data were presented without iR compensation.
Characterizations and instruments
Electrochemical measurements were performed on a WD20-BASIC (PINE, America). EIS measurements were performed on CHI660D electrochemical workstation (Chenhua, Shanghai). Transmission electron microscopy (TEM), and high-resolution transmission electron microscopy (HRTEM) images were obtained on JEM-3010 microscope (JEOL, Japan) with an Oxford INCA detector operating at 300 kV. Scanning electron microscopy (SEM) images were obtained on JSM-6700F electron microscope at 500 kV. X-ray diffraction (XRD) measurements were performed on a XRD-6100 X-ray diffractometer (Shimadzu) with Cu Kα radiation (λ = 0.154 nm). Inductively coupled plasma optical emission spectrometry (ICP-OES) data were collected on an IRIS Intrepid II XSP instrument (Thermo Fisher). X-ray photoelectron spectroscopy (XPS) spectra were obtained on an X-ray photoelectron spectrometer (K-alpha 1063, Thermo Fisher) with Al Kα X-rays as the excitation source.Results and discussion
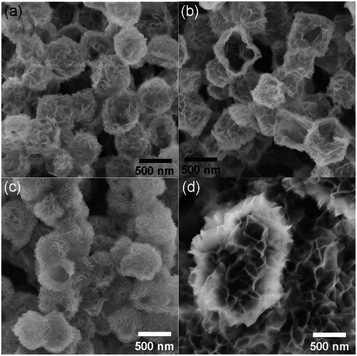
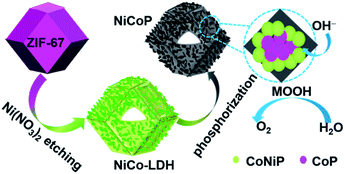
Similar to the previous report,11 as-prepared ZIF-67 crystal shows smooth surface and a rhombic dodecahedral shape with an average size of ∼750 nm (Fig. S1†). After treating with Ni(NO3)2, ZIF-67 crystals were transformed into CoNi-layered double hydroxides (CoNi-LDHs).33 The Ni/Co atomic ratio, y/x, in CoNi-LDH was controlled by varying the added amount of Ni(NO3)2·6H2O, as determined by ICP-OES analyses, CoNi0.8-, CoNi1.5-, CoNi2.2-, and CoNi3.5-LDHs can be obtained, as shown in Fig. 1. CoNi-LDH samples are similar in morphology to ZIF-67 crystals; interweaved nanosheets are randomly distributed on the surface. From CoNi0.8-LDH to CoNi3.5-LDHs, the morphologies of the products do not show a prominent change, and only the difference is that the nanosheet size become larger and larger. Notably, some of the nanocrystals were observed to collapse, suggesting that each CoNi-LDH particle has a hollow interior structure. The formation of the hollow structure originates from the reaction kinetic balance between the precipitation of the shell and the acidic etching of ZIF-67.34 The formation of LDH is further confirmed by XRD characterization (Fig. S2†): the diffraction peaks at 22.5°, 33.7° and 60.2° correspond to (006), (009) and (110) facets of LDH,20 respectively, completely different from the XRD pattern of ZIF-67 crystals (Fig. S2†).34As illustrated in Scheme 1, through a solid-state phosphorization reaction, CoNi0.8-, CoNi1.5-, CoNi2.2-, and CoNi3.5-LDHs were transformed into CoNi0.8P, CoNi1.5P, CoNi2.2P, and CoNi3.5P, respectively. All as-formed phosphides inherit the morphological feature of LDHs (Fig. S3† and 2a–d), that is, the phosphorization process did not lead to a morphology change. With the increase of Ni content, the neighbouring particles aggregated and formed a larger superstructure (Fig. 2a–d). The formation of phosphides is further confirmed by XRD analyses (Fig. 2e and S4†). As for CoP (Fig. S4†), the diffraction peaks at 31.6°, 36.3°, 46.2°, 48.1°, and 56.7° correspond to CoP-(011), -(111), -(112), -(211), and -(301) facets (JCPDS#29-0497), respectively. As for CoNi0.8P (Fig. 2e), the diffraction peaks of CoP phase (JCPDS#29-0497) are still intensive; additionally, the peaks located at 40.9°, 44.9°, 47.5° and 54.4° can be indexed to (111), (201), (210) and (300) of CoNiP (JCPDS#71-2336), respectively, suggesting that CoNi0.8P mainly comprises of CoP and CoNiP.30 However, with the increase of the Ni/Co atomic ratio (y/x) from 1.5 to 3.5 (Fig. 2e), the characteristic diffraction peaks of CoP are almost disappeared, and simultaneously, the peaks at 40.9°, 44.9° and 52.9° gradually increase. As the peaks located at 40.9°, 44.9°, 48.4°, 52.9° and 55.4° exclusively belong to (111), (021), (120), (002) and (030) of Co2P (JCPDS#54-0413), respectively, suggesting that the CoNiP (1.5 ≤ y/x ≤ 3.5) is dominated by Co2P and CoNiP. These results indicate that the XRD pattern of CoNiP depends on the content of Ni atomic percentage.
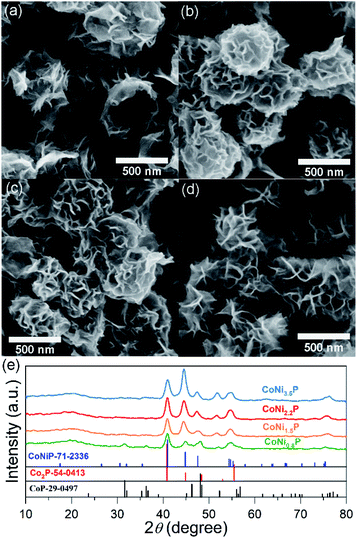 | ||
| Fig. 2 SEM images (a–d) and XRD patterns (e) of CoNi0.8P (a), CoNi1.5P (b), CoNi2.2P (c) and CoNi3.5P (d). | ||
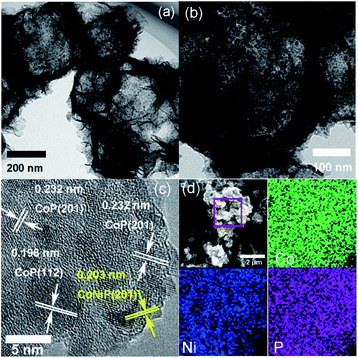
CoNi1.5P as a representative was further characterized by TEM (Fig. 3a). Compared to CoNi1.5-LDH (Fig. S5†), CoNi1.5P still retains a hollow and porous structure. On close observation (Fig. 3b), the surface of nanosheet, however, is no longer smooth, and there are numerous small nanoparticles (∼7 nm in diameter). Furthermore, the HRTEM image (Fig. 3c) of CoNi1.5P depicts distinct lattice fringes with the d-spacing of about 0.232 and 0.196 nm (Fig. 3c), corresponding to the CoP (201) and (112) crystalline planes, respectively, whereas other neighbouring lattice fringes measure ∼0.203 nm, indexed to CoNiP (201) crystalline plane (Fig. 3c). These results indicate that the cobalt and nickel phosphide is a mixture of cobalt phosphide and nickel phosphide. EDS mapping images (Fig. 3d) show that Co, Ni, and P elements are distributed uniformly in CoNi1.5P, suggesting that CoNiP and CoP phases are mixed at the nanoscale level.
The surface chemical composition in CoNi1.5P was confirmed by XPS characterization (Fig. S6†). The binding energy at ∼778.3 eV is indexed to Co–P (Fig. S6a†), with a few positive shifts relative to that of metallic Co (∼777.9 eV). The binding energies located at ∼782.5 and 798.4 eV are mainly attributed to Co 2p3/2 and Co 2p1/2 of cobalt oxides, respectively, and other two binding energies at 786.9 and 803.5 eV are usually ascribed to the satellite of Co species.17,35,36 Similarly, in the high-resolution Ni 2p3/2 spectrum (Fig. S6b†), the binding energies at ∼853.1 and 856.9 eV are caused by Ni–P,37 more positive than metallic Ni (∼852.3 eV). Additionally, the binding energies at 870.1 and 874.9 eV correspond to Ni3+ and Ni2+ 2p1/2 of nickel oxides, respectively; the binding energy at 880.5 eV is from the satellite of Ni species.17 Additionally, the binding energies at 130.1 and 129.4 eV in the P 2p spectrum (Fig. S6c†) can be ascribed to P3−, more negative than that of P0 (∼130.2 eV),38 and the binding energy at 134.2 eV belongs to oxidized P species.38,39 The formation of Co, Ni and P oxide species was corroborated by O 1s spectrum (Fig. S6d†): the appearance of the binding energy at 531.8 eV for O–C![[double bond, length as m-dash]](https://www.rsc.org/images/entities/char_e001.gif) O/P–O/oxygen vacancies.40 According to the XPS results, Ni and Co binding energies show positive shifts, and P binding energy shows a negative shift, which implies that a local electric dipole may be established, facilitating electrons transfer from Ni and Co to P. Previous reports19,27,41 also demonstrated that this electron transfer may change the energy barrier of the adsorption and desorption processes and thus adjust the OER kinetic behaviour.
O/P–O/oxygen vacancies.40 According to the XPS results, Ni and Co binding energies show positive shifts, and P binding energy shows a negative shift, which implies that a local electric dipole may be established, facilitating electrons transfer from Ni and Co to P. Previous reports19,27,41 also demonstrated that this electron transfer may change the energy barrier of the adsorption and desorption processes and thus adjust the OER kinetic behaviour.
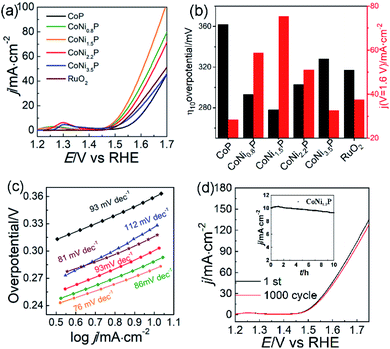
To illustrate the catalytic mechanism of CoNiP towards OER, all CoNiP samples with different Ni/Co atomic ratios were investigated in O2-saturated 1.0 mol L−1 KOH aqueous solution. A pair of redox peaks was observed between the potential of ∼1.15 and 1.35 V for each sample (Fig. S7†), characterizing the oxidation of Ni2+ and Co2+ and the formation of NiOOH and CoOOH.10,42–44 Fig. 4a exhibits the OER performance of all catalysts evacuated by the LSV at a scan rate of 5 mV s−1. We found that the overpotentials at 10 mA cm−2 (η10) and the current densities at 1.6 V (j1.6) have a change by the following tendency: η10(CoNi1.5P) < η10(CoNi0.8P) < η10(CoNi2.2P) < η10(RuO2) < η10(CoNi3.5P) < η10(CoP); j1.6(CoNi1.5P) > j1.6(CoNi0.8P) > j1.6(CoNi2.2P) > j1.6(RuO2) > j1.6(CoNi3.5P) > j1.6(CoP). As shown in Fig. 4b, all CoNiP catalysts exhibit better catalytic activity than CoP, indicating that the coexistence of Ni and Co elements can reduce the activation energy barrier, and thus, the O2 gas can be produced more easily. Although the CoP shows relatively low catalytic activity, CoP in CoNiP still plays a significant role in the CoNiP catalytic activity because the electron-deficient Co of CoP is helpful for OH− adsorption in alkaline media,17,24,30 benefiting for subsequent oxygen evolution. CoNi-LDH catalysts exhibit lower catalytic activity than CoNiP (Fig. S8†), the overpotentials of CoNi0.8-LDH, CoNi1.5-LDH, CoNi2.2-LDH, and CoNi3.5-LDH catalysts in O2-saturated 1.0 mol L−1 KOH aqueous solution at 10 mA cm−2 are 349, 332, 345, and 365 mV, respectively. Hence, the catalytic activity of CoNiP catalysts is closely linked with the Ni/Co atomic ratio of y/x: with the increase of y/x from 0 to 3.5, the catalytic activity of CoNiP initially increases (0 < y/x < 1.5) and then decreases (1.5 < y/x < 3.5). CoNi1.5P shows the best OER activity with the smallest η10 and the largest j1.6 among all tested CoNiP catalysts. The outstanding OER performance of CoNi1.5P is comparable or even superior to previously reported NiCoP@Cu3P/CF,22 NiCoP/NC polyhedral nanocages,18 h-CoNiP/rGO45 and so on (Table S1†). Tafel slope of CoNi1.5P is ∼76 mV dec−1, very close to that of the RuO2 (81 mV dec−1) and smaller than those of CoP and other CoNiP catalysts (Fig. 4c). Also, CoNi1.5P has a smaller semicircle than other samples in EIS Nyquist diagrams (Fig. S9†), indicative of its low electron-transfer resistance.
Besides the satisfactory OER activity, CoNi1.5P also shows good OER stability. After continuously tested CV for 1000 cycles, the LSV curve of CoNi1.5P did not changed dramatically: the current density at 1.6 V still preserves 92% of the initial value (Fig. 4d). The stability of CoNi1.5P was also evaluated by chronoamperometry measurement (inset in Fig. 4d). The current density increases gradually in the first 2 h and then can preserve 93% of the initial value after 10 h, providing reliable evidence for the excellent durability of CoNi1.5P. During the measurement, the initial current density increases because of the activation of CoNi1.5P, which may expose more active site by an electrochemical de-phosphorization/oxidation.46–49 The electrochemical surface areas (ECSAs) also were estimated from the calculation of electrochemical double layer capacitances (Cdl) (Fig. S10†). Clearly, the Cdl values for CoNi0.8P, CoNi1.5P, CoNi2.2P and CoNi3.5P are 33, 39, 43 and 49 mF cm−2, respectively. The calculated ECSAs of all CoNiP do not have a big differences, which may be attributed to the similarity of their structures. Therefore, ECSAs cannot explain why CoNi1.5P has enhanced electro-catalytic performance different from other CoNiP.
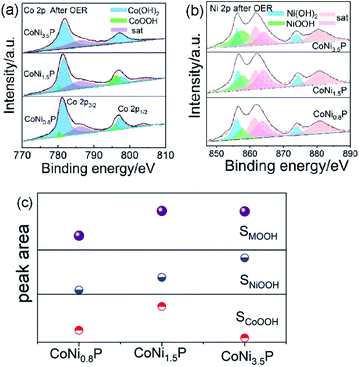
The XPS spectra of CoNi1.5P after 10 h OER test are shown in Fig. S11.† After OER test, in Co 2p (Fig. S11a†), Ni 2p (Fig. S11b†) and P 2p (Fig. S11c†) regions of XPS spectra, the peaks assigned to the Co–P, Ni–P and M–P are disappeared, indicating that the surface of initial CoNi1.5P was oxidized into new oxyhydroxide species.50 Since the OER activity of CoNiP originates from NiOOH, CoOOH, or both, the amounts of NiOOH and CoOOH must play a crucial role. How does the Ni/Co atomic ratio, y/x, affect the amounts of NiOOH and CoOOH is a key issue. Therefore, we investigated the chemical states of CoNi0.8P and CoNi3.5P after OER test (Fig. 5). The Co 2p binding energies were deconvoluted so as to study the oxidation states of Co atoms (Fig. 5a). The binding energies appear at 779.9 and 796.2 eV for CoOOH (green area), 781.5 and 797.6 eV for Co(OH)2, (blue area), and 785.9 and 803.9 eV for satellites of Co species (purple area).35,36 Theoretically, as the content of Co decreases from CoNi0.8P to CoNi3.5P, the amount of formed CoOOH should be decreased, and the amount of NiOOH would get the maximum when the Ni/Co atomic ratio is 3.5. While, in the experimental, the amount of CoOOH in the experimental first increases (0 < y/x < 1.5) and then decreases (1.5 < y/x < 3.5) (Fig. 5c). This inconsistence between experimental result and theoretical prediction may be due to the CoNi1.5P (composed of CoNiP and Co2P) with higher cobalt content than CoNi0.8P (composed of CoNiP and CoP), leading to the formation of more CoOOH active sites.20,31,40 The amount of CoOOH is negligible in CoNi3.5P, indicating the higher Ni content mitigates the formation of CoOOH species, owing to the lower electronegativity of Co (1.88) than Ni (1.91).51 Additionally, according to Ni XPS spectra (Fig. 5b), the amount of NiOOH increases with the increase of the Ni/Co atomic ratio (i.e., y/x), and reaches a maximum at y/x = 3.5. If only the NiOOH species serve as active sites, CoNi3.5P contains maximum NiOOH and should have exhibited the best OER activity. However, in fact, CoNi3.5P is the worst catalyst among three CoNiP catalysts. According to Fig. 5, the total content of MOOH reaches its maximum value when the Ni/Co atomic ratio is 1.5. Therefore, we can reasonably conclude that both NiOOH and CoOOH serve as active sites and together contribute for the OER activity.
Conclusions
We have identified the electrocatalytic active sites of binary cobalt and nickel phosphides towards OER by using CoNiP nanocage as a model catalyst, established the correlation between the composition and the OER activity, and clarified the composition-dependence of the CoOOH and NiOOH activity. With the increase of the Ni/Co atomic ratio (y/x), the formation amount of CoOOH first increases (0 < y/x < 1.5) and then decreases (1.5 < y/x < 3.5); However, the amount of the NiOOH increases continuously. Furthermore, CoNi1.5P nanocages exhibit the best OER performance with an overpotential of 278 mV at a current density of 10 mA cm−2 and a low Tafel slope of 67 mV dec−1, and remain 93% of the initial current density after 10 h OER run, showing excellent durability. This study indicates that both NiOOH and CoOOH serve as active sites and together contribute for the OER activity, which not only provides the guidance for designing high-efficiency CoNiP, also gains more insight into the origins of the catalytic activity.Conflicts of interest
There are no conflicts to declare.Acknowledgements
This work was supported by National Natural Science Foundation of China (21872048 and 21703013).Notes and references
- N.-T. Suen, S.-F. Hung, Q. Quan, N. Zhang, Y.-J. Xu and H. M. Chen, Chem. Soc. Rev., 2017, 46, 337–365 RSC.
- S. Ghosh and R. N. Basu, Nanoscale, 2018, 10, 11241–11280 RSC.
- N. Xu, Y. Zhang, T. Zhang, Y. Liu and J. Qiao, Nano Energy, 2019, 57, 176–185 CrossRef CAS.
- X. Peng, L. Zhang, Z. Chen, L. Zhong, D. Zhao, X. Chi, X. Zhao, L. Li, X. Lu, K. Leng, C. Liu, W. Liu, W. Tang and K. P. Loh, Adv. Mater., 2019, 31, 1900341 CrossRef.
- L. Dong, X. Ma, Y. Li, L. Zhao, W. Liu, J. Cheng, C. Xu, B. Li, Q.-H. Yang and F. Kang, Energy Storage Mater., 2018, 13, 96–102 CrossRef.
- J. Kibsgaard and I. Chorkendorff, Nat. Energy, 2019, 4, 430–433 CrossRef.
- Y. Lee, J. Suntivich, K. J. May, E. E. Perry and Y. Shao-Horn, J. Phys. Chem. Lett., 2012, 3, 399–404 CrossRef CAS.
- Y. Pi, N. Zhang, S. Guo, J. Guo and X. Huang, Nano Lett., 2016, 16, 4424–4430 CrossRef CAS.
- J. Ryu, N. Jung, J. H. Jang, H.-J. Kim and S. J. Yoo, ACS Catal., 2015, 5, 4066–4074 CrossRef CAS.
- Z. Jin, P. Li and D. Xiao, Green Chem., 2016, 18, 1459–1464 RSC.
- B. You, N. Jiang, M. Sheng, S. Gul, J. Yano and Y. Sun, Chem. Mater., 2015, 27, 7636–7642 CrossRef CAS.
- L. Jiao, Y.-X. Zhou and H.-L. Jiang, Chem. Sci., 2016, 7, 1690–1695 RSC.
- Z. Li, X. Dou, Y. Zhao and C. Wu, Inorg. Chem. Front., 2016, 3, 1021–1027 RSC.
- P. W. Menezes, A. Indra, C. Das, C. Walter, C. Göbel, V. Gutkin, D. Schmeiβer and M. Driess, ACS Catal., 2017, 7, 103–109 CrossRef CAS.
- M. Ledendecker, S. Krick Calderón, C. Papp, H.-P. Steinrück, M. Antonietti and M. Shalom, Angew. Chem., 2015, 127, 12538–12542 CrossRef.
- X. Wang, W. Li, D. Xiong and L. Liu, J. Mater. Chem. A, 2016, 4, 5639–5646 RSC.
- B. Qiu, L. Cai, Y. Wang, Z. Lin, Y. Zuo, M. Wang and Y. Chai, Adv. Funct. Mater., 2018, 28, 1706008 CrossRef.
- X. Zhang, L. Huang, Q. Wang and S. Dong, J. Mater. Chem. A, 2017, 5, 18839–18844 RSC.
- J. Li, M. Yan, X. Zhou, Z.-Q. Huang, Z. Xia, C.-R. Chang, Y. Ma and Y. Qu, Adv. Funct. Mater., 2016, 26, 6785–6796 CrossRef CAS.
- Y. Zhao, G. Fan, L. Yang, Y. Lin and F. Li, Nanoscale, 2018, 10, 13555–13564 RSC.
- P. He, X.-Y. Yu and X. W. Lou, Angew. Chem., Int. Ed., 2017, 56, 3897–3900 CrossRef CAS.
- X. Ma, Y. Chang, Z. Zhang and J. Tang, J. Mater. Chem. A, 2018, 6, 2100–2106 RSC.
- Z. Yin, C. Zhu, C. Li, S. Zhang, X. Zhang and Y. Chen, Nanoscale, 2016, 8, 19129–19138 RSC.
- X. Xiao, C.-T. He, S. Zhao, J. Li, W. Lin, Z. Yuan, Q. Zhang, S. Wang, L. Dai and D. Yu, Energy Environ. Sci., 2017, 10, 893–899 RSC.
- J. Kibsgaard, C. Tsai, K. Chan, J. D. Benck, J. K. Nørskov, F. Abild-Pedersen and T. F. Jaramillo, Energy Environ. Sci., 2015, 8, 3022–3029 RSC.
- Y. Li, H. Zhang, M. Jiang, Y. Kuang, X. Sun and X. Duan, Nano Res., 2016, 9, 2251–2259 CrossRef CAS.
- S. Surendran, S. Shanmugapriya, A. Sivanantham, S. Shanmugam and R. Kalai Selvan, Adv. Energy Mater., 2018, 8, 1800555 CrossRef.
- C. Du, L. Yang, F. Yang, G. Cheng and W. Luo, ACS Catal., 2017, 7, 4131–4137 CrossRef CAS.
- X. Liang, B. Zheng, L. Chen, J. Zhang, Z. Zhuang and B. Chen, ACS Appl. Mater. Interfaces, 2017, 9, 23222–23229 CrossRef CAS.
- R. Zhang, X. Wang, S. Yu, T. Wen, X. Zhu, F. Yang, X. Sun, X. Wang and W. Hu, Adv. Mater., 2017, 29, 1605502 CrossRef.
- J. Xu, J. Li, D. Xiong, B. Zhang, Y. Liu, K.-H. Wu, I. Amorim, W. Li and L. Liu, Chem. Sci., 2018, 9, 3470–3476 RSC.
- H.-Y. Wang, Y.-Y. Hsu, R. Chen, T.-S. Chan, H. M. Chen and B. Liu, Adv. Energy Mater., 2015, 5, 1500091 CrossRef.
- Z. Lv, Q. Zhong and Y. Bu, Electrochim. Acta, 2016, 215, 500–505 CrossRef CAS.
- Z. Jiang, Z. Li, Z. Qin, H. Sun, X. Jiao and D. Chen, Nanoscale, 2013, 5, 11770–11775 RSC.
- C. Xia, Q. Jiang, C. Zhao, M. N. Hedhili and H. N. Alshareef, Adv. Mater., 2015, 28, 77–85 CrossRef.
- Y. Li, J. Liu, C. Chen, X. Zhang and J. Chen, ACS Appl. Mater. Interfaces, 2017, 9, 5982–5991 CrossRef CAS.
- T. I. Korányi, Appl. Catal., A, 2003, 239, 253–267 CrossRef.
- R. Ye, P. del Angel-Vicente, Y. Liu, M. J. Arellano-Jimenez, Z. Peng, T. Wang, Y. Li, B. I. Yakobson, S.-H. Wei, M. J. Yacaman and J. M. Tour, Adv. Mater., 2016, 28, 1427–1432 CrossRef CAS.
- B. Qiu, Q. Zhu, M. Xing and J. Zhang, Chem. Commun., 2017, 53, 897–900 RSC.
- M. Wang, L. Fan, D. Tian, X. Wu, Y. Qiu, C. Zhao, B. Guan, Y. Wang, N. Zhang and K. Sun, ACS Energy Lett., 2018, 3, 1627–1633 CrossRef CAS.
- E. J. Popczun, J. R. McKone, C. G. Read, A. J. Biacchi, A. M. Wiltrout, N. S. Lewis and R. E. Schaak, J. Am. Chem. Soc., 2013, 135, 9267–9270 CrossRef CAS.
- L.-A. Stern, L. Feng, F. Song and X. Hu, Energy Environ. Sci., 2015, 8, 2347–2351 RSC.
- L. Trotochaud, J. K. Ranney, K. N. Williams and S. W. Boettcher, J. Am. Chem. Soc., 2012, 134, 17253–17261 CrossRef CAS.
- R. D. L. Smith, M. S. Prévot, R. D. Fagan, S. Trudel and C. P. Berlinguette, J. Am. Chem. Soc., 2013, 135, 11580–11586 CrossRef CAS.
- L. Ye and Z. Wen, Electrochem. Commun., 2017, 83, 85–89 CrossRef CAS.
- A. T. Swesi, J. Masud and M. Nath, Energy Environ. Sci., 2016, 9, 1771–1782 RSC.
- C. Tang, N. Cheng, Z. Pu, W. Xing and X. Sun, Angew. Chem., Int. Ed., 2015, 54, 9351–9355 CrossRef CAS.
- Y. Tan, H. Wang, P. Liu, Y. Shen, C. Cheng, A. Hirata, T. Fujita, Z. Tang and M. Chen, Energy Environ. Sci., 2016, 9, 2257–2261 RSC.
- J. Xu, X.-K. Wei, J. D. Costa, J. L. Lado, B. Owens-Baird, L. P. L. Gonçalves, S. P. S. Fernandes, M. Heggen, D. Y. Petrovykh, R. E. Dunin-Borkowski, K. Kovnir and Y. V. Kolen’ko, ACS Catal., 2017, 7, 5450–5455 CrossRef CAS.
- J. Xu, J. Li, D. Xiong, B. Zhang, Y. Liu, K.-H. Wu, I. Amorim, W. Li and L. Liu, Chem. Sci., 2018, 9, 3470–3476 RSC.
- D. V. Louzguine and A. Inoue, Appl. Phys. Lett., 2001, 79, 3410–3412 CrossRef CAS.
Footnote |
| † Electronic supplementary information (ESI) available. See DOI: 10.1039/d0ra07284b |
| This journal is © The Royal Society of Chemistry 2020 |

