 Open Access Article
Electronucleation mechanism of copper in wastewater by controlled electrodeposition analysis
Shuzhi Diao ,
Yiyong Wang* and
Hui Jin
School of Materials & Metallurgy, University, of Science and Technology Liaoning, Anshan 114051, China. E-mail: Diaoshuzhi123@163.com
First published on 21st October 2020
Abstract
In order to improve the efficiency of copper deposition in wastewater containing the surfactant polyvinylpyrrolidone (PVP) and reveal the mechanism of copper crystals, a controlled electrodeposition process was developed using a low-cost stainless steel cathode and investigated using chronoamperometry (CA), electrochemical impedance spectroscopy (EIS) and infrared spectroscopy (IR). The theoretical analysis was verified by fitting them to experimental curves and calculating the kinetic parameters of the deposition process. The experimental results showed that Cu(PVP)2 was formed by the reaction between the C![[double bond, length as m-dash]](https://www.rsc.org/images/entities/char_e001.gif) O bond of PVP and Cu2+. When powdered, reduction of Cu2+ in the Cu(PVP)2 structure was promoted, a positively-charged PVP-coating layer was formed on the surface of the copper crystal nuclei to inhibit the growth of the copper powder. At a potential of −0.2 V, the electrodeposition crystallization curve of copper changed from progressive nucleation to instantaneous nucleation. The kinetic parameters of the deposition process were calculated by fitting the experimental curves to verify the correctness of the theoretical analysis. The EIS tests showed that removing the powder reduced the resistance of the organic solvent (PVP) film on the electrode surface and the charge transfer resistance during copper deposition. According to particle size analysis, removing the powder could reduce the growth energy of copper powder on the electrode surface, increase the area of the active part on the electrode surface, increase the current efficiency of copper powder to 84.2%, and control dust. The size of copper powder reached up to around 900 nm.
O bond of PVP and Cu2+. When powdered, reduction of Cu2+ in the Cu(PVP)2 structure was promoted, a positively-charged PVP-coating layer was formed on the surface of the copper crystal nuclei to inhibit the growth of the copper powder. At a potential of −0.2 V, the electrodeposition crystallization curve of copper changed from progressive nucleation to instantaneous nucleation. The kinetic parameters of the deposition process were calculated by fitting the experimental curves to verify the correctness of the theoretical analysis. The EIS tests showed that removing the powder reduced the resistance of the organic solvent (PVP) film on the electrode surface and the charge transfer resistance during copper deposition. According to particle size analysis, removing the powder could reduce the growth energy of copper powder on the electrode surface, increase the area of the active part on the electrode surface, increase the current efficiency of copper powder to 84.2%, and control dust. The size of copper powder reached up to around 900 nm.
Introduction
The presence of copper ions in wastewater poses a threat to human health and the environment. Therefore, recycling the copper ions in wastewater not only protects human health, but also achieves the effect of wastewater recycling. The currently used technologies for removing copper mainly include chemical precipitation, ion exchange and electrolytic processes.1–3 Chemical precipitation produces a large amount of sludge, resulting in sludge disposal problems. Ion exchange can effectively recover the copper ions, but the high cost limits its application. The electrolysis technology has the advantage of recovering copper ions without secondary treatments. The mass transfer rate of copper ions from the solution to the cathode is very important for the electrolytic recovery of copper. However, the copper ion transfer rate in dilute solutions is low, and with an increase in the electrodeposition time, copper is adsorbed on the cathode surface, reducing the current efficiency. In order to improve the current efficiency of copper powder, many types of electrolytic reactors, including fluidized-bed electrolytic cells,4 rotating packed cells,5 progressive stirring method, controllable electrochemical recovery process,6,7 have been developed. Although these reactors can improve the mass transfer rate of metal ions, the reduction in current efficiency caused by the copper powder layer adsorbed on the electrode surface cannot be solved.Surfactants (anionic or nonionic) are commonly used in copper-related electroplating, electrolytic deposition, and printed-circuit-board manufacturing industries to improve the physical and chemical properties of the copper deposits.8–10 Therefore, industrial wastewater discharge usually contains copper ions and surfactants. However, the presence of surfactants in wastewater affects the recovery of copper ions. Especially anionic surfactants, which are composed of charged hydrophilic parts, can statically attract the positively charged copper ions, thereby interfering with the electrolytic recovery of copper.11–13 In addition, if the non-ionic surfactants in the wastewater coexist with anionic surfactants, they attract each other through their hydrophobic tails. A mixture of anionic and non-ionic surfactants affects nucleation and crystal growth in copper electrocrystallization, which largely determines the physical and chemical properties of copper ion electrodeposition.14–16 Therefore, it is of great significance to study the influence of surfactants on Cu electrodeposition and the electrocrystallization process. Although the above studies show the influence of additives on the process of copper electro crystallization, the kinetics of the nucleation process is not clear. However, the additives react with Cu during the electrodeposition process and affect the electrodeposition behavior. Furthermore, the complex ionic reaction between the additive and Cu2+ has not been detected directly.
In this paper, a new type of powder removal reactor was developed to analyze the effect of the powder removal process on the electrocrystallization behavior of copper, and the surface morphology and microstructure of the copper powder were characterized by scanning electron microscopy and X-ray diffraction. Infrared spectroscopy was used to investigate the functional group changes in PVP during Cu electrodeposition and to speculate the reaction mechanism. Cathode linear sweep voltammetry (LSV), chronoamperometry (CA) and other electrochemical test methods were used to record the electrocrystallization behavior of Cu. Finally, the nucleation process was simulated using an optimization algorithm, the kinetic parameters in the electrochemical reaction were calculated, and the mechanism of copper nucleation on the surface of the cathode during powder removal was explained.
Experimental section
Materials
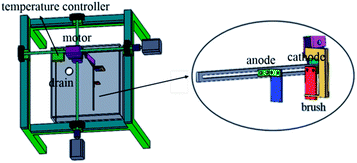
The copper powder was prepared by electrodeposition in an acid sulfate solution. The chemical reagents used in the preparation of the synthetic solutions used in this study were all of analytical grade purity. The components of the electrolyte were CuSO4·5H2O 50 g L−1, H2SO4 24.5 g L−1, and PVP 1 g L−1, and the temperature was 40 °C. In the electrolytic process, a stainless steel plate with a size of 20 mm × 20 mm × 2 mm was used as the cathode, and graphite was the anode. The electrolytic equipment is shown in Fig. 1. In the electrodeposition process, the control panel was used to control the rotation of the motor, the motion of the connecting rod on the cathode was controlled through the rotation of the motor, and thus the electrodeposition process was controlled. In addition, a thermostat was used to keep the electrolyte temperature constant.Methods
Before the electrolysis experiment, the stainless steel plates were polished with sandpaper to obtain a smooth surface of different particle sizes, degreased with ethanol, and then washed with distilled water. An RDX high-frequency DC power supply was used for the electrodeposition experiments. The current density was adjusted to 10 A dm−2, and the deposition time was 120 minutes. The electrolyzed samples were washed with distilled water and ethanol, ultrasonically dispersed for 30 minutes, and finally placed in a vacuum drying box to dry.The traditional three-electrode battery was used in the electrochemical experiment. The three electrodes were: Pt as the counter electrode, saturated calomel as the reference electrode, and stainless steel rod as the working electrode (the experimental area was 1 cm2). The cathode polarization curve was scanned from 0 V and scanned at a speed of 50 mV in the negative direction to observe the curve changes. The timing current method was employed to scan at the corresponding step potentials for 90 s to observe the change in current density with time. An Agilent Technologies Cary 630 FTIR was used to detect the chemical bonds and molecular structures in the samples: PVP and PVP/Cu electrolyte. The phase structure of the powder was analyzed by an OXFORD X-Max 50 m2 X-ray spectrometer (EDS). Finally, the Carl Zeiss-ΣIGMAHD type field emission scanning electron microscope (SEM) was used to observe the surface morphology of the copper powder. Finally, the particle size of the copper powder was analyzed using the Bettersize 2600 laser particle size analyzer, and the particle size distribution curve was drawn by D50.
Results and discussion
Current efficiency
In order to analyze the effect of the powder removal process on the current efficiency of the copper powder, the current efficiency was calculated by eqn (1),10 and the corresponding curves of copper electrodeposition time and current efficiency were obtained, as shown in Fig. 2.
 | (1) |
![[thin space (1/6-em)]](https://www.rsc.org/images/entities/char_2009.gif) 485C is the Faraday constant, n is the number of electrons transferred, m and M are the corresponding weight and molar mass of the deposits, respectively, i and t are the current and electrodeposition time, respectively.
485C is the Faraday constant, n is the number of electrons transferred, m and M are the corresponding weight and molar mass of the deposits, respectively, i and t are the current and electrodeposition time, respectively.
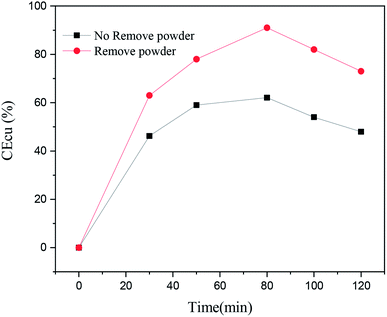 | ||
| Fig. 2 Current density of copper under different electrolytic conditions and different electrodeposition times. | ||
As seen in Fig. 2, the current efficiency of copper increased from 63% to 84% with the process of powder removal, mainly because the adsorption of copper powder on the cathode surface was less and the area of active sites on the electrode surface was increased.
Linear sweep voltammetry (LSV)
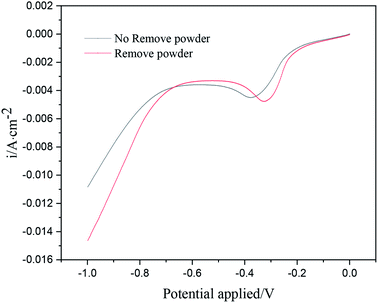
Fig. 3 shows the linear sweep voltammetry curves of copper under different electrolytic conditions. When the powder removal process was not performed, the initial deposition potential of copper on the cathode surface was about −0.18 V. When the powder removal process was performed, the initial copper deposition potential in the electrolyte was about −0.15 V. Thus, the initial potential of copper deposition in the electrolyte was positively shifted by powder removal, and the cathode polarization was reduced. The reason for the positive shift of the reduction potential is the adsorption of PVP on the electrode surface. During powder removal, the adsorption of PVP and copper on the cathode surface was reduced, and the area of active sites on the electrode surface was increased. This adsorption behavior is consistent with that reported in the literature.17,18 In addition, during powder removal, when the potential range was 0 ∼−0.33 V, the current density of the curve was observed to increase significantly, indicating that a large number of Cu2+ ions in the electrolyte were electrochemically reduced. This range was dominated by electrochemical control, and the range above −0.33 V was led by diffusion control. When the powder removal treatment was not carried out, in the potential range of 0 ∼−0.38 V, the current density of the curve also increased significantly, indicating that this range was dominated by electrochemical control, and after −0.38 V, it was a diffusion-controlled process.Cyclic voltammetry (CV)
Under different electrolytic conditions, the cyclic voltammetry curves were obtained at different scanning speeds, as shown in Fig. 4. With an increase in the scanning speed, the peak current density of the reaction increased, and the peak potential shifted positively. The cyclic voltammetry curves at different scanning speeds showed the same trend as that of the solution system without powder removal, whereas the reaction peak current density after the powder removal treatment was greater than that of the system without powder removal at the same scan speed. This showed that the powder removal treatment reduced the adsorption of copper on the cathode surface and promoted the copper electrodeposition process. According to the Randles–Sevcik formula,19,20 the relationship between the peak current and the square root of the scan rate is given by:
 | (2) |
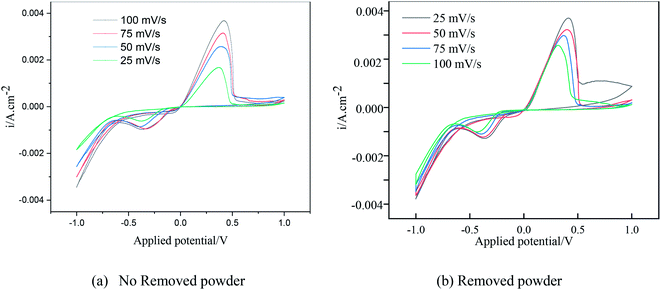 | ||
| Fig. 4 Cyclic voltammetry curves under different electrolytic conditions at different scanning speeds. | ||
In this formula, A is the area of the electrode, cm2; D is the diffusion coefficient of Cu2+, m2 s−1; C is the concentration of Cu2+ in the solution system, g L−1; v is the scan rate, V s−1; R is the gas constant, 8.314 J (mol−1 K−1); T is the temperature, K; n is the number of reaction electrons; F is the Faraday constant, 96![[thin space (1/6-em)]](https://www.rsc.org/images/entities/char_2009.gif) 485C; Im is the cathode peak current. At a temperature of 25 °C, the peak current density and peak potential of the passed cyclic voltammetry are calculated as Im − v1/2. As shown in Fig. 5, a straight line with a good linear fit could be obtained. The result showed that the copper electrodeposition process was a reaction controlled by diffusion.
485C; Im is the cathode peak current. At a temperature of 25 °C, the peak current density and peak potential of the passed cyclic voltammetry are calculated as Im − v1/2. As shown in Fig. 5, a straight line with a good linear fit could be obtained. The result showed that the copper electrodeposition process was a reaction controlled by diffusion.
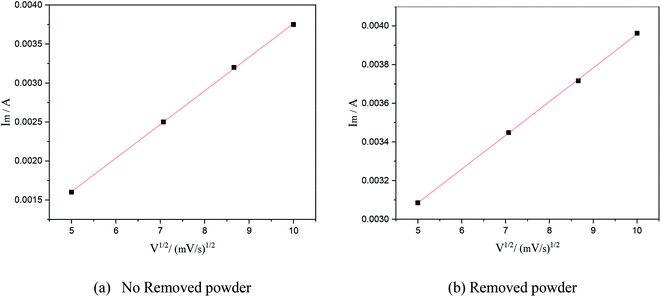 | ||
| Fig. 5 The relationship between the square root of the scanning speed and peak current under different electrolytic conditions. | ||
Chronoamperometry study
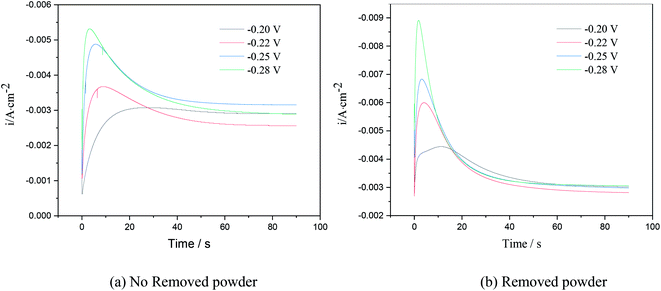
Chronoamperometry is an effective way to study the nucleation model of metals in an electro-crystallization process.21 Fig. 4 shows the chronoamperometry curves of copper at different step potentials in electrolytes with different surfactants. The step potential ranged from −0.2 V to −0.28 V.The I–t curves in Fig. 6 show 3D nucleation characteristics controlled by diffusion.22 The I–t curves could be divided into three parts. The first part near the longitudinal axis showing a decline in current density corresponded to the charge of the electric double layer on the electrode surface. In the second part, the current density gradually increased and reached the maximum value, which is typical of the crystal nucleation/growth process; the cathodic current density gradually decreased because of the diffusion of deposits from the electrolyte to the electrode/solution interface in the third part.23–25
As seen in the I–t curve in Fig. 6, as the step potential increased, the peak current gradually increased, and the time for the peak current to appear shortened, the nucleation relaxation time decreased, and the nucleation rate increased. This is because, when the step potential was increased, the charging time of the electric double layer reduced, and the active nucleation sites on the electrode surface increased, which is beneficial to the electrocrystallization nucleation. According to Fig. 6, when the applied step potential was the same, the peak current of the I–t curve of copper was smaller, and the nucleation relaxation time was longer without powder removal. The possible reason is that PVP in the electrolyte solution adsorbs on the cathode surface, reduces the active site energy on the cathode surface, and slows down the nucleation rate of copper. However, the nucleation rate of copper was relatively high when the powder was removed, which may be due to the destruction of the organic adsorption layer on the electrode surface, an increase in the mass transfer of copper ions to the cathode surface and an increase in the number of discharge ions. At the same time, due to the principle of minimum energy, PVP wraps around the surface of copper powder,23 reducing the amount of copper powder adsorbed on the cathode surface, which is equivalent to increasing the active site on the cathode surface, leading to an increase in peak current.
In order to further explore the effect of PVP on the crystallization process in the early stage of electrodeposition, the I–t curves of copper electrodeposition on the electrode surface at different step potentials were obtained according to the formulae for (3) progressive nucleation and (4) instantaneous nucleation:21
 | (3) |
 | (4) |
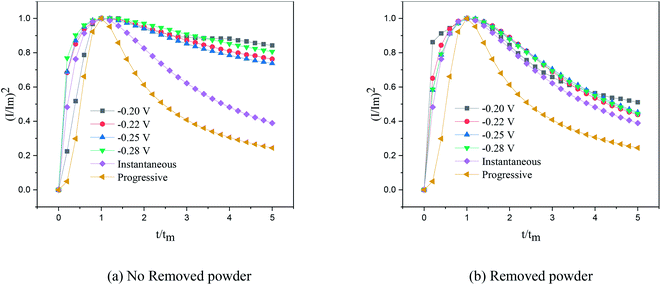
According to the dimensionless (I/Im)2 ∼ t/tm experimental curves of copper electrocrystallization at different step potentials shown in Fig. 7(a), at the potential of −0.20 V, the dimensionless curve of copper electrocrystallization shifted towards progressive nucleation. However, the dimensionless curves of the electrocrystallization of copper in the potential range of −0.22 to −0.28 V were close to the instantaneous nucleation curve. The reason for this phenomenon is that the energy of the active sites on the substrate surface is different, and the overpotential required for deposition at the active sites with different energies is different. When the potential is low, the nucleation growth of copper at the active site with low energy was slow, and the non-dimensional curve of copper tends towards progressive nucleation; when the potential is high, the active sites with low energy are activated, and the nucleation of copper tends to be instantaneous. It can be seen from Fig. 7 (b) that when the powder removal treatment was performed, the electric crystal nucleation of copper was near-instantaneous in the potential region of −0.2 V to −0.28 V. The main reason is that copper ions react with PVP to form a Cu(PVP)2 structure,24 which suppresses the reduction of copper on the electrode surface. When the powder removal treatment was performed, the flow of Cu(PVP)2 to the cathode increased, and the reduction of copper ions on the electrode surface increased. Powder removal could also reduce the adsorption of surfactant and copper powder on the electrode surface, reducing energy for copper powder growth on the electrode surface and increasing the energy of the nucleation sites on the cathode surface, thereby accelerating the nucleation process of the copper powder. When t/tm > 1, the experimental curve deviated from the dimensionless theoretical curve for instantaneous nucleation to some extent. This is because the theoretical models for instantaneous nucleation and gradual nucleation are deduced on the premise that the substrate surface for the electrochemical reaction is smooth, and that the process of nucleation/growth occurs by the overlapping of the crystal nuclei. However, there are dislocations and scratches on the actual copper electrode surface, which provide additional electrochemical reaction area for the electric crystallization nucleation, leading to a decline in current density with time. When the deceleration is lower than the theoretical value, the experimental curve deviates from the theoretical curve.
Previous research shows that the electrocrystallization of copper under different electrolytic conditions follows the 3D instantaneous nucleation theoretical model of Scharifker. Therefore, the theoretical formulae (3) and (4) for 3D instantaneous nucleation were used to calculate the ion diffusion coefficient D and the nucleation density number N during the electrocrystallization process. A comparison of the calculated diffusion coefficient D and nucleation density N values is shown in Table 1. It can be seen from Table 1 that, at the same potential, the nucleation rate of copper powder was very low without the powder removal treatment, which proves that Cu(PVP)2 formed from PVP and the copper ions reduced the energy of the active region on the electrode surface and suppressed the early nucleation process of electrocrystallization. When the powder was removed, the adsorption layer and surfactant around the copper powder on the electrode surface were destroyed, thereby increasing the flow of Cu(PVP)2-containing copper ions to the cathode, which increases the nucleation rate of the copper powder and increases the diffusion coefficient of the ions in the solution.
| Processing method | Potential/V | tm (s) | Im (mA cm−2) | D (cm2 s−1 × 10⁴) | N0 (cm−2 × 10⁵) | A (s−1) |
|---|---|---|---|---|---|---|
| No remove | −0.28 V | 3.468 | −5.29 | 2.96 | 0.92 | 59.90 |
| No remove | −0.22 V | 8.584 | −3.67 | 2.06 | 0.35 | 6.05 |
| Remove | −0.28 V | 1.91 | −8.80 | 5.62 | 9.65 | 84.25 |
| Remove | −0.22 V | 4.15 | −5.99 | 4.22 | 4.77 | 42.56 |
The nucleation/growth process of metal ions on the electrode surface and the reduction of hydrogen ions occur simultaneously. These may be the reasons for the deviation between the experimental curve and the theoretical curve. Therefore, in the analysis of the I–t curves, crystallization nucleation and the hydrogen evolution reaction should be considered simultaneously. Scharifker and Palomar-Pardave and others have also reached such conclusions and proposed the formulae for total current density and nucleation parameters during electrodeposition (5–11). In order to calculate the kinetic parameters of electrodeposition by nonlinear fitting (Marquardt–Levenberg algorithm), the formulae were simplified, and the coefficient of t was assigned. The parameters  , P2, P3, and P4 were given different initial values during the nonlinear fitting process to get the best fitting curve:17,25,26
 | (5) |
 | (6) |
| P1 = ZPRFKPR | (7) |
| P2 = N0πKD | (8) |
| P3 = A | (9) |
 | (10) |
 | (11) |
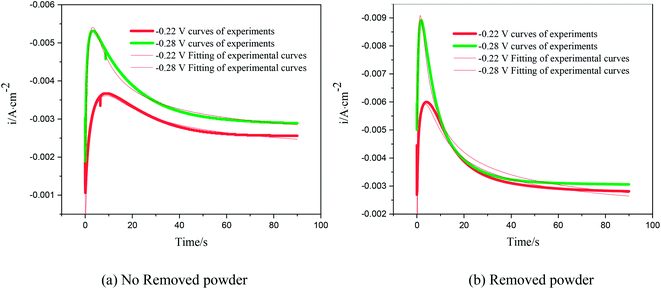
The nucleation kinetic parameters  , P2, P3, P4 were calculated by the nonlinear fitting of the I–t curves using formula (4).26 Fig. 8 shows the non-linear fitting results of the experimental curves and the theoretical curves under different step potentials. The fitted curves and the experimental curves had a higher degree of fit. The experimental curves were analyzed by fitting the data. The kinetic parameters are shown in Table 2. It can be seen from Tables 1 and 2 that the calculation results based on the Scharifker model and Palomar-Pardave model were consistent. Therefore, the calculation results are reliable, and the theoretical analysis is correct.
 , P2, P3, and P4 are intermediate parameters for simplified processing
| Processing method | Potential/V | (μA cm−2) × 10−3 | P2 (s−1) | P3 (s−1) | P4 (μA cm−2) | A (s−1) | D (cm2 s−1 × 10⁴) | N0 (cm−2 × 10⁵) |
|---|---|---|---|---|---|---|---|---|
| No remove | −0.28 V | 0.193 | 0.62 | 63.56 | 0.063 | 63.56 | 3.21 | 0.97 |
| No remove | −0.22 V | 0.063 | 0.35 | 9.65 | 0.086 | 9.65 | 2.18 | 0.42 |
| Remove | −0.28 V | 0.154 | 1.53 | 76.32 | 0.013 | 96.32 | 6.18 | 10.78 |
| Remove | −0.22 V | 0.136 | 0.48 | 36.85 | 0.015 | 56.85 | 4.52 | 5.31 |
Electrochemical impedance spectroscopy (EIS) studies
Fig. 9 shows the Nyquist plots of the AC impedance spectra obtained under different electrolytic conditions at a potential of −0.22 V. At the high-frequency end, the capacitive arcs formed approximate semicircles. The results showed that the formation process of copper powder was controlled by charge transfer. The diameter of the semicircle corresponds to the charge transfer resistance of the electrochemical reaction. The larger the value, the greater is the resistance of the electrochemical process, and the slower is the reaction. At the low-frequency end, the curves changed from a semicircle to a straight line representing Warburg impedance with a tilt angle close to 45°, showing the characteristics of diffusion control. These show that the electrodeposition of Cu was controlled by diffusion at a potential of −0.22 V, which is consistent with the experimental results of the polarization curves. The reason for the capacitive arc in the high-frequency region was the surfactant film adsorbed on the electrode surface. The Warburg impedance appeared in the low-frequency region because, with an increase in test time, copper powder appeared on the electrode surface. With the formation of copper powder, the original concentration gradient disappeared. In the interface region, a new concentration gradient layer was formed due to the acceleration of the formation of copper powder,27 which is reflected by the Warburg impedance caused by the diffusion of the copper ions from the inside to the outside of the surfactant film. The Bode diagrams showed that the phase angle decreased during the electrodeposition process with the powder removal process, indicating that the ability of PVP to form a resistance film on the electrode surface was weakened at this time.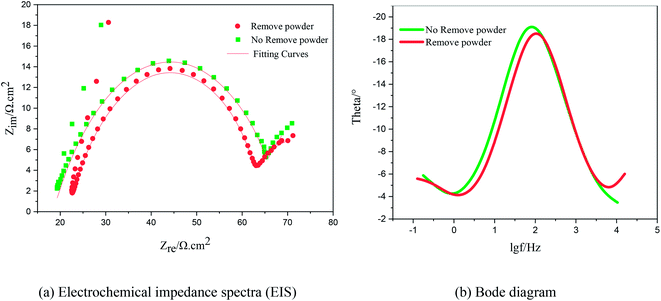 | ||
| Fig. 9 Electrochemical impedance spectra and Bode diagram of copper under the same potential and different electrolytic conditions. (a) Impedance spectra; (b) Bode diagrams. | ||
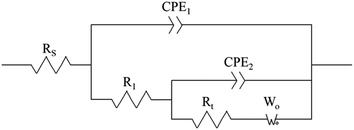
The electrodeposition process is mainly controlled by electrochemical steps, and the equivalent circuit is shown in Fig. 10, where Rs is the solution resistance, R1 is the membrane resistance, CPE2 is the interface capacitance of the PVP membrane, Rt is the transfer resistance, CPE1 is the double-layer capacitance, and Wo is the diffusion process.
It can be seen from Table 3 that when the powder removal treatment was not performed, the electrode charge transfer resistance was large, and the interface capacitance was small. This indicates that the additives had better adsorption-film-forming properties. When the powder removal process was performed, R1 decreased and CPE2 increased. This is because the resistive film was destroyed during powder removal, resulting in voids on the electrode surface film, and the film is not very dense. The fitting calculation results are consistent with the theoretical analysis of the Nyquist spectra.
| Processing method | Potential | Rs/Ω cm−2 | CPE1 × 10−4/F cm−2 | CPE2/F cm−2 | Rt/Ω cm−2 | R1 × 10−5/Ω cm−2 | Wo − R/Ω cm−2 |
|---|---|---|---|---|---|---|---|
| Remove | −0.22 V | 20.05 | 5.30 | 0.10 | 7.8 | 38.92 | 7.69 |
| No remove | −0.22 V | 18.27 | 3.56 | 0.069 | 19.03 | 42.21 | 33.20 |
Infrared spectroscopy (IR)
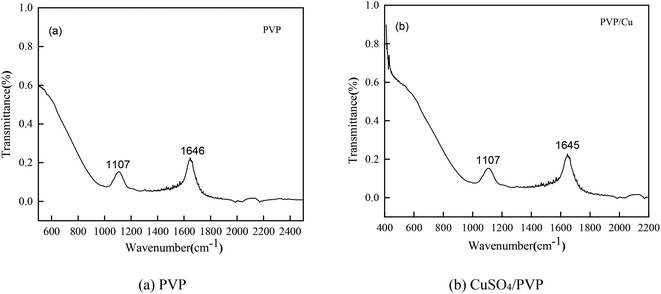
To verify the conclusions in Fig. 8, the FT-IR spectra of the PVP electrolyte and PVP/CuSO4 electrolyte before and after electrolysis were measured (as shown in Fig. 11). As seen in Fig. 11, the characteristic peak values of PVP were obvious. Among them, the absorption peak at 1107 cm−1 corresponding to the stretching vibration of the C–N single bond28 did not shift, indicating that the C–N bond did not participate in the reaction; in Fig. 11(a), the absorption peak of the C![[double bond, length as m-dash]](https://www.rsc.org/images/entities/char_e001.gif) O bond stretching vibration at 1646 cm−1 shows a red-shift phenomenon, which is mainly due to the complex chemical reaction between PVP and Cu2+. The experimental results were in good agreement with Fig. 8. The specific reaction is as follows:
O bond stretching vibration at 1646 cm−1 shows a red-shift phenomenon, which is mainly due to the complex chemical reaction between PVP and Cu2+. The experimental results were in good agreement with Fig. 8. The specific reaction is as follows:
 | (12) |
Micromorphology of copper powder
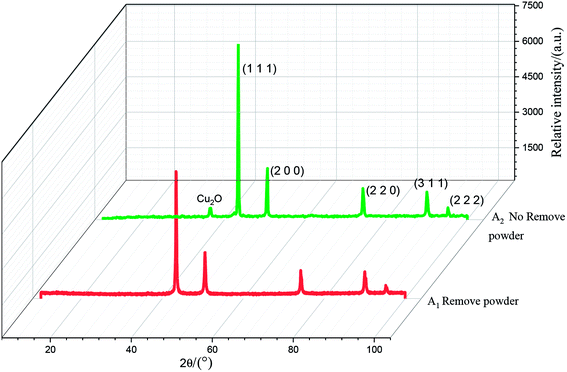
The results of the X-ray diffraction analysis of the copper powder prepared under different conditions are shown in Fig. 12. The sharp diffraction peaks of Cu at 43.61°, 50.71°, 74.35°, 90.12° and 95.32° corresponded to the (1 1 1), (2 0 0), (2 2 0), (3 1 1) and (2 2 2) crystal faces of Cu, respectively, indicating high crystallinity. This shows that the sample with added PVP had high purity and almost no impurity. There was almost no difference between the A1 and A2 spectra, which shows that powder removal did not affect the crystal structure of the Cu particles, but only the morphology and composition of the Cu particles.On comparing the peaks of the A1 and A2 lines, it could be seen that the copper powder mainly composed of the (1 1 1) diffraction surface, which contained more copper. The peak value was higher than those of other peaks, and the growth rate was faster. The Cu2O peak could be observed in the A2 spectrum. This is mainly because PVP is unevenly distributed on the surface of the copper powder when the powder removal treatment is not performed. When the copper powder without PVP coating comes into contact with oxygen, it is oxidized, resulting in the Cu2O peak. It could be observed in the A2 spectrum that the diffraction peak of Cu2O at 36.65° disappeared, and the peak intensity of each crystal surface corresponding to the copper powder decreased. This is mainly due to the fact that, in the process of powder removal, even distribution of PVP in the electrolyte is promoted and Cu2+ can be more evenly adsorbed on the surfactant, preventing its continuous growth and thereby refining the grains.
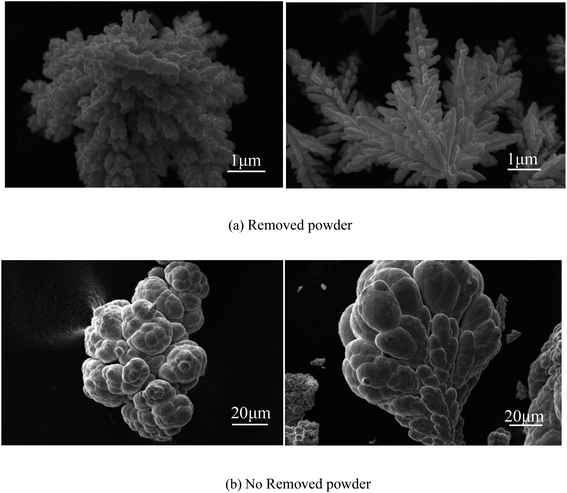
As shown in Fig. 13(a), the SEM image of copper powder during removal indicated that the surface of copper powder was spherical and degenerated dendritic with small particle size. The copper powder was spherical mainly because the surfactant molecules tend to aggregate and form many spherical micelles with a net positive charge to reach its lowest energy level. After electrification, these micelles move toward the cathode, capturing electrons and reducing the Cu2+ ions in the pre-electrode layer. The collision of surfactant molecules with copper atoms causes the electrolyte to coalesce to form a spherical organic coating on the surface of the metal crystal nuclei (see Fig. 14(a)). Because the powder with the coating layer is not adsorbed on the cathode in the process of powder removal (Fig. 14(b)), the copper growth is relatively uniform, which effectively reduces the particle size and improves the morphology to a certain extent. In addition, a small amount of copper powder was dendriform, mainly because it is very difficult for the surfactant to be distributed uniformly in the electrolyte, inevitably resulting in micro areas in the electrolyte lacking the surfactant. Cu2+ ions in these micro areas are not evenly adsorbed on the surfactant, making the copper powder dendriform.23
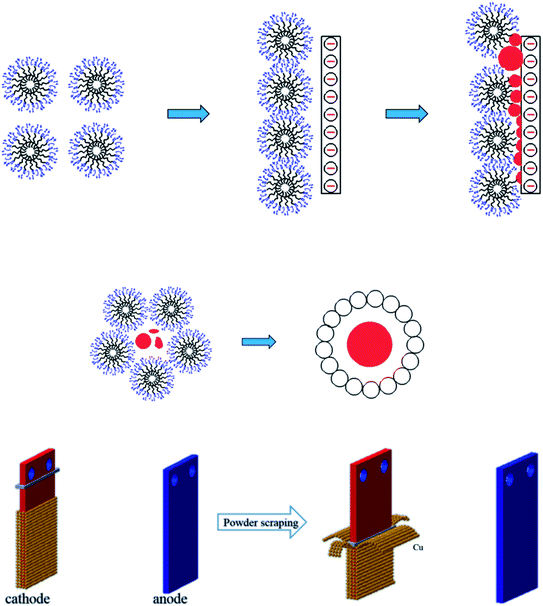 | ||
| Fig. 14 (a) The formation mechanism of copper powder in 0.1 g L−1 PVP electrolyte (b) schematic diagram of the powder removal process. | ||
As shown in Fig. 13(b), the SEM image of copper powder without powder removal revealed that the surface of copper powder was nearly spherical, and the particle size was large. The main reason is that the copper powder adsorbed on the cathode surface does not desorb automatically without the desorption treatment. Because of the high energy on the electrode surface, the copper powder on the electrode surface grows faster, resulting in large particle size.
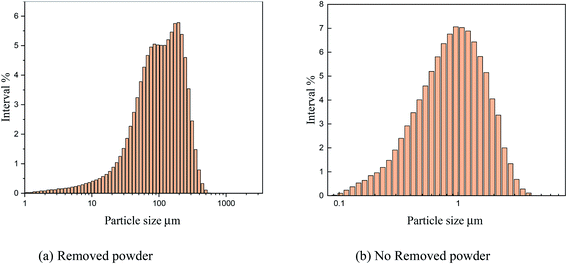
As shown in Fig. 15, the particle size analysis of copper powder revealed that after powder removal, the particle size of copper powder was about 900 nm and relatively uniform. However, without powder removal, the particle size of copper powder was about 100 m larger. The size of the copper powder varied greatly.
The main reason is that without powder removal, the copper powder adsorbed on the electrode surface obtains more energy, and the inhibitory effect of PVP on the copper powder is weak, which cannot prevent the rapid growth of copper powder on the electrode surface. However, when the powder removal treatment was performed, the copper powder was detached from the electrode surface and did not obtain the large amount of energy given by the electrode surface, and thus grew slowly, and the inhibitory effect of PVP on the copper powder was obvious. This is consistent with the theoretical analysis presented in Fig. 12.
Conclusions
(1) The reactor developed in this paper is shown to reduce the adsorption of metal powders and surfactants on the electrode surface, provide additional active reaction area for the deposition of copper ions, make the initial copper deposition potential move forward, and decrease cathode polarization.(2) The infrared spectrum and CA curve show that the Cu(PVP)2 complex formed by the coordination reaction between Cu and PVP could inhibit the electrodeposition of copper during the electrolytic process. When the powder was removed, it promoted the movement of Cu(PVP)2 to the cathode and accelerated the rate of copper nucleation. According to the 3D nucleation model of Scharifker–Hill, with powder removal, the growth energy of copper decreases and the energy of the active nucleation sites on the cathode surface increases, which changes the electrocrystalline curve of copper from gradual nucleation to instantaneous nucleation.
(3) At an applied voltage of −0.2 V, the Nyquist curve of deposited copper is a capacitive arc in the shape of a semicircle at the high-frequency end. At the low-frequency end, the curve changes from a semicircle to a straight line, representing Warburg impedance, with an inclination of nearly 45°. Copper nucleation occurs on the electrode surface. The fitting data of the impedance diagram shows that the resistance of the PVP film on the electrode surface and the charge transfer resistance in the process of copper deposition could be reduced by powder removal, which promotes the electrodeposition of copper.
(4) The particle size analysis during the powder removal process reveals that the energy of copper powder growth on the electrode surface is reduced, the active site area on the electrode surface is increased, and copper powder nucleation is promoted; the current efficiency of copper powder is effectively improved to about 84.2% and the particle size is controlled at 900 nm.
Conflicts of interest
Yiyong Wang is the corresponding author of this article. The ranking order remains unchanged and there is no conflict to declare.Acknowledgements
This research was funded by National Natural Science Foundation of China (51674141); this work was supported by the Natural Science Fund of Liaoning Province (2019-ZD-0278); this research was also funded by University of Science and Technology Liaoning Talent Project Grants (601011507-14). University of Science and Technology Liaoning Graduate Education Reform and Technology Innovation and Entrepreneurship Project (LKDYC201901).References
- L. J. Ye, L. Y. Chai and Q. Z. Li, RSC Adv., 2016, 6, 115 Search PubMed.
- H. Glauninger, Y. Zhang and K. A. Higgins, Chem. Sci., 2018, 9, 105 RSC.
- T. H. Thao, T. H. Hoang, S. Verma and S. Ma, J. Am. Chem. Soc., 2018, 140, 17 Search PubMed.
- K. Jüttner, U. Galla and H. Schmieder, Acta, 2000, 45, 2575–2594 Search PubMed.
- G. Orhan, S. Gürme and S. Timur, J. Hazard. Mater., 2004, 112, 78–86 CrossRef.
- T. Kekesi and M. Isshiki, J. Appl. Electrochem., 1997, 154, D2019 Search PubMed.
- W. Jin and J. L. Su, J. Electrochem. Soc., 2017, 164, 12 Search PubMed.
- Y. J. Mai, M. P. Zhou and H. J. Ling, Appl. Surf. Sci., 2017, 433, 232–239 CrossRef.
- C.-G. Lee, S. Lee and J.-A. Park, Chemosphere, 2017, 166, 203–211 CrossRef CAS.
- E. l. Hu, X. B. Wu and S. M. Shang, J. Cleaner Prod., 2015, 112, 127 Search PubMed.
- X. J. Wang, Y. Song and J. S. Mai, J. Hazard. Mater., 2008, 160, 344–348 CrossRef CAS.
- D. Li, W. Wang and D. Jiang, RSC Adv., 2015, 5, 19 Search PubMed.
- R. Mardani, A. Asrar and H. Ershadifar, Mater. Chem. Phys., 2018, 211, 026 CrossRef.
- M. Gu and Q. Zhong, J. Appl. Electrochem., 2011, 41, 7 CrossRef.
- S. Mosivand, L. Monzon and I. Kazeminezhad, Int. J. Mol. Sci., 2013, 14, 5 Search PubMed.
- S.-H. Chang, K.-S. Wang, P.-I. Hu and I. Chun Lui, J. Hazard. Mater., 2009, 163, 544–549 CrossRef CAS.
- M. A. Pasquale, L. M. Gassa and A. J. Arvia, Electrochim. Acta, 2008, 53, 5891 CrossRef CAS.
- M. Tan, C. G. Guymon, D. R. Wheeler and J. N. Harb, J. Electrochem. Soc., 2007, 154, D78 CrossRef CAS.
- A. J. Bard and L. R. Faulkner, Electrochemical Methods: Fundamental and Applications, JohnWiley, New York, 2nd edn, 2001, pp. 228–239 Search PubMed.
- G. Feng, Y. Xiong and H. Wang, Electrochim. Acta, 2008, 53, 8253 CrossRef CAS.
- B. Scharifker and G. Hills, Electrochim. Acta, 1983, 28, 7 CrossRef.
- K. Raeissi, A. Saatchi and M. A. Golozar, J. Appl. Electrochem., 2003, 33, 7 CrossRef.
- W. He, X. C. Duan and L. Zhu, J. Cent. South Univ., 2009, 16, 5 Search PubMed.
- I. Haas, S. Shanmugam and A. Gedanken, J. Phys. Chem. B, 2006, 110, 34 CrossRef.
- M. Palomar-Pardavé, B. R. Scharifker and E. M. Arce, Electrochim. Acta, 2005, 50, 24 CrossRef.
- K. Vathsala, Appl. Surf. Sci., 2011, 257, 21 CrossRef.
- T. J. Licona-Sánchez and G. A. Alvarez-Romero, J. Phys. Chem. B, 2010, 114, 9737 CrossRef.
- Spectroscopic Method in Organic Chemistry, ed. D. H. Williams and I. Fleming, McGraw-Hill Education-Europe, United States, 2008, vol. 43 Search PubMed.
| This journal is © The Royal Society of Chemistry 2020 |

