 Open Access Article
Effect of external pressure on the release of methane through MFI zeolite nanochannels
Xu Cheng a,
Zhigang Li
 *a and
Ya-Ling He*b
aDepartment of Mechanical and Aerospace Engineering, The Hong Kong University of Science and Technology, Clear Water Bay, Kowloon, Hong Kong. E-mail: mezli@ust.hk
bKey Laboratory of Thermo-Fluid Science and Engineering of MOE, School of Energy and Power Engineering, Xi'an Jiaotong University, Xi'an, Shaanxi 710049, PR China. E-mail: yalinghe@mail.xjtu.edu.cn
First published on 12th October 2020
Abstract
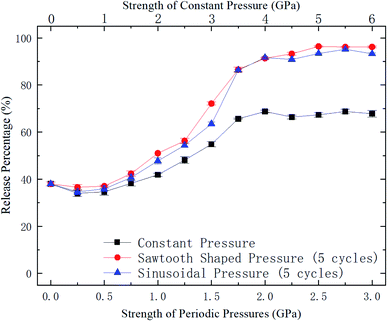
In this work, the effects of external pressure on the release of methane through zeolite nanochannels are studied through molecular dynamics (MD) simulations. The release percentage of methane under three types of pressure loadings with various strengths and frequencies are obtained. Specifically, constant, sawtooth-shaped, and sinusoidal pressures are examined. As the pressure strength is increased, it is found that the release percentage first decreases and then increases significantly before finally approaching a constant. At sufficiently high pressures, the release percentage of methane under constant external pressure is about 65%, while it reaches over 90% for sawtooth-shaped and sinusoidal pressures. The loading frequency for periodic external pressures appears to be unimportant compared with the effect of the pressure strength. Theoretical predictions of the release percentage are made on the basis of the kinetic energy of methane molecules and the energy barrier inside the nanochannels, which are in good agreement with MD simulations.
1. Introduction
The constant rise in global energy consumption has led to the development of unconventional natural gases as new energy resources to meet this energy demand and solve the potential energy crisis.1 As an important unconventional natural gas, shale gas is becoming a promising energy alternative due to its high efficiency and environmental friendliness.2,3 It is known that shale gas is confined in organic-rich, nanoscale shale matrices, which are of very low permeability.4 Therefore, the exploitation of shale gas is quite challenging compared with conventional natural gases. Furthermore, the output of a typical shale gas well usually experiences a significant drop after three years.5,6 To advance the technologies for shale gas development, it is important to understand the transport mechanisms of shale gas/methane in nanoconfinements and find new ways to enhance the release of methane from nanopores.Shale is a compound of clay minerals, quartz, calcite, pyrite, and organic matter.7,8 It is a porous material rich of nanoscale pores. Shale gas, which mainly contains methane, is confined in the nanopores of shale.9,10 As the mean pore size of shales is of a few nanometers,11–13 it is necessary to investigate methane dynamics in nanoconfinements in order to understand the transport properties of methane in shales. In the literature, many studies on gas adsorption and desorption in nanostructures, such as nanopores and carbon nanotubes, have been conducted. Rexer et al.14 experimentally investigated the adsorption of methane in an alum shale sample at different temperatures and pressures, which are similar to those of real geological conditions of shale gas. The supercritical methane adsorption data over a wide temperature range (300–473 K) are helpful for understanding the storage mechanisms of shale gas. Lithoxoos et al.15 studied the adsorption capacity of single-wall carbon nanotubes (SWCNTs) at room temperature under different pressures using Monte Carlo molecular simulations, which were confirmed by experiments. It was found that almost all the gas molecules distributed near the CNT surface due to the gas-CNT molecular interactions. Through MD simulations, Zhu and Zhao16 examined the methane adsorption in carbon nanopores and found that CNT has higher storage capacity compared with that in macroscale systems, which is attributed to the attractive interactions between the methane molecules and the CNT surface. Furthermore, it is found that the adsorption behavior in CNT is affected by the CNT diameter and there is an optimal CNT size for strengthening the methane storage. Another MD study performed by Wu et al.17 explores the adsorption mechanisms and displacement processes of methane in CNTs. It shows that the density of methane in silt pores could be several times higher than the bulk value when the pressure reaches 5 MPa. In addition, Takaba et al.18 conducted molecular modeling of methane permeation through silicalite membranes. Their MD simulations indicated that the adsorption properties of methane could not be changed until the pressure became sufficiently high (>2000 kPa). The adsorption properties of methane on the surface of nanopores in shale matrix under different pressures have also been studied using MD simulations.19 Various behavior of the apparent permeability of methane were found, which was attributed to the competition between the adsorbed and slippage layers of the shale matrix. Rezlerová et al.20 employed MD simulations to systematically evaluate the adsorption of C1 to C4 alkanes in the dual-porosity zeolites. It was found that methane was preferentially adsorbed in micropores rather than in mesoscale pores.
The desorption of gases in shales has also been explored. Wang et al.21 probed the dynamics of gas transport in shales through experimental and analytical studies. They found that a significant portion of the gas was adsorbed gas through mathematical analysis, which has been confirmed by experiments. Guo et al.22 experimentally investigated the isothermal desorption and adsorption characteristics of shale gas at different temperatures. It was found that temperature plays an important role in desorption and the shale gas desorption capacity decreases with increasing temperature. Ho et al.6 explored the pressure effects on the methane release in kerogen and found that free methane molecules, i.e., molecules confined in a pore but not adsorbed by the pore surface, can be released by pressure gradients while the dynamics of adsorbed molecules is determined by desorption and diffusion processes. Chen et al.4 investigated the mechanisms of desorption hysteresis of methane in nanopores. It was revealed that the variation of nanopore throat size greatly changed the energy for methane entering and escaping through the throat, which resulted in desorption hysteresis. In addition, Zhang et al.23 conducted MD simulations to investigate the transport mechanisms of methane isotopologues (12CH4 and 13CH4) in CNTs with various diameters at 353 K, and found that 13CH4 with a stronger adsorption affinity possessed a lower desorption rate. As it is easy for methane molecules of high kinetic energy to be released from nanopores, temperature is also a very important factor for shale gas desorption.24,25 Moreover, the potential energy distribution, which determines the energy barrier for methane desorption, in different nanostructures varies and affects the release rate of methane.26–28 Therefore, the effects of temperature on the release of methane from nanopores have been extensively studied. However, the role of external pressures on the desorption/release of methane from nanopores have not been fully studied, which requires intensive explorations.
In this work, we investigate the effects of external pressures on the release of methane in zeolite nanopores through MD simulations. The methane release percentage is obtained at various pressure strengths for three different loading patterns, which are constant, sawtooth-shaped, and sinusoidal pressures. The all-silica MFI zeolite is employed to model shale pores because it is a traditional adsorbent and widely applicable for gas storage.29–31 As the external pressure is increased, it is found that the release percentage of methane decreases first and then increases before finally leveling off. The effect of loading frequency is also studied, which is found insignificant compared with the strength of the pressure. The kinetic energy of the methane molecules and the energy barrier for the release of methane are studied to explain the release behavior.
2. Molecular dynamics simulation
The MD simulations are performed using the commercial software, Material Studio. A typical simulation system contains a three-dimensional (3D) all-silica MFI zeolite (silicalite-1) to model nanoscale shale structures. The zeolite has a 3D network of two types of interconnecting nanochannels, i.e., straight and zigzag channels. The straight channels are along the y direction and the zigzag channels are in the x–z plane. The structure of the zeolite is depicted in Fig. 1. The lengths of a unit silicalite-1 cell in the x, y, and z directions are lx = 20.044 Å, ly = 19.918 Å, lz = 13.395 Å, respectively.32 In the simulations, five unit cells of silicalite-1 in the x and y directions and two unit cells in the z direction are built such that the lengths of the whole MFI zeolite in the x, y, and z directions are 100.22, 99.59, and 26.79 Å, respectively. As each unit cell of MFI zeolite contains 96 silicon atoms and 192 oxygen atoms,32 i.e., 96 SiO2 molecules, the whole simulation system, which contains 50 unit cells, totally has 4800 silicon and 9600 oxygen atoms. To allow the methane molecules to be released from the zeolite, the dimensions of the entire simulation system are set as 50, 50, and 2.68 nm in the x, y, and z directions with the MFI zeolite at the center of the system. Periodic boundary conditions are employed in all the directions. The pressure and temperature of the system are controlled at 20 MPa and 350 K, respectively, by the Parrinello–Rahman barostat33 and the Berendsen thermostat.34 These conditions are close to the geological conditions of practical shale gas reservoirs.35 The integration time step is 1 fs and the Dreiding force field36 is used to model the zeolite, methane, and methane-zeolite interactions.37,38 The general potential for these interactions is given by
 | (1) |
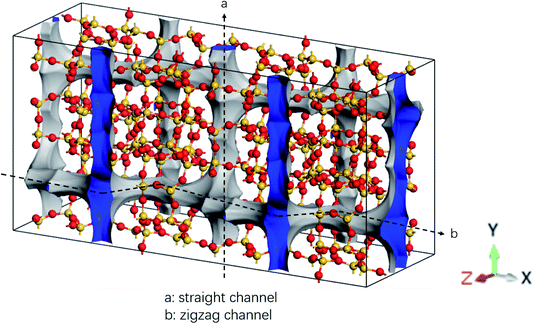 | ||
| Fig. 1 Structure of all-silica MFI zeolite. Yellow and red spheres are silicon and oxygen atoms, respectively. | ||
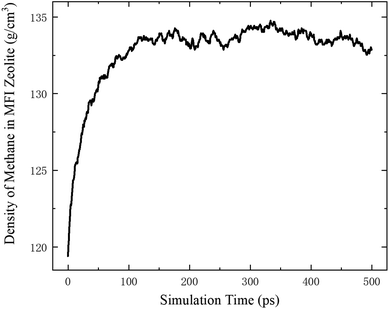
According to the thermodynamics properties of methane and the structure of all-silica MFI zeolite, at 20 MPa and 350 K, the density of methane is 119.41 kg m−3 and the pore volume of MFI zeolite is 1.83 nm3 per unit cell.30,40 These properties are used to define the initial loading of methane in the zeolite, which corresponds to 8 methane molecules per unit cell. To maintain a homogeneous pressure distribution at the beginning, both the free space outside and the channels inside the zeolite are initially filled with methane molecules according to this density. The system is first relaxed for 500 ps in the NVT ensemble. During the relaxation, the density of methane inside the MFI zeolite increases and approaches ∼133 kg m−3 due to the molecular interactions between the methane molecules outside the zeolite and the channel surfaces of the zeolite, which lead to methane adsorption on the channel surfaces. The variation of the methane density is shown in Fig. 2, which agrees well with previous work.41,42 After the relaxation, the methane molecules outside the zeolite are removed and the remaining system with methane inside the zeolite is switched to the NVE ensemble.
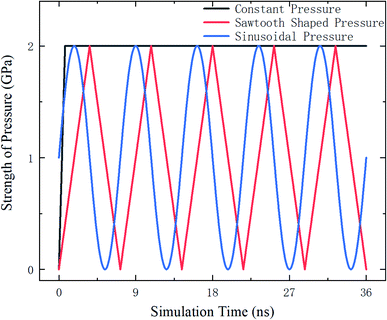
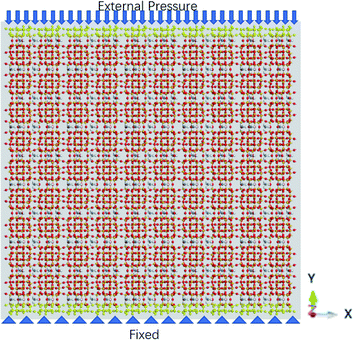
The external pressure is loaded in three different fashions, which are constant, sawtooth-shaped, and sinusoidal pressures, as depicted in Fig. 3. The pressures are applied by acting a force on the atoms in the top layer of the zeolite and the atoms in the bottom layer are fixed, as shown in Fig. 4. The simulations are run for 36 ns to collect the data for computing the release percentage.
3. Results and discussion
In the simulations, the number of methane molecules released from the zeolite is obtained and the release percentage Po is computed as
 | (2) |
 | ||
| Fig. 5 Release percentage of methane as a function of external pressure strength (for periodic pressures, the mean pressure is used as the pressure strength). | ||
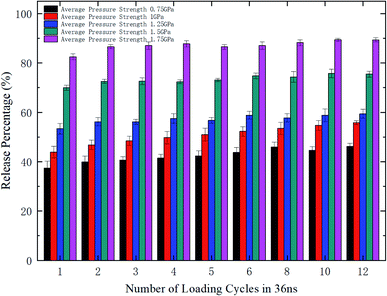
To further explore the release performance of periodic pressures, the effect of the loading frequency for the sawtooth-shaped pressure is studied. Fig. 6 shows the release percentage of methane molecules for various frequencies, which are achieved by changing the number of loading cycles from 1 to 12 in 36 ns, and under different pressure strengths. It is clear that the release percentage changes mildly as the frequency is increased. For relatively high pressures (e.g., 1.25, 1.5, and 1.75 GPa), the release percentage almost remains unchanged after two cycles. Hence, the loading frequency plays a minor role in releasing methane compared with the effect of pressure strength.
Whether a methane molecule can be released from the zeolite mainly depends on the kinetic energy E of the methane molecule and the energy barrier ΔG in the nanochannels.42–44 E is mainly governed by the temperature T and ΔG is determined by the methane-zeolite molecular interaction and the pore structure. ΔG is the potential difference between the maximum and minimum points in the channel. If the kinetic energy of a methane molecule is sufficiently high, it can easily overcome the energy barrier and diffuse freely in the channels and has great chance to escape from the channel. The probability of the methane molecule to be released from the zeolite is proportional to exp(−ΔG/E), as will be shown later. Fig. 7a and b show the potential distributions next to the interior surface of a straight channel in the y direction. They are depicted in the θ − y coordinates, where θ is the polar angle, as illustrated in Fig. 7c. It is seen that the potential varies greatly in the y direction and high potentials take place at the exits. Moreover, the potential distribution is changed after a pressure is applied to the zeolite, as indicated by the color bars in Fig. 7a and b, and the energy barrier is increased by the external pressure. Both E and ΔG are affected by the external pressure. Typically, a high E and a low ΔG promote the release of methane from the zeolite. When an external pressure is applied, it causes the zeolite to deform. Therefore, the force acting on the zeolite does some work on the zeolite, as shown in Fig. 8, which increases the temperature of the system (see the inset of Fig. 8), raises the kinetic energy of methane molecules, and consequently enhances the release percentage. On the other hand, the deformation of the nanochannels caused by the external pressure may increase the energy barrier ΔG and hinder the discharge of methane molecules. The competition between these two effects determines the release percentage.
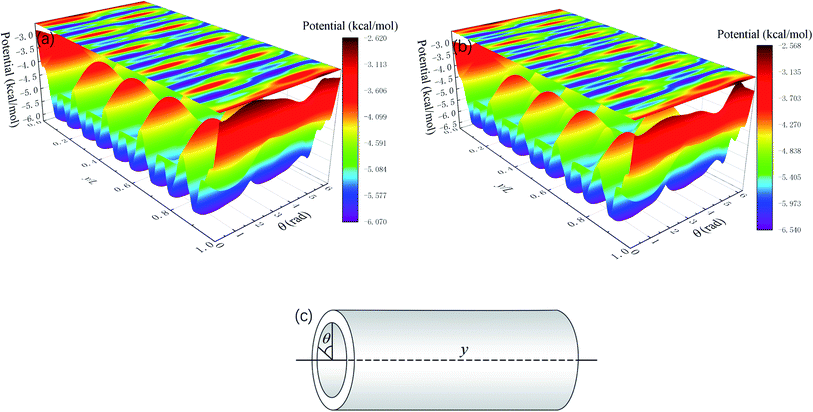 | ||
| Fig. 7 Average potential distribution next to the interior wall of a straight channel in the y direction (Fig. 1). L is the total length of the channel in the y direction. (a) Without external pressures and (b) under a constant external pressure (2 GPa). (c) Notation of the coordinates. | ||
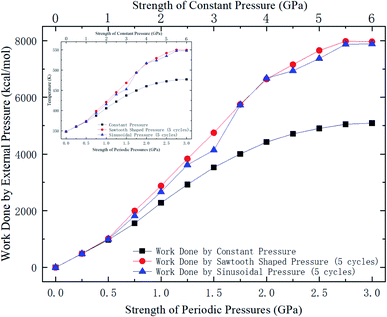 | ||
| Fig. 8 Work done by external pressures as a function of external pressure strength. The data for periodic pressures are for 5 loading cycles. The inset shows the temperature change of the system. | ||
The release percentage of the methane molecules can be theoretically predicted using E and ΔG. It is known that the velocity of the methane molecules follows the Maxwell-Boltzmann distribution, which, in terms of E, is given by25
 | (3) |
 | (4) |
The results of eqn (4) is proportional to exp(−ΔG/kBT), i.e., P* ∝ exp(−ΔG/kBT). Thus, ΔG and kBT are the main factors controlling the release percentage. As ΔG is the determined by the potential distribution inside the channels and the potential U depends on the position, the average potential Uavg(y) along the channel axis in straight channels is used to obtain ΔG (it is noted that most of the methane molecules released from the zeolite are from the straight channels because ΔG is small in these channels). Uavg(y) is calculated through
 | (5) |
 | (6) |
Fig. 9 shows kBTof the methane and the potential energy barrier ΔG of the straight channels as a function of the strength of the external pressure for the three types of pressure loadings. On the basis of the kBT and ΔG values in Fig. 9, the release percentage is calculated using eqn (4) and the results are shown in Fig. 10. It is seen that the predictions of eqn (4) generally agree well with the MD results. The discrepancy is caused by the estimation of ΔG, which is obtained based on the average potential in the channels.
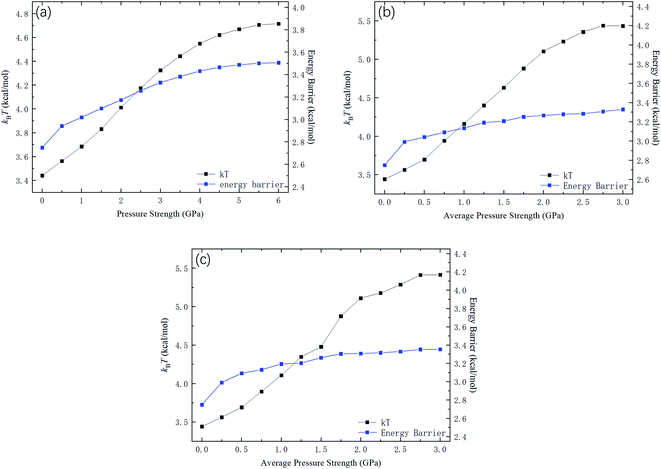 | ||
| Fig. 9 kBT and energy barrier ΔG as a function of pressure strength. (a) Constant pressure. (b) Sawtooth-shaped pressure (5 cycles). (c) Sinusoidal pressure (5 cycles). | ||
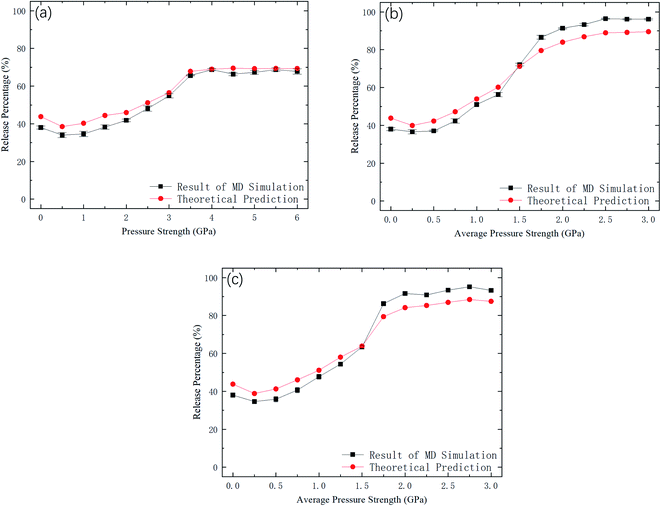 | ||
| Fig. 10 Comparison between MD simulations and predictions of eqn (4). (a) Constant pressure. (b) Sawtooth-shaped pressure (5 cycles). (c) Sinusoidal pressure (5 cycles). | ||
With the kBT and ΔG data in Fig. 9, the variation of the release percentage in Fig. 5 can be explained. At low pressure loadings, both kBT and ΔG increase as the pressure is increased. However, ΔG increases faster than kBT, which causes exp(−ΔG/kBT) to decrease with increasing pressure. This is why the release percentage drops at low pressures (see Fig. 5). As the pressure is further increased, kBT increases much faster than ΔG, leading to significant rise of the release percentage. At high pressures, both kBT and ΔG approach constant values, which make the release percentage remains roughly constant at a large value.
4. Conclusions
The effects of external pressures on the release of methane from all-silica MFI zeolite nanochannels have been investigated through MD simulations. At low pressures, the release percentage declined slightly as the pressure is increased. When the pressure is further increased, it starts to increase significantly and remain roughly unchanged at sufficiently high pressures. The final release percentage at high pressures under constant external pressures is lower than those for sawtooth-shaped and sinusoidal pressures. For periodic pressures, the loading frequency is found to be a minor issue. The variation of the release percentage is governed by the kinetic energy of the methane molecules and the energy barrier inside the zeolite channels. Theoretical predictions of the release percentage using kinetic energy of the methane molecules and the energy barrier obtained through MD simulations agree well with numerical results.Conflicts of interest
There are no conflicts of interest to declare.Acknowledgements
This work was supported by the Research Grants Council of the Hong Kong Special Administrative Region (No. 16209119) and the Basic Science Center Program for Ordered Energy Conversion of the National Natural Science Foundation of China (No. 51888103).References
- Q. Wang and R. Li, Renewable Sustainable Energy Rev., 2017, 74, 715–720 CrossRef.
- Y. Yang, L. Wang, Y. Fang and C. Mou, Renewable Sustainable Energy Rev., 2017, 76, 1465–1478 CrossRef CAS.
- M. Guo, X. Lu, C. P. Nielsen, M. B. McElroy, W. Shi, Y. Chen and Y. Xu, Renewable Sustainable Energy Rev., 2016, 66, 742–750 CrossRef.
- J. Chen, F. Wang, H. Liu and H. Wu, Sci. China, Ser. G: Phys., Mech. Astron., 2016, 60, 014611 CrossRef.
- J. D. Hughes, Nature, 2013, 494, 307–308 CrossRef CAS.
- T. A. Ho, L. J. Criscenti and Y. Wang, Sci. Rep., 2016, 6, 28053 CrossRef CAS.
- P. Li, Z. Jiang, M. Zheng, H. Bi and L. Chen, J. Nat. Gas Sci. Eng., 2016, 34, 1034–1043 CrossRef CAS.
- k. Ji, S. Guo and B. Hou, J. Pet. Sci. Eng., 2017, 150, 250–256 CrossRef CAS.
- W. Dang, J.-C. Zhang, X. Tang, X.-L. Wei, Z.-M. Li, C.-H. Wang, Q. Chen and C. Liu, Front. Geosci., 2018, 9, 559–575 CrossRef CAS.
- D. Dasani, Y. Wang, T. T. Tsotsis and K. Jessen, Ind. Eng. Chem. Res., 2017, 56, 9953–9963 CrossRef CAS.
- S. B. Chen, Y. M. Zhu, G. Y. Wang, H.-L.-. LIU and J. H. Fang, J. China Coal Soc., 2012, 37, 438–444 CAS.
- R. G. Loucks, R. M. Reed, S. C. Ruppel and D. M. Jarvie, J. Sediment. Res., 2009, 79, 848–861 CrossRef.
- U. Kuila and M. Prasad, Geophys. Prospect., 2013, 61, 341–362 CrossRef.
- T. F. T. Rexer, M. J. Benham, A. C. Aplin and K. M. Thomas, Energ. Fuel., 2013, 27, 3099–3109 CrossRef CAS.
- G. P. Lithoxoos, A. Labropoulos, L. D. Peristeras, N. Kanellopoulos, J. Samios and I. G. Economou, J. Supercrit. Fluids, 2010, 55, 510–523 CrossRef CAS.
- X. Zhu and Y.-P. Zhao, J. Phys. Chem. C, 2014, 118, 17737–17744 CrossRef CAS.
- H. Wu, J. Chen and H. Liu, J. Phys. Chem. C, 2015, 119, 13652–13657 CrossRef CAS.
- H. Takaba, A. Yamamoto and S.-i. Nakao, Desalination, 2006, 192, 82–90 CrossRef CAS.
- Z.-Z. Li, T. Min, Q. Kang, Y.-L. He and W.-Q. Tao, Int. J. Heat Mass Tran., 2016, 98, 675–686 CrossRef.
- E. Rezlerová, A. Zukal, J. Čejka, F. R. Siperstein, J. K. Brennan and M. Lísal, Langmuir, 2017, 33, 11126–11137 CrossRef.
- J. Wang, Z. Yang, M. Dong, H. Gong, Q. Sang and Y. Li, Energ. Fuel., 2016, 30, 10080–10091 CrossRef CAS.
- W. Guo, W. Xiong, S. Gao, Z. Hu, H. Liu and R. Yu, Petrol. Explor. Dev., 2013, 40, 514–519 CrossRef.
- W. Zhang, B. Shen, Y. Chen, T. Wang and W. Chen, Fuel, 2020, 278, 118378 CrossRef CAS.
- Z. Li and H. Wang, Phys. Rev. Lett., 2005, 95, 014502 CrossRef.
- Z. Li and H. Wang, Phys. Rev. E, 2003, 68, 061206 CrossRef.
- L. Li, J. Mo and Z. Li, Phys. Rev. Lett., 2015, 115, 134503 CrossRef.
- J. Mo, L. Li, J. Zhou, D. Xu, B. Huang and Z. Li, Phys. Rev. E, 2015, 91, 033022 CrossRef.
- J. Mo, C. Li, L. Li, J. Wang and Z. Li, Phys. Fluids, 2016, 28, 082005 CrossRef.
- D. P. Broom and K. M. Thomas, MRS Bull., 2013, 38, 412–421 CrossRef CAS.
- C. Tedesco, L. Erra, M. Brunelli, V. Cipolletti, C. Gaeta, A. N. Fitch, J. L. Atwood and P. Neri, Chem. - Eur. J., 2010, 16, 2371–2374 CrossRef CAS.
- J. Dong, X. Wang, H. Xu, Q. Zhao and J. Li, Int. J. Hydrogen Energy, 2007, 32, 4998–5004 CrossRef CAS.
- C. Baerlocher, L. B. McCusker and D. H. Olson, Atlas of Zeolite Framework Types, Elsevier, Amsterdam, 2007, pp. 174–175 Search PubMed.
- M. Parrinello and A. Rahman, J. Appl. Phys., 1981, 52, 7182–7190 CrossRef CAS.
- H. J. C. Berendsen, J. P. M. Postma, W. F. van Gunsteren, A. DiNola and J. R. Haak, J. Chem. Phys., 1984, 81, 3684–3690 CrossRef CAS.
- C. Zou, Q. Zhao, D. Dong, Z. Yang, Z. Qiu, F. Liang, N. Wang, Y. Huang, A. Duan, Q. Zhang and Z. Hu, J. Nat. Gas Geosci., 2017, 2, 273–288 CrossRef.
- S. L. Mayo, B. D. Olafson and W. A. Goddard, J. Phys. Chem., 1990, 94, 8897–8909 CrossRef CAS.
- H. Aljamaan, M. Al Ismail and A. R. Kovscek, J. Nat. Gas Sci. Eng., 2017, 48, 119–137 CrossRef CAS.
- J. Xiong, X. Liu, L. Liang and Q. Zeng, Ind. Eng. Chem. Res., 2017, 56, 6229–6238 CrossRef CAS.
- X. Cheng, Z. Li and Y.-L. He, RSC Adv., 2019, 9, 9546–9554 RSC.
- U. Setzmann and W. Wagner, J. Phys. Chem. Ref. Data, 1991, 20, 1061–1155 CrossRef CAS.
- W. Ren, G. Li, S. Tian, M. Sheng and L. Geng, Ind. Eng. Chem. Res., 2017, 56, 3446–3455 CrossRef CAS.
- T. F. Rexer, E. J. Mathia, A. C. Aplin and K. M. Thomas, Energ. Fuel., 2014, 28, 2886–2901 CrossRef CAS.
- R. L. June, A. T. Bell and D. N. Theodorou, J. Phys. Chem., 1990, 94, 8232–8240 CrossRef CAS.
- Q. Yang and C. Zhong, J. Phys. Chem. B, 2006, 110, 17776–17783 CrossRef CAS.
| This journal is © The Royal Society of Chemistry 2020 |

