
 Open Access Article
 This Open Access Article is licensed under a Creative Commons Attribution-Non Commercial 3.0 Unported Licence
Melamine-based functionalized graphene oxide and zirconium phosphate for high performance removal of mercury and lead ions from water†
Ayyob M. Bakryab,
Fathi S. Awadac,
Julian A. Bobb a,
Amr A. Ibrahimac and
M. Samy El-Shall*a
a,
Amr A. Ibrahimac and
M. Samy El-Shall*a
aDepartment of Chemistry, Virginia Commonwealth University, Richmond, VA 23284, USA. E-mail: mselshal@vcu.edu; Fax: +1-804-828-8599; Tel: +1-804-828-2753
bDepartment of Chemistry, Faculty of Science, Jazan University, Jazan 45142, Saudi Arabia
cChemistry Department, Faculty of Science, Mansoura University, Mansoura 35516, Egypt
First published on 14th October 2020
Abstract
Heavy metal ions are highly toxic and widely spread as environmental pollutants. This work reports the development of two novel chelating adsorbents, based on the chemical modifications of graphene oxide and zirconium phosphate by functionalization with melamine-based chelating ligands for the effective and selective extraction of Hg(II) and Pb(II) from contaminated water sources. The first adsorbent melamine, thiourea-partially reduced graphene oxide (MT-PRGO) combines the heavier donor atom sulfur with the amine and triazine nitrogen's functional groups attached to the partially reduced GO nanosheets to effectively capture Hg(II) ions from water. The MT-PRGO adsorbent shows high efficiency for the extraction of Hg(II) with a capacity of 651 mg g−1 and very fast kinetics resulting in a 100% removal of Hg(II) from 500 ppb and 50 ppm concentrations in 15 second and 30 min, respectively. The second adsorbent, melamine zirconium phosphate (M-ZrP), is designed to combine the amine and triazine nitrogen's functional groups of melamine with the hydroxyl active sites of zirconium phosphate to effectively capture Pb(II) ions from water. The M-ZrP adsorbent shows exceptionally high adsorption affinity for Pb(II) with a capacity of 681 mg g−1 and 1000 mg g−1 using an adsorbent dose of 1 g L−1 and 2 g L−1, respectively. The high adsorption capacity is also coupled with fast kinetics where the equilibrium time required for the 100% removal of Pb(II) from 1 ppm, 100 ppm and 1000 ppm concentrations is 40 seconds, 5 min and 30 min, respectively using an adsorbent dose of 1 g L−1. In a mixture of six heavy metal ions at a concentration of 10 ppm, the removal efficiency is 100% for Pb(II), 99% for Hg(II), Cd(II) and Zn(II), 94% for Cu(II), and 90% for Ni(II) while at a higher concentration of 250 ppm the removal efficiency for Pb(II) is 95% compared to 23% for Hg(II) and less than 10% for the other ions. Because of the fast adsorption kinetics, high removal capacity, excellent regeneration, stability and reusability, the MT-PRGO and M-ZrP are proposed as top performing remediation adsorbents for the solid phase extraction of Hg(II) and Pb(II), respectively from contaminated water.
1. Introduction
Water contamination by heavy metal ions such as Pb(II) and Hg(II) creates serious public health and environmental concerns due to their high toxicity, refractory degradation, and ease of entering the food chain.1,2 The efficient removal of these toxic metal ions from polluted and wastewater sources is a critical requirement for any water treatment process.3,4Adsorption by chelating ligands is one of the best techniques for the removal of heavy metal ions from contaminated water due to its high efficiency, ease of application, low cost, and reusability.5–7 In adsorption techniques, the adsorbent can extract metal ions from solution by chemical or physical interactions with different active sites on the surface of the adsorbent. The adsorbed toxic metal ions can be regenerated from the surface of the adsorbent which allows for using the adsorbent several times due to the reversible characteristics of adsorption.5–7 However, traditional absorbents such as activated carbon, activated alumina, clay, and zeolite show limited adsorption abilities and poor selectivity for highly toxic metal ions such as Hg(II) and Pb(II).8–11 Thus, it is crucial to develop new adsorbents with specific active sites as well as high surface areas to ensure high selectivity and high adsorption capacity of Hg(II) and Pb(II) from contaminated water.7,11
Melamine is an organic compound that has three basic nitrogen atoms in a triazine ring in addition to three free amine groups which are known to be among the most effective chelating functional groups with high nucleophilicity towards heavy metal ions especially Pb(II) and Hg(II).12–15 Therefore, modifications of organic and inorganic adsorbents by melamine have been successfully applied for the development of efficient adsorbents for water purification. Examples of melamine-based adsorbents include melamine modified MOFs,12 poly-melamine formaldehyde resins,13 melamine modified graphene hydrogels,14 and alginate–melamine hybrid materials.15 Herein, we develop two novel adsorbents based on the melamine functionalization of graphene oxide (GO) and zirconium phosphate (ZrP) for the efficient and selective removal of Hg(II) and Pb(II) ions, respectively from contaminated water with exceptional performance that surpasses the performance of most of the currently used adsorbents.
The first novel adsorbent, Melamine Thiourea Partially Reduced Graphene Oxide (MT-PRGO), is prepared by the amidation reaction between chemically modified graphene oxide through carboxylic acid functional groups and melamine thiourea chelating ligand via amine functional groups. The introduction of the heavier donor atom sulfur can increase the melamine selectivity toward Hg(II) due to the increased polarization of the sulfur d-electrons.16 The developed MT-PRGO adsorbent exhibits very high adsorption capacity for Hg(II) from concentrated solutions and complete removal of Hg(II), Co(II), Cu(II), Cd(II), Zn(II) and Ni(II) from a mixture containing 500 ppb of each of these ions. The results of regeneration show that the adsorbent can be regenerated several times by using different concentrations of nitric acid with removal efficiencies of 100% toward Hg(II) and the adsorbent can be used several times to purify water from toxic metals which is important in industrial applications.
The second novel adsorbent developed in the present work is Melamine Zirconium Phosphate (M-ZrP). Zirconium phosphate (ZrP) has attracted increased attention as an adsorbent due to its high thermal and chemical stability, fast adsorption–desorption kinetics, good surface area, high adsorption capacity, and insolubility in water.17 Moreover, it possesses hydroxyl functional groups that can allow for further modification by chelation ligands to increase the adsorption capacity.18–21 In recent years, only a few studies have reported the use of ZrP alone or as a composite with other materials to clean contaminated water of heavy metals. These studies include polyamine-intercalated zirconium phosphate,18 polymer-based zirconium phosphate,19 amorphous zirconium phosphate,20 and graphene oxide zirconium phosphate nanocomposite.21 In the present study, we report on the development of the Melamine Zirconium Phosphate (M-ZrP) adsorbent for the extraction of heavy metals from polluted water with a remarkable adsorption capacity for Pb(II) that makes it one of the top inorganic adsorbents for the efficient removal of lead ions from water. The developed M-ZrP adsorbent also shows simultaneous removal of Pb(II), Hg(II), and Cd(II) from both low and high concentrated solutions.
2. Experimental section
2.1. Materials
All reagents used in this work were analytical grade, used without further purification, and purchased from Sigma Aldrich: graphite powder (99.999%), sulfuric acid (99%), potassium permanganate (99%), hydrogen peroxide (30%), melamine (99%), phosphoric acid (99%), zirconyl chloride (99.5), sodium hydroxide (97%), nitric acid (99%), hydrochloric acid (99%), ethanol (99%), potassium thiocyanate (98%), chloro-acetic acid (99%), N,N′-dicyclohexylcarbodiimide (DCC) (99%), dimethylformamide (DMF) (99.99%) and hydroxybenzotriazole (Bt-OH) (99%). Stock solutions of several concentration of each metal ion prepared from Pb(NO3)2, HgCl2, CuCl2·2H2O, Ni(NO3)2·6H2O, Co(NO3)2·6H2O, CdCl2, and Zn(NO3)2·6H2O were used as sources for the Pb(II), Hg(II), Cu(II), Ni(II), Co(II), Cd(II), and Zn(II) ions, respectively.2.2. Synthesis of graphene oxide (GO)
GO was prepared by a modified Hummer's method.22 115 mL of H2SO4 was added into a 1000 mL conical flask placed in an ice bath and stirred until the temperature reached 0 °C. Then, 2.5 g of grind NaNO3 was added and the solution stirred for 15 min. 4.5 g of graphite powder was added to the mixture and allowed to react for 20 min. 15 g of KMnO4 was added slowly to the reaction mixture, after 15 min the temperature was increased to 35 °C for 3 h followed by adding 230 mL hot DI-water. After 20 min, 700 mL of hot DI water was added to the mixture followed by the addition of 20 mL H2O2. The product was rinsed with 10 mL HNO3 to remove metals followed by 5000 mL hot DI-water (1000 mL each time) and oven dried at 60 °C overnight.2.3. Synthesis of GO-COOH
500 mg of GO was dispersed in 100 mL DI-water and sonicated for 1 h. Then, 12 g of Cl–CH2COOH and 10 g of NaOH was added to GO suspension and allowed to react for 2 h. The final product was neutralized using HNO3 and washed several times with DI-water, ethanol, and dried in the oven at 60 °C for 12 h.232.4. Synthesis of MT active ligand
The MT ligand was prepared according to the method described in ref. 24. In brief, 5 g of melamine was dissolved in 100 mL distilled DI-water. 12 g of KSCN was dissolved in 90 mL DI-water and 10 mL 0.1 M HCl. The KSCN solution was added dropwise to the melamine solution followed by heating to 90 °C in a 500 mL round bottom flask under reflux. After 1 h the flask was cooled in an ice bath, the product was centrifuged and recrystallized from (1![[thin space (1/6-em)]](https://www.rsc.org/images/entities/char_2009.gif) :1) ethanol–water mixture.
:1) ethanol–water mixture.
2.5. Synthesis of MT-PRGO
MT-PRGO was synthesized by dispersing 500 mg of GO-COOH in 100 mL DMF by ultra-sonication at room temperature for 60 min 500 mg of MT was added to the mixture followed by adding 1000 mg of DCC and 1000 mg Bt-OH. The mixture was allowed to react for 24 h at room temperature. The product MT-PRGO was centrifuged, washed five times with DMF followed by five times with DI water and finally, three times with ethanol and oven dried at 80 °C overnight to give MT-PRGO.2.6. Synthesis of ZrP
ZrP was synthesized by adding 100 mL of 0.1 M zirconyl chloride in 1 M HCl dropwise to the 0.1 M solution of phosphoric acid while stirring vigorously for 1 h. The solution was centrifuged, and the precipitate was washed several times with DI water and ethanol, then it was dried at 80 °C overnight.2.7. Synthesis of M-ZrP
MP was prepared by dissolving 1 g of melamine in 100 mL DI water. The mixture was transferred into a 250 mL two-necked round bottom flask fitted with a heater, magnetic stirrer, and condenser. After that, 1 g of phosphoric acid was added dropwise to the reaction flask and then the reactants were allowed to react at 95 °C for 1 h followed by cooling to room temperature. The final product was centrifuged and washed several times with DI water, ethanol, and then dried at 100 °C overnight to give the white solid MP.25 M-ZrP was synthesized by dissolving 1 g of MP in 100 mL DI water. Then, 100 mL of 0.1 M zirconyl chloride in 1 M HCl was added dropwise to this solution while stirring vigorously. The solution was stirred for 1 h then it was centrifuged and washed three times with DI-water and ethanol. Finally, it was dried at 100 °C overnight in the oven to give the white powder M-ZrP.2.8. Characterization
The adsorbents were characterized by FT-IR spectroscopy using the Nicolet-Nexus 670 FT-IR spectrometer (4 cm−1 resolution and 32 scans) diamond attenuated total reflectance (DATR). Powder X-ray diffraction (XRD) patterns of the adsorbents were measured at room temperature using the PANanalytical MPD X'Pert PRO diffractometer with voltage 45 kV and current 40 mA via a Ni-filtered Cu Kα1 radiation. The X-ray photoelectron spectroscopy (XPS) spectra of the materials were obtained using a ThermoFisher Scientific ESCALAB 250 spectrometer with a microfocused monochromated Al Kα X-ray source (15 kV) and a double-focusing full 180° spherical sector electron analyzer. Proton NMR spectra in DMSO-D6 solvent were obtained using the Bruker AV-III 400 MHz instrument. The nitrogen adsorption–desorption isotherms were obtained at 77 K using a Micromeritics 3 Flex instrument. The samples were degassed at 120 °C for 6 h prior to adsorption–desorption measurements. Transmission electron microscopy (TEM) images were obtained at 100 kV by a JEOL JEM-1400 transmission electron microscope. Scanning electron microscopy (SEM) images were taken using the Hitachi SU-70 field-emission scanning electron microscope with an energy of 5.0 kV. The concentrations of heavy metals in the solutions before and after removal experiments were quantified by either Varian Vista-MPX Inductively Coupled Plasma Optical Emission Spectroscopy (ICP-OES) with Ar+ ion plasma gas equipped with a Charged Coupled Detector (CCD) for simultaneous detection at ppm concentration levels or Agilent 8900 Triple Quadrupole Inductively Coupled Plasma Mass Spectrometry (ICP-MS) with Ar+ ion plasma gas and an electron multiple detector for detection at ppb concentration levels.2.9. Adsorption and desorption experiments
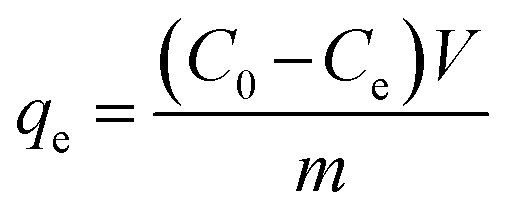
Adsorption and desorption of heavy metals from contaminated water were measured in the experiments by using 5 mL of metal solution and 5 mg of the adsorbent in 20 mL glass vials at different pH, initial concentrations, and contact time. The samples were acidified with 2% HNO3 prior to analysis and either ICP-OES or ICP-MS was used to measure the concentration of heavy metal ions in the solutions after removal or desorption experiments at ppm or ppb levels, respectively. The adsorption or desorption capacity qe and qd in (mg g−1) can be calculated from eqn (1) and (3), respectively, while removal efficiency % Re and desorption efficiency % De can be calculated from eqn (2) and (4), respectively.23,26
 | (1) |
 | (2) |
 | (3) |
 | (4) |
3. Results and discussion
3.1. Design and characterization of melamine thiourea-partially reduced graphene oxide (MT-PRGO)
The design strategy of the MT-PRGO is motivated by the introduction of the melamine functional groups (triazine ring and three free amine groups) within the GO surface in order to form strong complexes with high-binding interactions with the Hg(II) ions.16 The general procedure for the preparation of MT-PRGO is shown in Scheme 1, and it involves three main steps. The first step is the preparation of the MT active ligand through an acid-catalyzed reaction between potassium thiocyanate and melamine to form MT.24 The second step is the preparation of GO by the modified Hummer's method,22 followed by a reaction with chloroacetic acid in order to increase the number of carboxylic acid groups by converting alcohol and ether groups to carboxylic acid groups.27 The third step is the peptide bond formation between the amine groups of MT and the carboxylic acid groups on the surface of GO using N,N′-dicyclohexylcarbodiimide (DCC) as a coupling agent.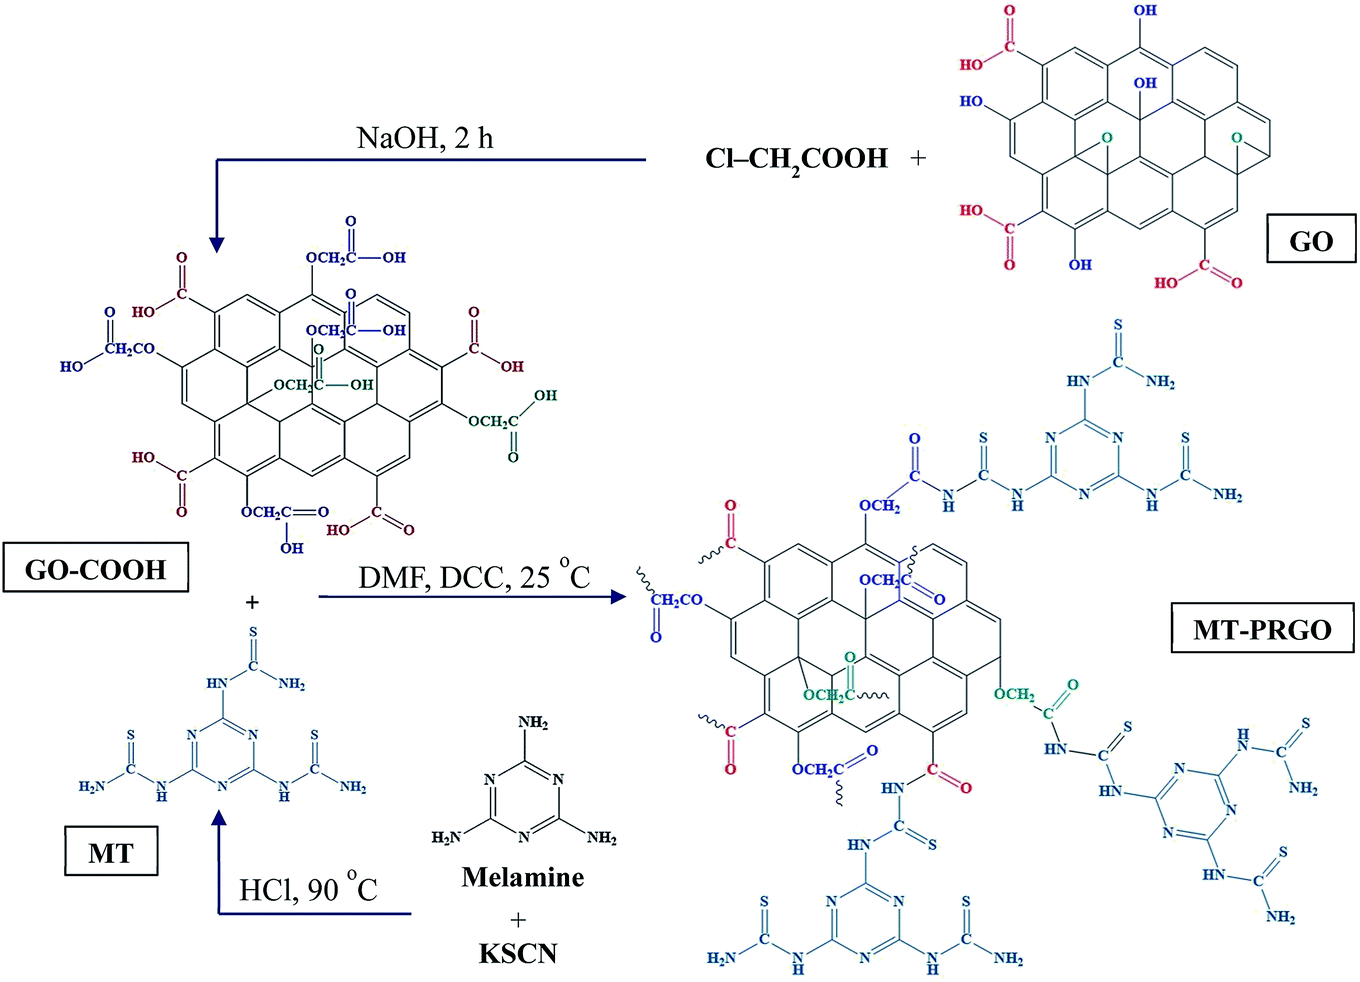 | ||
| Scheme 1 General procedure for the preparation of MT-PRGO adsorbent from GO-COOH and MT. | ||
Fig. 1(a) displays the XRD patterns of melamine, KSCN and MT. It is clear that the XRD pattern of MT is completely different from those of melamine and KSCN which can be used as evidence for the formation of crystalline MT by the acid-catalyzed reaction between melamine and KSCN.28,29 The FTIR spectra, displayed in Fig. 1(b), show the N–H stretching and bending vibrations of melamine in the region of 3000–3500 and 1640 cm−1, respectively. The peaks between 1433–1533 and 810 cm−1 are assigned to the C–N stretching and bending vibrations, respectively, and the triazine ring vibrations appear at 1021 and 578 cm−1.28,29 The KSCN spectrum shows the two characteristic peaks at 2046 and 1641 cm−1 due to C![[double bond, length as m-dash]](https://www.rsc.org/images/entities/char_e001.gif) S stretching and bending vibrations, respectively.28 However, the MT spectrum shows all the peaks assigned to the CS, N–H, C–N, and triazine vibrations in addition to two new peaks at 1173 and 655 cm−1 that can be assigned to the C–S stretching and bending vibrations, respectively.24 These peaks are not present in the melamine nor in the KSCN spectrum thus confirming the formation of the MT chelating ligand.
S stretching and bending vibrations, respectively.28 However, the MT spectrum shows all the peaks assigned to the CS, N–H, C–N, and triazine vibrations in addition to two new peaks at 1173 and 655 cm−1 that can be assigned to the C–S stretching and bending vibrations, respectively.24 These peaks are not present in the melamine nor in the KSCN spectrum thus confirming the formation of the MT chelating ligand.
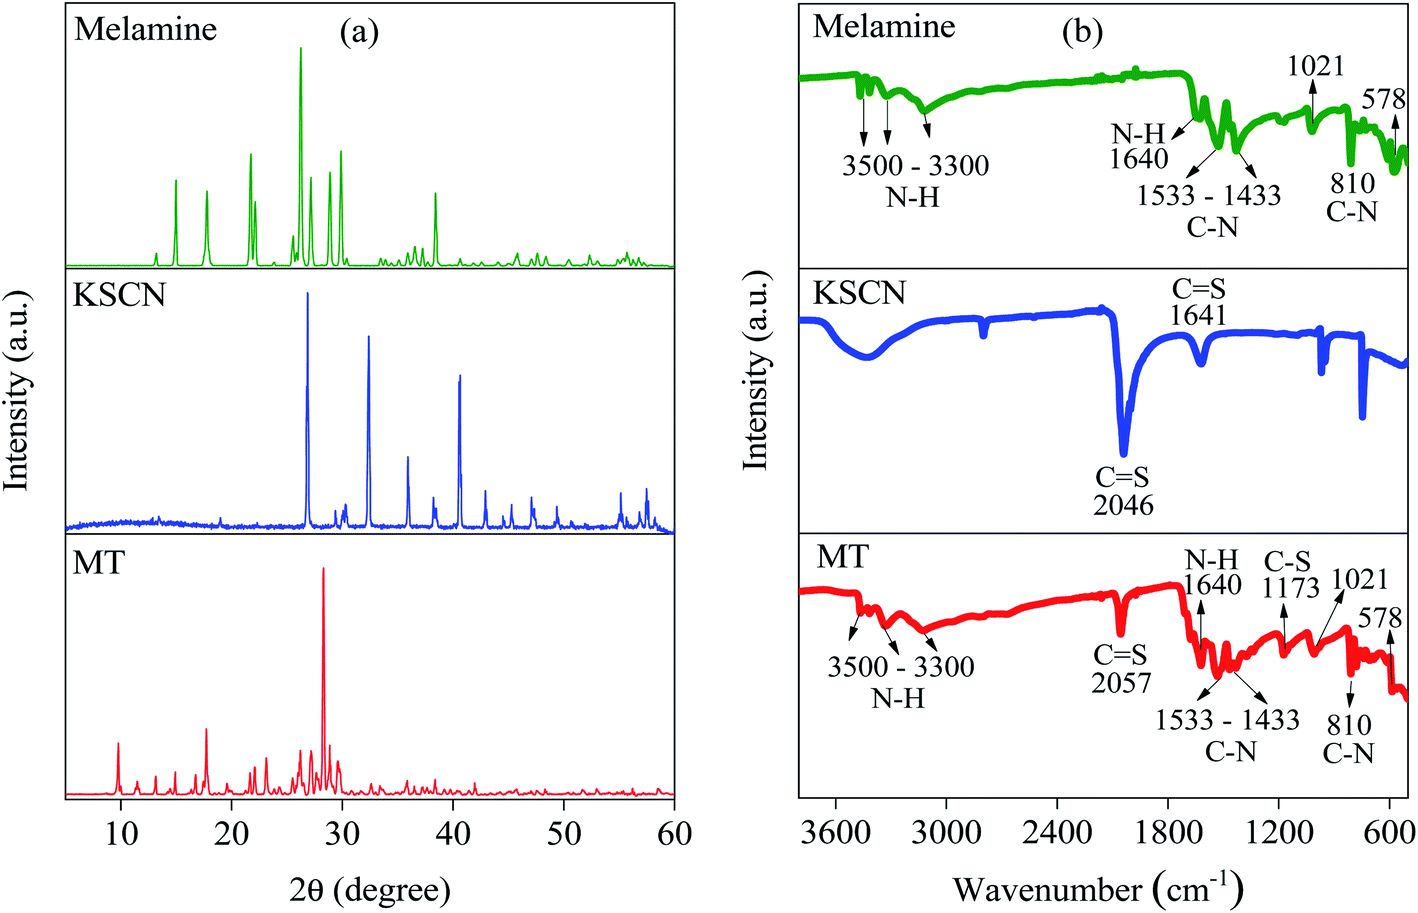 | ||
| Fig. 1 (a) XRD and (b) FTIR spectra of melamine, KSCN and MT. | ||
Fig. S1 (ESI†) displays the XRD patterns of graphite, GO and MT-PRGO. The sharp peak of GO at 2θ = 10.4° indicating an interlayer distance of 0.78 nm is due to the presence of the oxygen functional groups on the surface of the GO sheets which lead to larger separation between the layers as compared to graphite.30 This peak is further shifted to 2θ = 9.9° in MT-PRGO suggesting an increased interlayer spacing of 0.90 nm due to the chemical grafting of MT onto the GO sheets which could result in larger spacing between the exfoliated layers due to the bulky size of the MT ligands.26,30
To confirm the functionalization of the amine groups of melamine with thiourea, 1H NMR spectra of pure melamine and MT were obtained in the DMSO-D6 solvent and the results are displayed in Fig. S2 (ESI†). The melamine spectrum displays the characteristic singlet peak with a chemical shift 6.09 ppm (s, 6H) due to the NH2 protons consistent with the reported spectrum.31 However, the spectrum of the MT ligand displays two characteristic peaks at 9.58 ppm (s, 3H) and 13.25 ppm (s, 6H) which can be assigned to the NH and NH2 protons, respectively in MT.24 Therefore, the NMR spectrum of MT provides conclusive evidence for the functionalization of all the amine groups of melamine.
The chemical functionalization of GO by the MT chelating ligand is characterized by FTIR spectroscopy as shown in Fig. 2(a) and (b) which compare the FTIR spectra of GO and MT-PRGO. The GO spectrum shows the peaks related to OH, CO, CC, C–O epoxy, and C–O hydroxyl groups at 2500–3500, 1738, 1622, 1362, and 1226–1050 cm−1, respectively.32 The MT-PRGO spectrum shows the presence of different functional groups related to the MT chelating ligand such as CS, C–S, C–N, N–H, and triazine. Also, the carbonyl functional group in GO has a stretching vibration at 1735 cm−1 but after chemical modification, this peak shows a redshift to 1695 cm−1 due to the formation of peptide bonds between GO carboxylic acid functional groups and MT chelating ligand functional groups.23,26
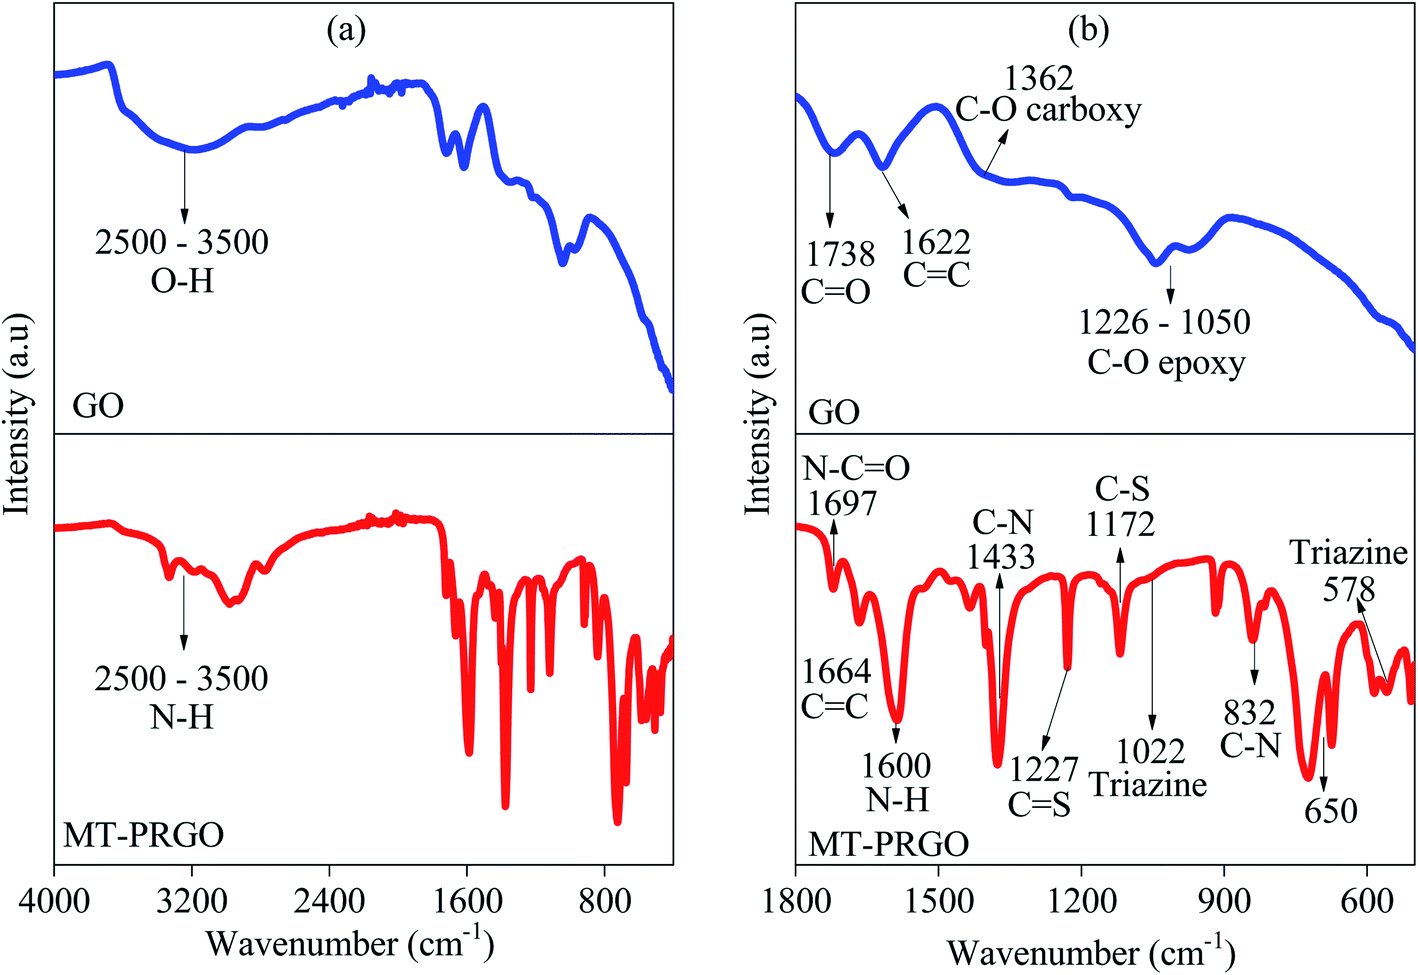 | ||
| Fig. 2 FTIR spectra of (a) GO and MT-PRGO, (b) expaned region 500–1800 cm−1. | ||
The UV-Vis spectra of GO and MT-PRGO, displayed in Fig. S3(a) (ESI†) show two characteristic peaks: a shoulder at 309.0 nm in GO and at 288.1 nm in MT-PRGO and a second peak at 228.5 nm in GO and at 232.1 nm in MT-PRGO which can be assigned to π–π* transitions of CC bonds.33 The disappearance of the 309 nm peak and the red shift of the π–π* transition of the aromatic CC bond to 288 nm in the spectrum of MT-PRGO indicate the partial reduction of GO and the restoration of some of the CC bonds in the PRGO sheets.33
The Raman spectra of GO and MT-PRGO are displayed in Fig. S3(b) (ESI†), and they show the two characteristic peaks (G and D bands at 1587.6 and 1347.6 cm−1, respectively) of graphene-based materials.30,33 The G band is associated with the stretching vibration of the conjugated CC groups and it appears at almost the same frequency of 1592 cm−1 in GO and MT-PRGO.30,33 The D band is related to the disorder in the graphitic structure, and the degree of disorder and extent of defects in the graphitic structures are typically determined by the intensity ratio of the D-band to the G-band (ID/IG). The ID/IG ratio of GO (0.93) increases after the chemical modification with MT to 1.07, suggesting an increase in the degree of disorder and number of defects in the partially reduced GO sheets of the MT-PRGO. In addition, a new Raman peak at 503 cm−1 is observed in the spectrum of MT-PRGO and is assigned to the C–S stretching thus providing evidence for the covalent functionalization of GO by MT.34
The chemical attachment of the MT ligand onto the surface of the GO nanosheets is also evident by the XPS data shown in Fig. S4 (ESI†). The survey scans of GO and MT-PRGO, displayed in Fig. S4(a) and (b),† respectively, show two peaks corresponding to C 1s and O 1s photoelectrons in both the GO and MT-PRGO scans in addition to three new peaks corresponding to the N 1s and S 2s and S 2p photoelectrons only observed in the MT-PRGO scan. These observations are consistent with the covalent attachment of MT ligands to the GO nanosheets.23,26 Deconvolution of the C 1s spectrum of GO shown in Fig. S4(c),† identifies four peaks at binding energies of 284.8, 285.9, 286.7, and 288.1 eV corresponding to photoelectrons in C–C/CC, C–OH, C–O–C, and CO, respectively. However, the MT-PRGO C 1s spectrum, shown in Fig. S4(d),† shows five peaks at binding energies of 284.8, 285.2, 286.8, 288.4, and 287.9 eV corresponding to CC/C–C, C–N, C–O/C–S, CN/N–CO, and CO photoelectrons, respectively. These results indicate that after the amidation reaction, the peak at 285.9 eV (C–OH) in GO disappears and the peak at 288.1 eV (CO) is shifted to 287.9 eV due to the formation of the peptide bonds. Moreover, the appearance of C–N, C–S, and CN peaks in the MT-PRGO C 1s spectrum (Fig. S4(d)†) confirms the presence of the MT chelating ligand on the surface of GO.14,25,26,32 The XPS spectra of the O 1s electrons in GO and MT-PRGO shown in Fig. S5(a) and (b), respectively (ESI†) also confirm the amide covalent bond formation in MT-PRGO. The O 1s peak (531.2 eV) due to the OC–O group in GO disappears in the spectrum of MT-PRGO (Fig. S5(b)†) due to the formation of the amide covalent bond.26 Finally, the S 2p and N 1s spectra of MT-PRGO shown in Fig. S5(c) and (d), respectively (ESI†) provide evidence for the presence of the SC (164.5 eV), N–CO (399.0 eV) and N–C (400.0 eV) groups on the surface of MT-PRGO nanosheets.
The morphologies of MT, GO, and MT-PRGO are investigated by SEM and TEM as shown in Fig. 3. The images indicate that MT has an irregular shape with a rough surface (Fig. 3(a) and (b)) while GO has a layered structure with a smooth surface (Fig. 3(c) and (d)). However, the morphology of the MT-PRGO adsorbent exhibits a wrinkled-like morphology (Fig. 3(e)) and the TEM image in Fig. 3(f) shows the very thick sheets due to the grafting of the MT ligands on the surface of the PRGO nanosheets.
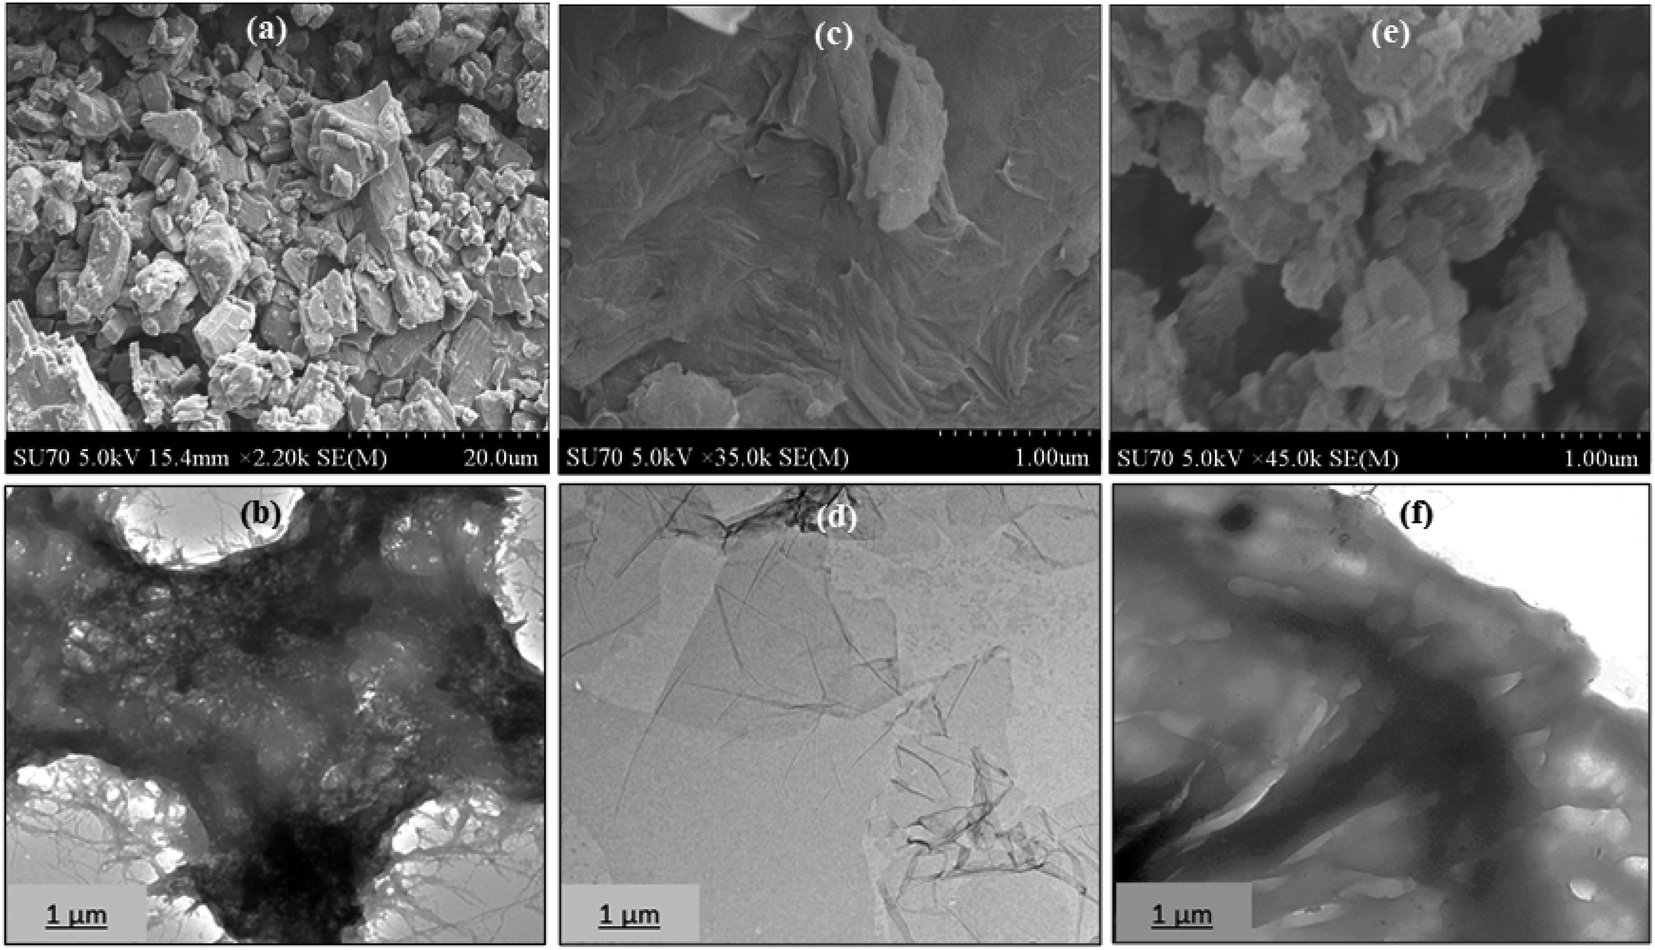 | ||
| Fig. 3 SEM and TEM images of (a and b) MT, (c and d) GO, and (e and f) MT-PRGO. | ||
3.2. Adsorption capacity of MT-PRGO for Hg(II), Co(II) and Cu(II)
The effect of pH on the removal efficiency of Hg(II), Co(II) and Cu(II) by MT-PRGO (Fig. S6, ESI†) shows that the maximum sorption capacity occurs at pH 5.5. The adsorption capacity of the MT-PRGO increases with increasing the pH of the solution since at acidic conditions the transformation of NH2 into NH3+ results in a few –NH2 sites on the MT-PRGO surface available to coordinate with the metal ions. Since the Hg(II), Co(II) and Cu(II) ions start to precipitate as hydroxides at pH > 6, pH 5.5 is selected for further investigation of the removal of the metal ions. The effect of initial concentrations of the metal ions on the adsorption capacity of Hg(II), Co(II) and Cu(II) onto the MT-PRGO adsorbent is shown in Fig. 4. It is clear that the amount of metal ions adsorbed on the MT-PRGO increases by increasing the initial concentrations of the heavy metals owing to the higher driving force of the concentration gradient at the solid–liquid interface until it reaches the state of equilibrium saturation. The results show that the efficiency of the Hg(II) removal (at pH 5.5) is 100% for initial concentrations up to 100 ppm and a maximum adsorption capacity of 651 mg g−1 could be achieved from an initial concentration as high as 1300 ppm. Similarly, the maximum adsorption capacities of Co(II) and Cu(II) are found to be 98.0 mg g−1 and 50.0 mg g−1 from initial concentrations of 800 and 400 mg L−1, respectively as shown in Fig. 4(c).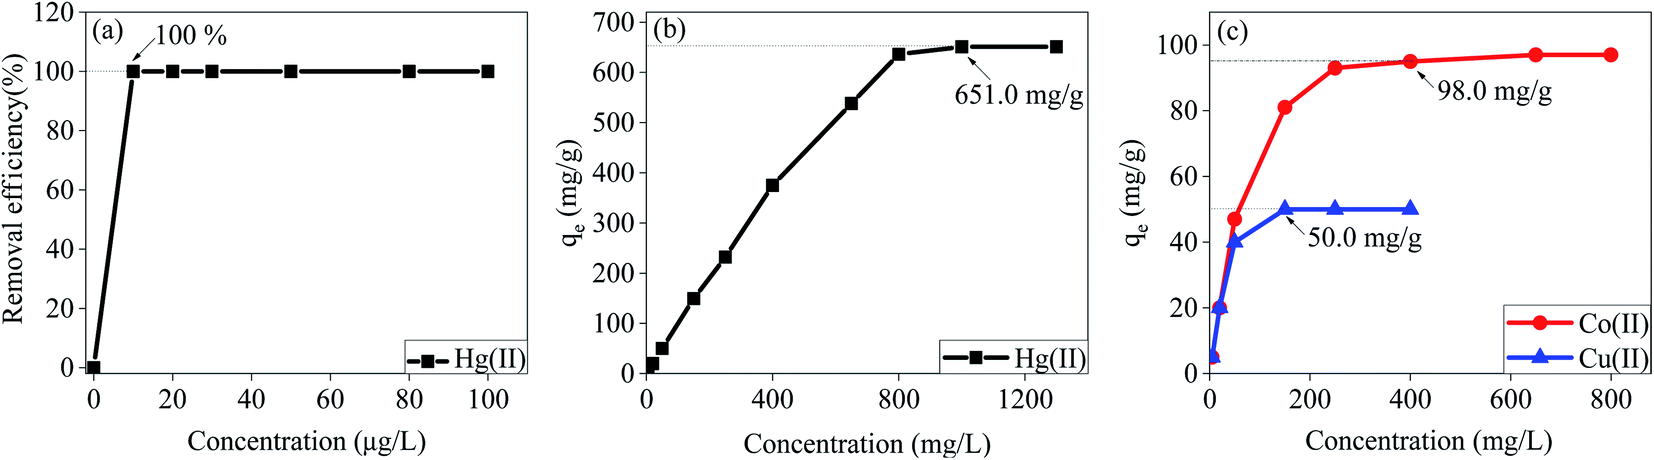 | ||
| Fig. 4 Effect of initial concentration on the removal of (a) Hg(II), C0 = 10–100 μg L−1, (b) Hg(II), C0 = 5–1300 mg L−1, (c) Co(II), C0 = 5–800 mg L−1 and Cu(II), C0 = 5–400 mg L−1 [conditions: pH 5.5, T = 298 K, adsorbent dose = 0.005 g/5 mL]. | ||
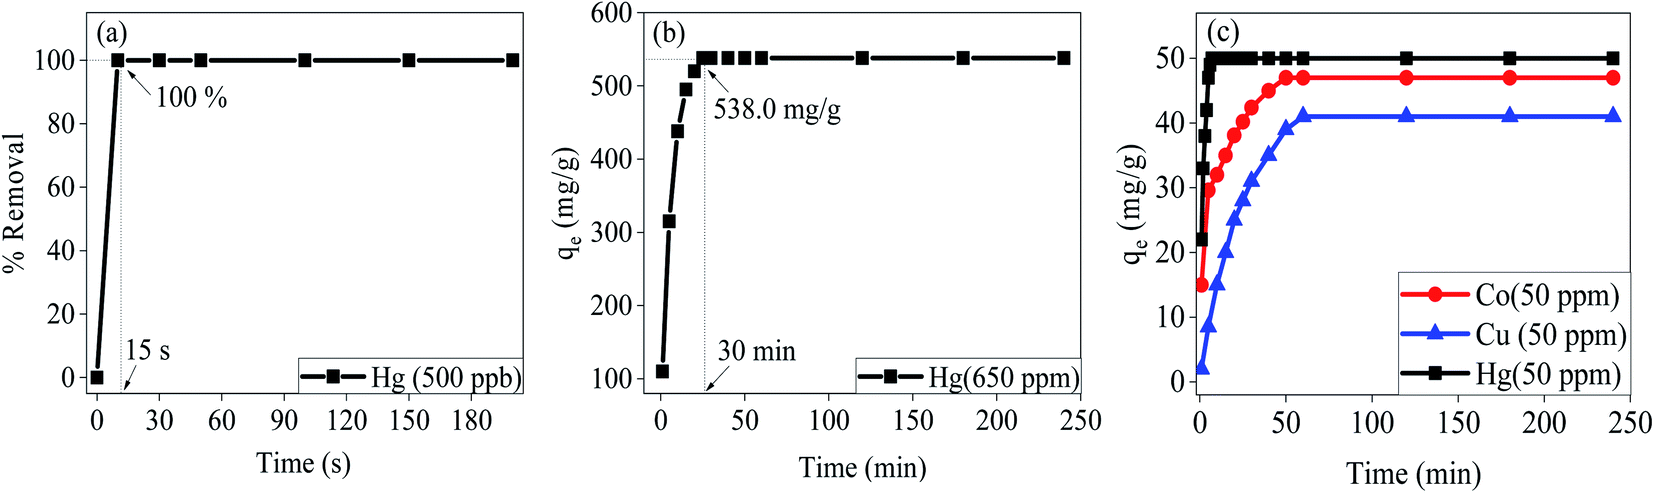
Fig. 5(a) and 6(b) illustrate the effect of contact time on the extraction of Hg(II) with initial concentrations of 500 ppb and 650 ppm, respectively at pH 5.5 by the MT-PRGO adsorbent. The adsorbent shows very fast kinetics at a 500 ppb concentration of Hg(II) and requires only 15 seconds to reach 100% removal efficiency. At 650 ppm and 50 ppm concentrations of Hg(II), the adsorbent reaches removal efficiencies of 83% (Fig. 5(b)) and 100% (Fig. 5(c)), respectively after 30 min which is still very fast compared to other Hg(II) adsorbents in the literature.11,16,21,23,24,26 For Co(II) and Cu(II) at 50 ppm, removal efficiencies of 90% and 80% are reached after 60 min as shown in Fig. 5(c).
 | ||
| Fig. 5 Effect of contact time on the removal of (a) Hg(II), C0 = 500 μg L−1, (b) Hg(II), C0 = 650 mg L−1, (c) Hg(II), Co(II), and Cu(II), C0 = 50 mg L−1 [conditions: pH 5.5, T = 298 K, adsorbent dose = 0.005 g/5 mL]. | ||
 | ||
| Fig. 6 FTIR spectra of (a) melamine and MP, and (b) ZrP and M-ZrP. | ||
The experimental isotherms shown in Fig. 4 and 5 are interpreted using the Langmuir isotherm model as shown in Fig. S7(a)† and the calculated parameters are summarized in Table S1 (ESI†). The calculated maximum adsorption capacities of 661.6, 98.8, and 50.1 mg g−1 for Hg(II), Co(II) and Cu(II), respectively based on the Langmuir model are in excellent agreement with the experimental values of 651, 98 and 50 mg g−1, respectively. This indicates that the adsorption of these metal ions involves the formation of a monolayer coverage on the surface of the MT-PRGO adsorbent. The pseudo-second order kinetic model shows a good fit for the experimental data as shown in Fig. S7(b)† and the calculated parameters are summarized in Table S2 (ESI†).
The effect of interfering ions is studied using a mixture containing Hg(II), Cd(II), Co(II), Cu(II), Zn(II), and Ni(II) ions with initial concentrations of C0 = 500 μg L−1 and C0 = 200 mg L−1. The results, shown in Fig. S8 and Table S3 (ESI†) indicate that at 500 μg L−1 initial concentration the removal efficiencies for all studied heavy metals in the solution are 100%. However, at the higher initial concentration of 200 mg L−1, the MT-PRGO adsorbent shows higher selectivity toward Hg(II) and Cd(II) with removal efficiencies of 70.5% and 40%, respectively. The high selectivity towards Hg(II) and Cd(II) can be explained based on the soft acid character of these ions which interact strongly with the S and N active chelating sites (classified as soft bases) on the surface of MT-PRGO. Therefore, the MT-PRGO adsorbent forms strong complexes with Hg(II) and Cd(II) in comparison with metal ions such as Cu(II), Zn(II) and Ni(II) which are classified as borderline acids.24
The regeneration of the MT-PRGO adsorbent is demonstrated using different concentrations of nitric acid as eluents to desorb Hg(II) ions from the surface of the adsorbent. The results, shown in Table S4 and Fig. S9 (ESI†), indicate that the active sites on the surface of MT-PRGO could be 100% reactivated by using a 2.0 M HNO3 solution. Fig. S9† demonstrates that the MT-PRGO adsorbent can be reused for six cycles with a removal efficiency of Hg(II) above 95%. Therefore, the MT-PRGO has the potential for high efficiency and economic feasibility for commercial applications for the removal of Hg(II) from contaminated water.
It is clear from the above results that the incorporation of the chelating ligand melamine thiourea (MT) containing S and N hetero-atoms within the partially reduced graphene oxide containing O functional groups leads to a novel MT-PRGO adsorbent that displays one of the highest maximum adsorption capacity for Hg(II) ions in water. Compared to the other adsorbents, the MT-PRGO has higher overall performance compared to functionalized MOFs, GO, and mesoporous silica.16,23,24,26,35–41
3.3. Design and characterization of melamine zirconium phosphate (M-ZrP)
The design strategy for the synthesis of melamine zirconium phosphate (M-ZrP) involves two steps as summarized in Scheme 2. The first step is the preparation of melamine phosphate (MP) by the acid–base reaction between phosphoric acid as a proton donor and melamine as a proton acceptor to form MP.25 The second step is the formation of amorphous M-ZrP by a gel method based on a precipitation reaction between MP and ZrCl4 similar to the reaction between phosphoric acid and ZrCl4.18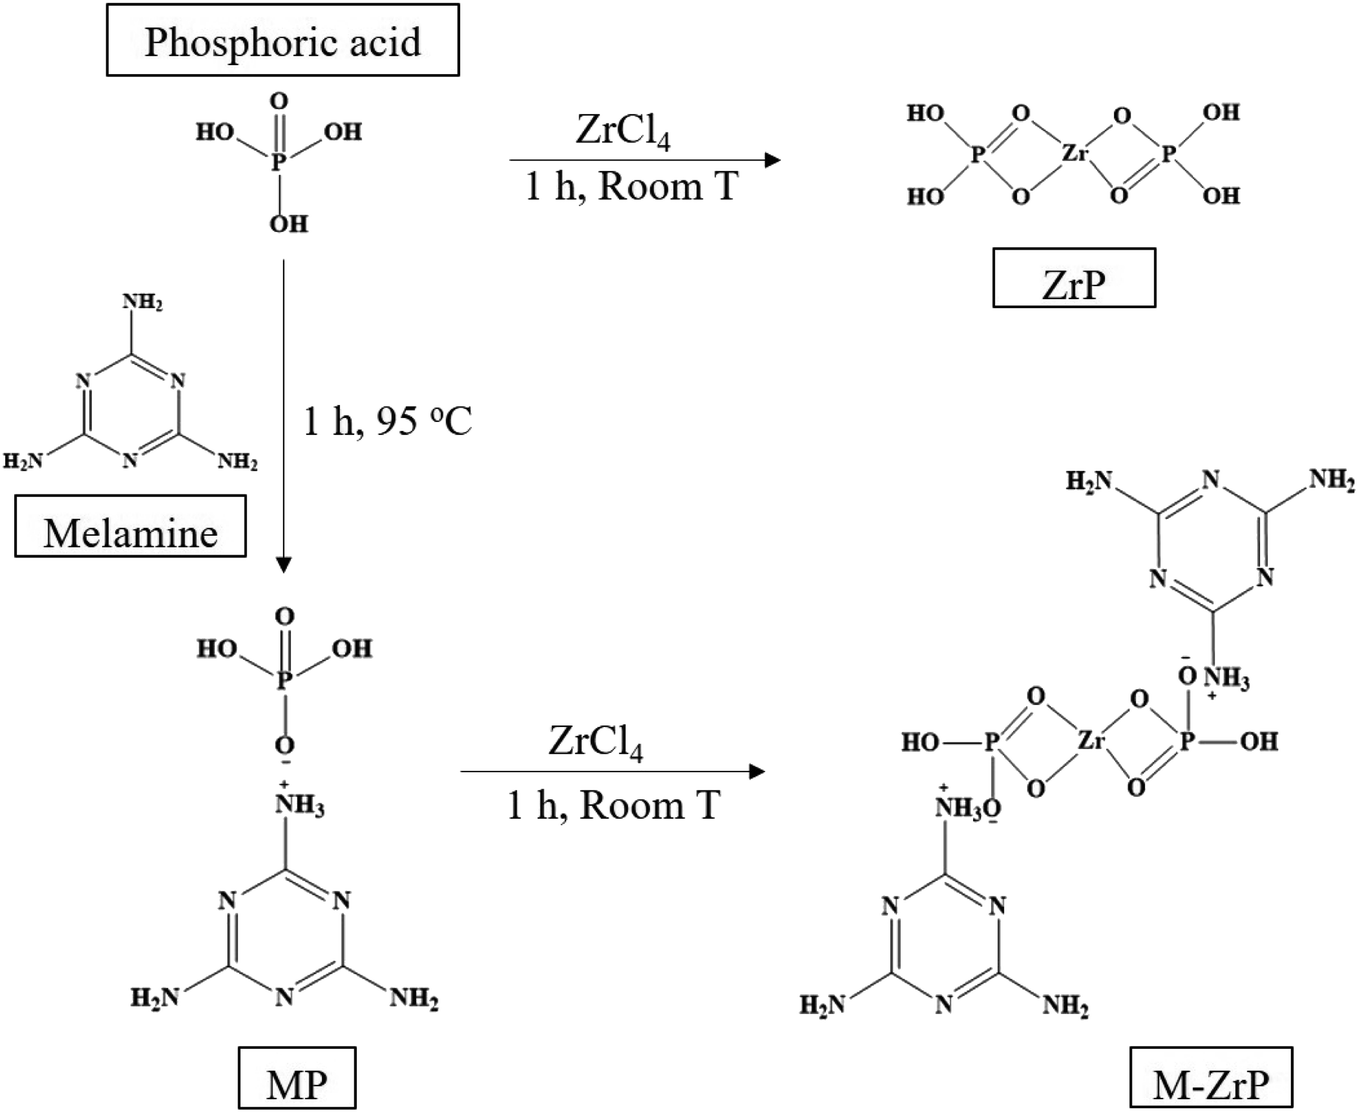 | ||
| Scheme 2 General procedure for the preparation of melamine zirconium phosphate (M-ZrP) from melamine and ZrP. | ||
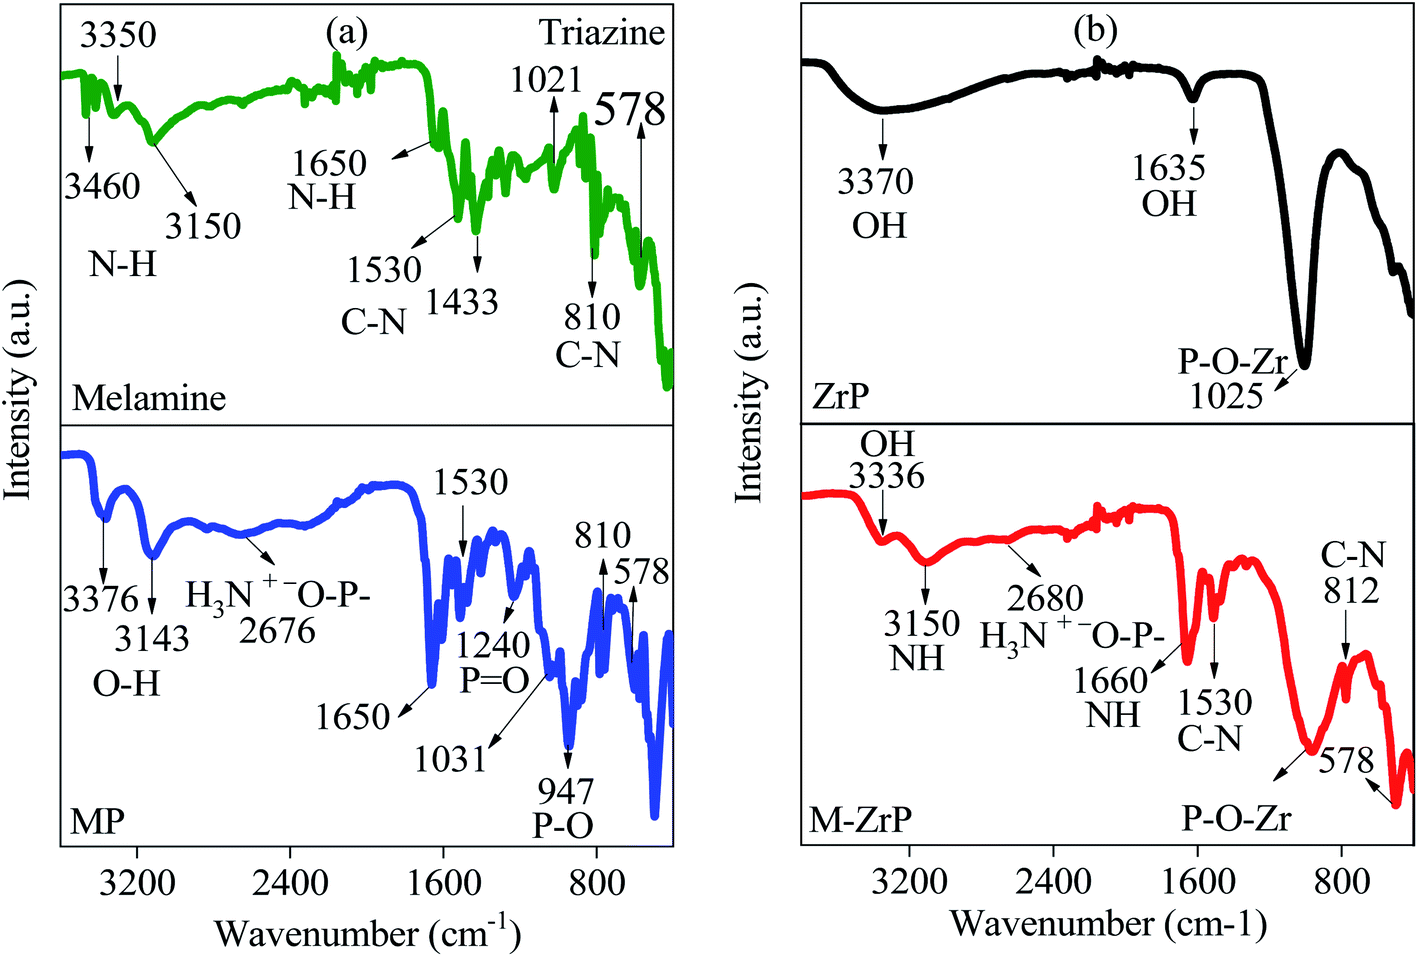
Fig. 6 shows comparisons between the FTIR spectra of melamine, MP, ZrP, and M-ZrP. It is clear that the four spectra have common peaks in the region between 3000–3500 cm−1 which can be attributed to –N–H and –O–H stretching vibrations. In addition, the spectra of melamine, MP and M-ZrP show peaks at 1650, 1400–1550, 810, and 1020–570 cm−1 assigned to the –N–H bending, –C–N stretching, –C–N bending, and triazine ring vibrations, respectively.18,25 The spectra of MP, ZrP and M-ZrP show a prominent peak in the range of 920 to 1200 cm−1 which can be assigned to the (P–O) stretching vibration which is blue shifted in the case of ZrP and M-ZrP due to the interaction with zirconium. Moreover, the MP and M-ZrP spectra show a broad and weak peak between 2676–2680 cm−1 due to the interaction between the –NH2 and OP–OH groups.25,42,43
The formation of M-ZrP is also confirmed by the XPS spectra shown in Fig. 7. For comparison, the XPS spectra of MP and ZrP are displayed in Fig S10 and S11, respectively (ESI†). The survey spectra of MP (Fig. S10(a)†), ZrP (Fig. S11(a)†) and M-ZrP (Fig. 7(a)) show peaks at electron binding energies of 532.7, 189.5 and 153.0 eV corresponding to the O 1s, P 2s and P 2p electrons, respectively. In addition, the MP (Fig. S10(a)†) and M-ZrP (Fig. S11(a)†) spectra have common peaks at binding energies of 399.4 and 286.2 eV assigned to the N 1s and C 1s electrons, respectively. Moreover, the ZrP (Fig. S11(a)†) and M-ZrP (Fig. 7(a)) spectra show peaks at binding energies of 347.1 and 187.8 eV corresponding to Zr 3p and Zr 3 d electrons, respectively, and these peaks do not appear in the MP spectrum (Fig. S10(a)†). The XPS surface elemental compositions of the MP, ZrP and M-ZrP adsorbents are summarized in Table S5 (ESI†).
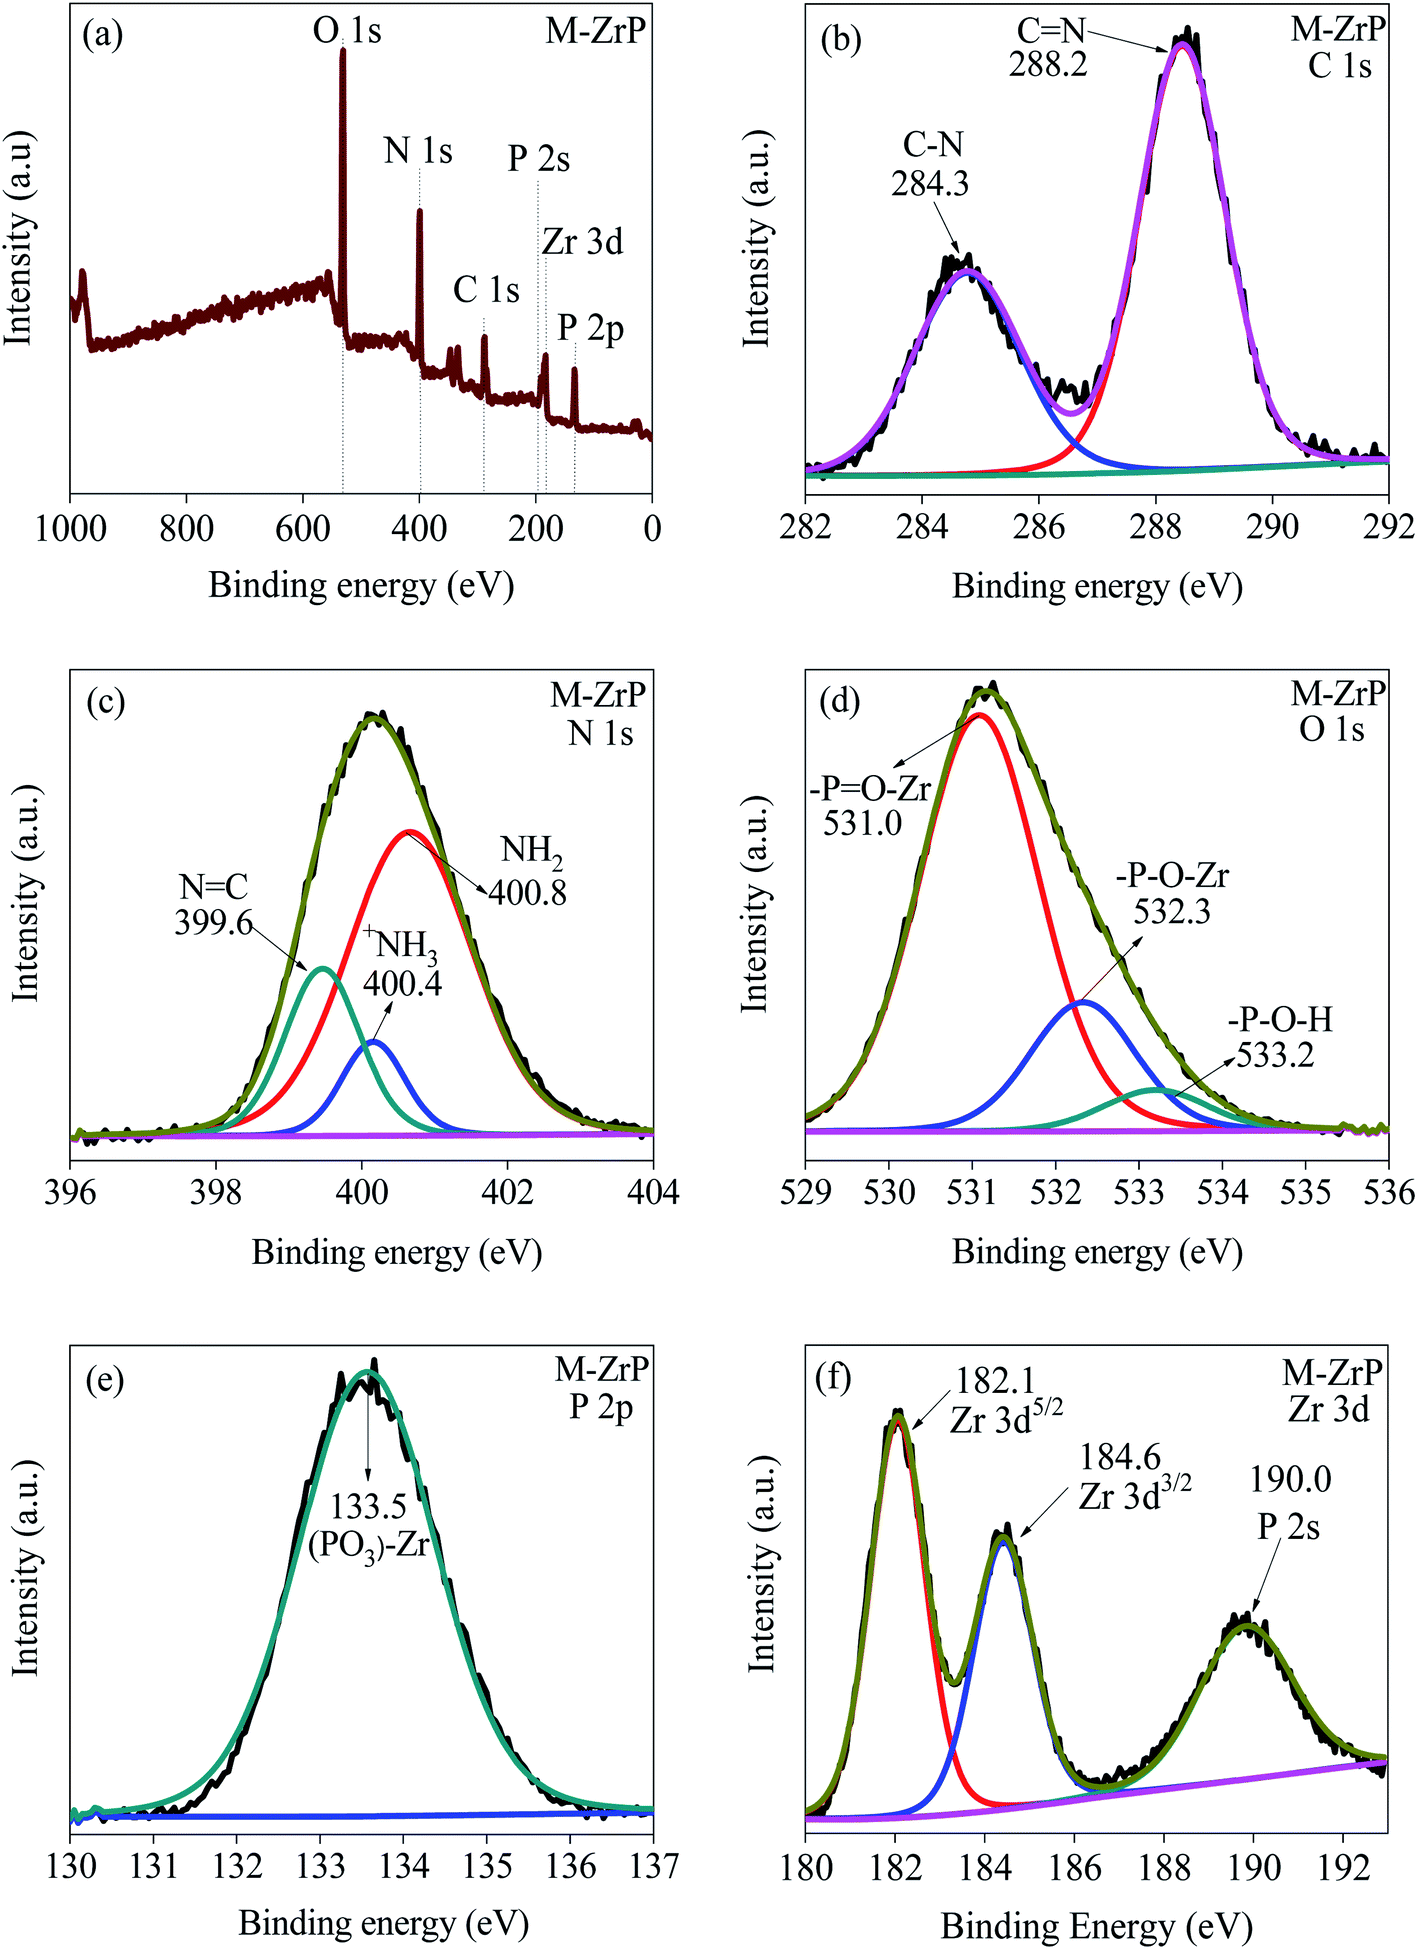 | ||
| Fig. 7 XPS spectra of M-ZrP. (a) Survey spectrum and high-resolution spectra of (b) C 1s, (c) N 1s, (d) O 1s, (e) P 2p, and (f) Zr 3d electrons in M-ZrP. | ||
The high-resolution XPS spectra of the C 1s, N 1s, O 1s, P 2p, and Zr 3d photoelectrons in M-ZrP are displayed in Fig. 7(b)–(f), respectively. The C 1s spectra of M-ZrP (Fig. 7(b)) and MP (Fig. S10(b)†) are similar consisting of two peaks at binding energies of 288.2 and 284.3 eV assigned to CN and C–N electrons, respectively. Also, the N 1s spectra in both M-ZrP (Fig. 7(c)) and MP (Fig. S10(c)†) are similar and show contributions from the N 1s electrons in the NC, +NH3, and NH2 groups.44 The similarity of the C 1s and N 1s spectra in both M-ZrP and MP indicates that the attachment of Zr to MP does not take place through the CN, C–N, NC, or the NH2 functional groups. On the other hand, the spectrum of the P 2p electron shifts from 134.0 eV in MP (Fig. S10(d)†) to 133.5–133.6 eV in both ZrP (Fig. S11(c)†) and M-ZrP (Fig. 7(e)) indicating a stronger interaction between P and Zr in both ZrP and M-ZrP. Moreover, the observed shift of the Zr 3d3/2 and Zr 3d5/2 binding energies of 183.5 and 181.3 eV, respectively to higher energies in both ZrP (Fig. S11(d)†) and M-ZrP (Fig. 7(f)) (184.6 eV for Zr 3d3/2 and 182.1 eV for Zr 3d5/2) indicating again stronger interaction between Zr and P in ZrP and M-Zr-P.47 Finally, the significant shift and split of the O 1s binding energy of PO in MP (531.7 eV in Fig. S10(e)†) to 531.0 and 532.3 eV in ZrP (Fig. S11(b)†) and M-ZrP (Fig. 7(d)) indicate the formation of PO–Zr and P–O–Zr bonds in ZrP and M-ZrP.45,46
The morphologies of ZrP, MP and M-ZrP adsorbents are examined using the SEM and TEM images shown in Fig. 8. From the SEM images, it is clear that MP has rod-like shape while ZrP and M-ZrP have irregular shape morphologies. The TEM images show that ZrP and M-ZrP consist of small particles connected together in mesoporous structures, while MP has a less porous structure. The Brunauer–Emmett–Teller (BET) surface areas of the MP, ZrP and M-ZrP adsorbents, measured by N2 adsorption–desorption isotherms (Fig. S12 and Table S6, ESI†) show that the M-ZrP and ZrP adsorbents have higher surface areas (320 and 300 m2 g−1, respectively) than MP (9 m2 g−1).
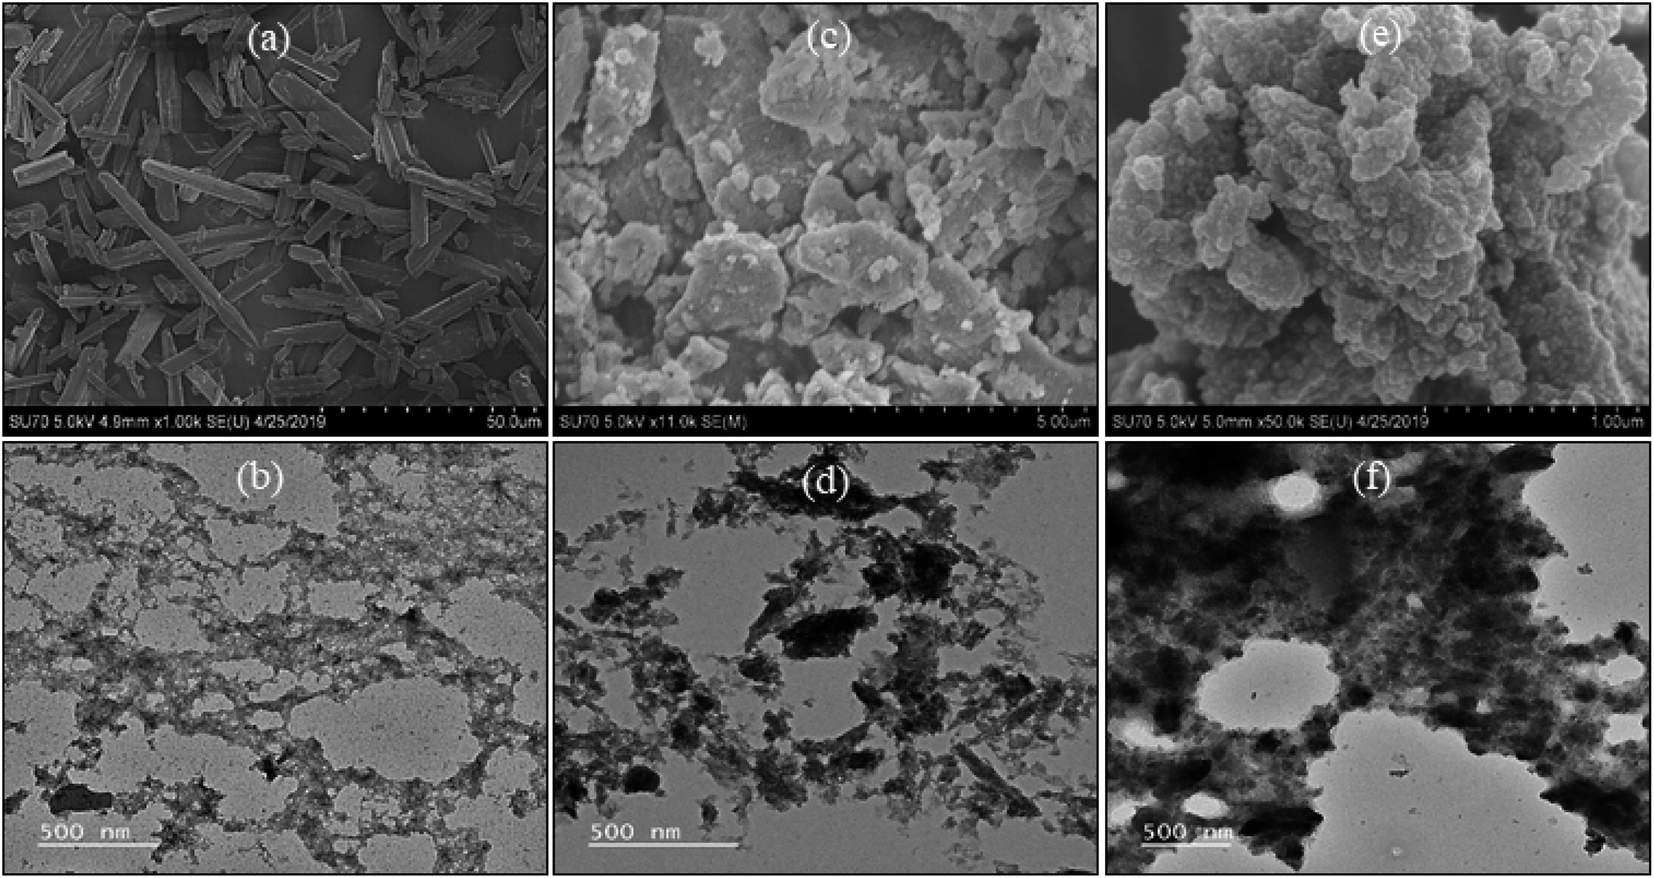 | ||
| Fig. 8 SEM (top) and TEM (bottom) images of (a and b) MP, (c and d) ZrP, and (e and f) M-ZrP. | ||
3.4. Adsorption capacity M-ZrP for Pb(II), Hg(II) and Cd(II)
Similar to the effect of pH on the removal efficiency of Hg(II) by MT-PRGO, the maximum sorption capacity of Pb(II) on M-ZrP occurs at pH 5.5 (Fig. S13, ESI†). The effect of initial concentration of Pb(II) on the adsorption capacity on the M-ZrP adsorbent is shown in Fig. 9. Using an adsorbent dose of 1 g L−1 at pH 5.5, the removal efficiency of Pb(II) is 100% for initial concentrations of 50 ppb up to 200 ppm as shown in Fig. 9(a) and (b). As shown in Fig. 9(b), an adsorption capacity of 680 mg g−1 is achieved from an initial concentration of 1000 ppm. However, by increasing the adsorbent dose to 2 g L−1, a maximum adsorption capacity of 1000 mg g−1 can be achieved as shown in Fig. 9(c). Similarly, maximum adsorption capacities of Hg(II) and Cd(II) of 250.0 mg g−1 and 180.0 mg g−1 could be achieved at initial concentrations of 250 and 200 mg L−1, respectively using an adsorbent dose of 3 g L−1 as shown in Fig. 9(c). This is attributed to the availability of more active sites at a higher dosage of the M-ZrP adsorbent which can be used to extract higher concentrations of toxic metal ions from solutions. These results demonstrate the high performance of the M-ZrP adsorbent to extract toxic metal ions especially Pb(II) from polluted water. The high adsorption capacity of the M-ZrP could be attributed to the presence of different nitrogen and oxygen hetero-atoms. For example, the presence of melamine with three basic nitrogen atoms in the triazine ring and three free amine groups adds tremendous ability to chelate heavy metal ions from solutions by forming strong coordination complexes.47 The effect of incorporation of melamine into ZrP is clearly demonstrated by comparing the adsorption capacity of Pb(II) ions on the ZrP and M-ZrP adsorbents as shown in Fig. S13 (ESI†). In spite of the similar BET surface areas of ZrP and M-ZrP (300 and 320 m2 g−1, respectively), the adsorption capacity for Pb(II) is significantly higher on M-ZrP (680 mg g−1) than on ZrP (344 mg g−1). This is clearly due the strong chelating ability of the nitrogen functional groups of melamine.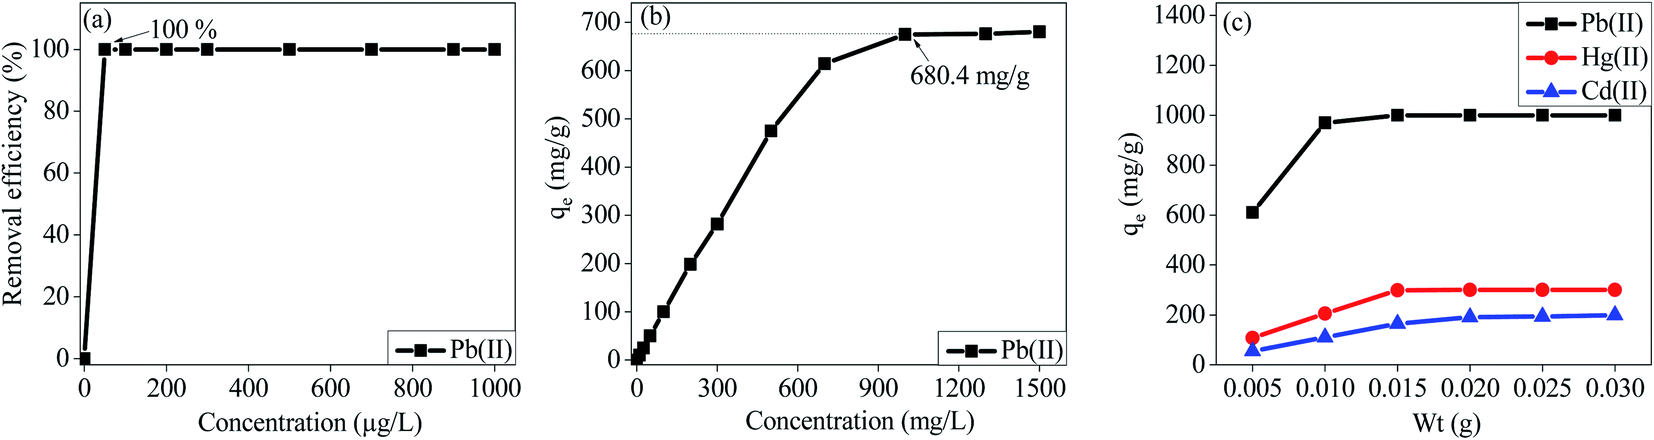 | ||
| Fig. 9 Effect of initial concentration on the removal of Pb(II) at (a) [C0 = 50–1000 μg L−1] and (b) [C0 = 10–1500 mg L−1]. (c) Effect of adsorbent dose on the removal of Pb(II), Hg(II) and Cd(II) ions by M-ZrP [conditions: C0 = 1000 mg L−1 for Pb(II), 250 mg L−1 for Hg(II) and 200 mg L−1 for Cd(II), pH 5.5, T = 298 K and adsorbent dose = 0.005–0.030 g/5 mL]. | ||
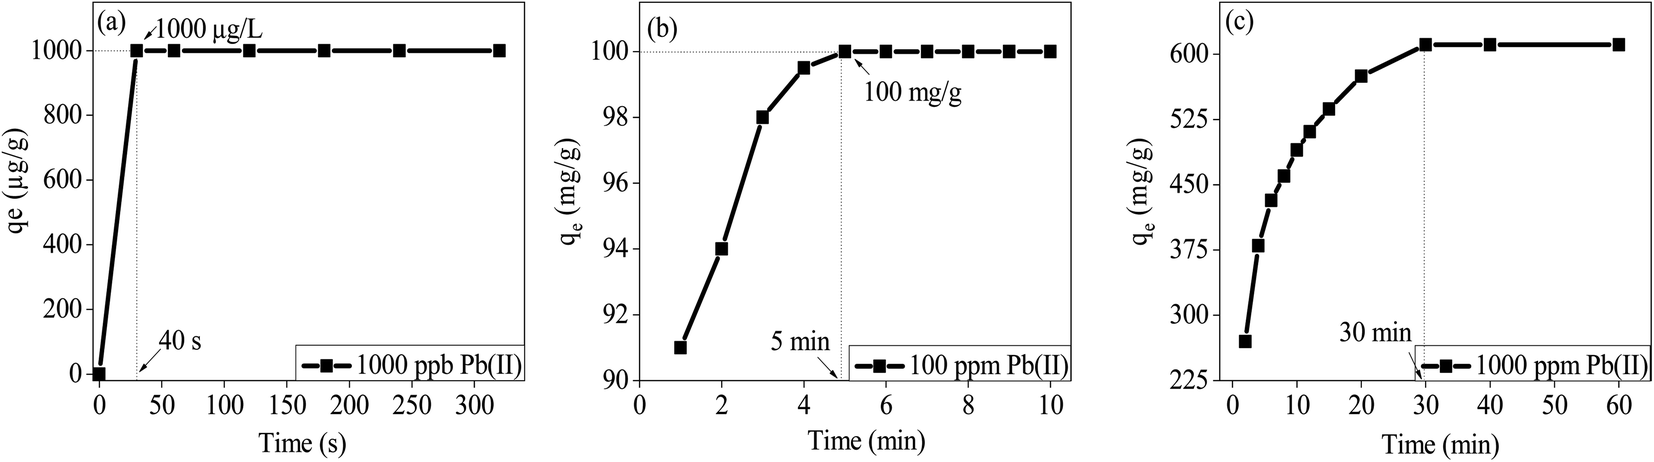
The effect of contact time on the adsorption of Pb(II) on M-ZrP is illustrated in Fig. 10. At very low initial concentrations of Pb(II) below 1000 ppb, the equilibrium time required for the 100% removal is only 40 seconds (Fig. 10(a)), and for higher concentrations such as 100 ppm and 1000 ppm, the equilibrium times are 5 min and 30 min, respectively (Fig. 10(b) and (c)). The fast and efficient adsorption of Pb(II) ions on M-ZrP is remarkable especially by comparing the 5 min equilibrium time required for the 100% removal of the 100 ppm Pb(II) ions (Fig. 10(b)) with the 45 min required for the removal of 72% and 44% of the 100 ppm Hg(II) and Cd(II) ions, respectively as shown in Fig. S15 (ESI†).
 | ||
| Fig. 10 Effect of contact time on the removal of Pb(II) ions on M-ZrP at (a) C0 = 1000 μg L−1, (b) C0 = 100 mg L−1 and (c) C0 = 1000 mg L [conditions: pH 5.5; T = 298 K, adsorbent dose = 0.005 g/5 mL]. | ||
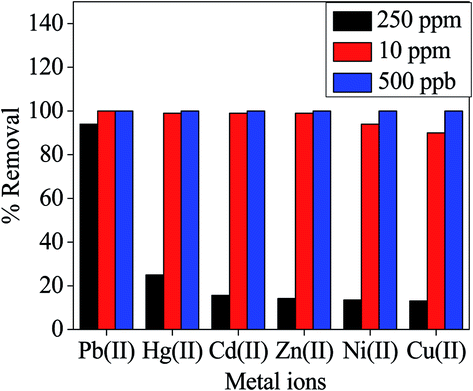
The excellent selectivity of M-ZrP towards the adsorption of Pb(II) ions is also demonstrated in Fig. 11 which displays the removal efficiency from a mixture containing Pb(II), Hg(II), Cd(II), Zn(II), Ni(II), and Cu(II) ions at three different concentrations. At the lowest concentration of 500 ppb, 100% removal efficiency of all the ions is achieved and no selectivity is observed at this low concentration. Even at a concentration of 10 ppm, the removal efficiency is still 100% for most of the ions in the mixture. However, at the high concentration of 250 ppm, the M-ZrP adsorbent exhibits more than 95% removal efficiency of Pb(II) as compared to 25%, 16%, 14%, 13%, and 13% for Hg(II), Cd(II), Zn(II), Ni(II), and Cu(II) ions, respectively. Therefore, the M-ZrP adsorbent has tremendous selectivity for Pb(II) ions at high concentrations and can be used to remediate polluted water with high Pb(II) concentrations.
 | ||
| Fig. 11 Removal efficiency of metal ions from a mixture containing six metal ions. [Conditions: C0 = 250, 10 mg L−1, and 500 μg L−1 adsorbent dose = 0.005 g/5 mL, pH 5.5, T = 298 K]. | ||
Similar to the MT-PRGO adsorbent, 100% of the active sites on the M-ZrP adsorbent can regenerated by using 1.5 M HNO3 solution as shown in Table S7 (ESI†). Fig. S15 (ESI†) demonstrates that the M-ZrP adsorbent can be reused for five cycles with a removal efficiency of Pb(II) above 95%. Therefore, the M-ZrP adsorbent is an efficient and cost-effective adsorbent for Pb(II) removal from contaminated water.
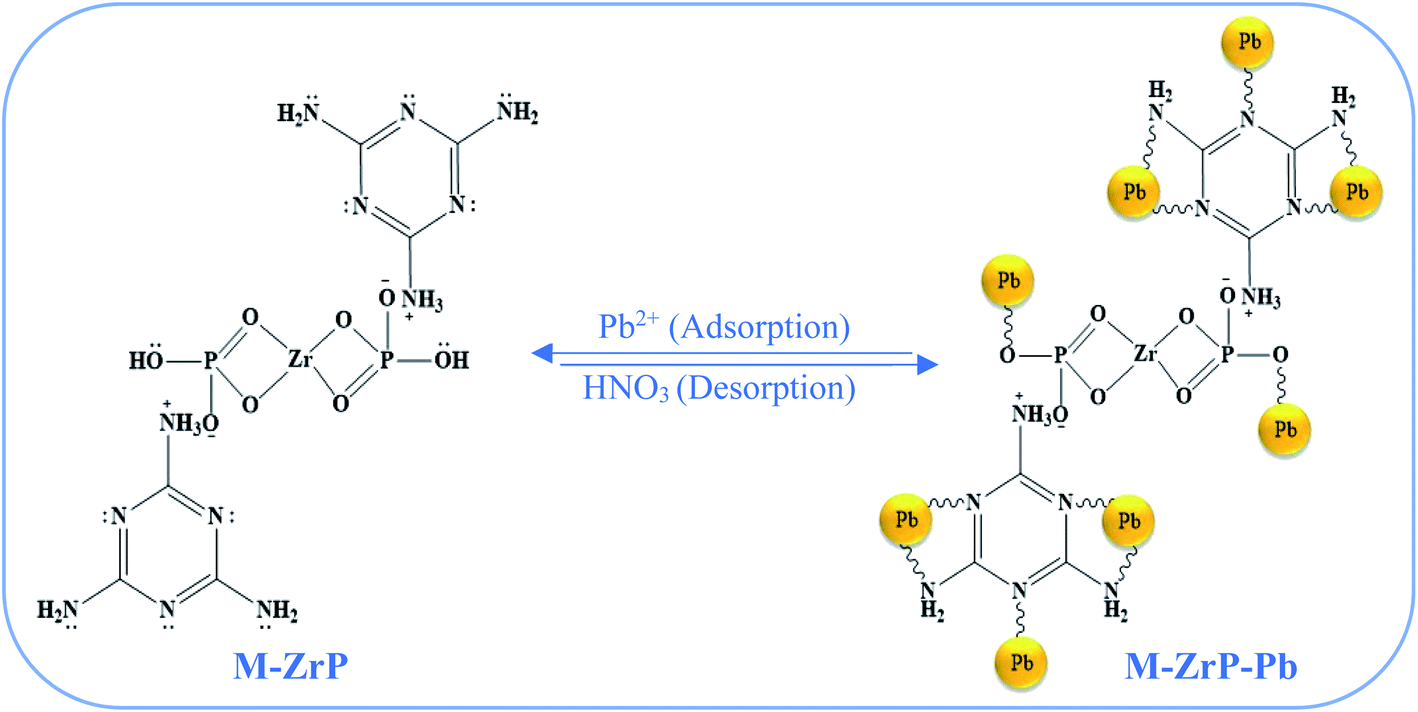
To gain insight into the adsorption mechanism of Pb(II) on the M-ZrP surface, XPS analyses of M-ZrP are performed after the adsorption of Pb(II) and the results are shown in Fig. S17 (ESI†). The Pb 4f spectrum (Fig. S17(b)†) shows two peaks at binding energies at 138.5 and 143.4 eV corresponding to the Pb 4f7/2 and Pb 4f5/2 photoelectrons, respectively.48 These two peaks appear at high binding energies compared to free lead atoms indicating strong interactions between the lead ions and the functional groups of the M-ZrP adsorbent to form Pb(II) coordination complexes.48,49 Both the C 1s and the Zr 3d spectra in M-ZrP before (Fig. 7(b) and (f), respectively) and after the Pb(II) adsorption (Fig. S17(c) and (d),† respectively) are similar thus indicating that the adsorption of Pb(II) ions does not take place on the C or on the Zr sites. However, for the N 1s spectrum in M-ZrP, the peaks at 399.6 eV and 400.8 eV assigned to (NC) and (NH2) groups, respectively (Fig. 7(c)) shift to higher binding energies after the Pb(II) adsorption (Fig. S17(e)†) suggesting complex formation with Pb(II).12 Interestingly, the N 1s peak at 400.4 eV assigned to (+NH3) (Fig. 7(c)) does not change position after the Pb(II) adsorption since +NH3 groups cannot coordinate Pb(II) ions. Finally, the O 1s peak at 533.1 eV assigned to the (P–O–H) group (Fig. 7(d)) undergoes significant shift to a higher binding energy after the Pb(II) adsorption (Fig. S17(f)†) indicating the formation of (P–O–Pb+) bond.49 On the other hand, the O 1s peaks at 531.0 eV and 532.3 eV assigned to the (PO–Zr) and (P–O–Zr) groups, respectively do not show any shift after the Pb(II) adsorption (Fig. S17(f)†) indicating that the Pb ions do not coordinate with the (PO–Zr) and (P–O–Zr) groups. Based on these results, the uptake of Pb(II) on the M-ZrP adsorbent is likely to take place by chemisorption through coordination bonds with the six basic nitrogen atoms and four free amine groups of the two triazine rings of melamine in addition to the two hydroxyl groups of ZrP according to the proposed mechanism shown in Scheme 3. In this mechanism, the Lewis base groups of melamine and the hydroxyl groups donate their lone pair of electrons to the Lewis-acid empty d-orbitals of the Pb(II) ions to form stable chelating complexes. The desorption of Pb(II) ions from the M-ZrP adsorbent by nitric acid occurs favorably because protons have higher coordination ability to adsorbent sites than the lead ions.12
 | ||
| Scheme 3 Proposed mechanism for the adsorption of the Pb(II) ions on the active sited of the M-ZrP adsorbent. | ||
Finally, it should be noted that the developed M-ZrP adsorbent exhibits one of the highest maximum adsorption capacity (qmax) of Pb(II) ions reported in literature for a variety of organic, inorganic, hybrid, and MOF adsorbents.48–64 The removal capacity for lead ions by M-ZrP is 680.4 mg g−1 and 1000 mg g−1 using an adsorbent dose of 1 g L−1 and 2 g L−1, respectively. This removal capacity is higher than most of the reported values for Pb(II) removal by other ZrP-modified adsorbents such as ZrP-chloromethylated polystyrene (556.0 mg g−1),51 polymer based-ZrP (398.0 mg g−1),19 Go-ZrP (363.4 mg g−1),21 ZrP-polysulfone (302.1 mg g−1),52 and ZrP-polyvinyl alcohol (121.1 mg g−1).53 Additionally, the qmax of M-ZrP is also higher than Zr-MOF and other functionalized MOF adsorbents such as MOF-polydopamine composite (349.0 mg g−1),54 NH2-functionalized Zr-MOF (177.3 mg g−1),55 MIL-68 (254.9 mg g−1),56 UiO-66-NHC(S)NHMe (232.0 mg g−1),57 UiO-66-EDTA (357.9 mg g−1),58 and UiO-66-aminothiouracil (386.9 mg g−1).59 The qmax of M-ZrP is also higher than or comparable to the best graphene-based adsorbents for Pb(II) removal such as chitosan-functionalized GO (556.2 mg g−1),60 GO-wrapped melamine sponge (349.7 mg g−1),61 and 3D-graphene/δ-MnO2 aerogels (643.6 mg g−1).62 Although the sulfur-functionalized porous lignin adsorbent exhibits higher qmax (952.0 mg g−1)63 than M-ZrP (680.4 mg g−1) at the 1 g L−1 adsorbent dose, this adsorbent requires 300 min to reach this high capacity while the M-ZrP requires only 30 min to achieve the maximum capacity. Moreover, the synthesis of the sulfur-functionalized lignin adsorbent involves complicated modifications with long processing time unlike the synthesis of M-ZrP which requires only 2 h under mild reaction conditions. Therefore, the M-ZrP adsorbent is clearly among the very top performing adsorbents reported in literature for the lead removal from contaminated industrial and wastewater.19–21,48–64
4. Conclusions and outlook
Two novel chelating adsorbents, based on the chemical modifications of graphene oxide and zirconium phosphate by melamine thiourea and melamine, respectively are developed for the effective extraction of the toxic metal ions Pb(II), Hg(II), Cd(II), Cu(II), Co(VI), and Zn(II) with high selectivity for Hg(II) and Pb(II) from metal-contaminated water. The first adsorbent melamine, thiourea-partially reduced graphene oxide (MT-PRGO) combines the heavier donor atom sulfur with the amine and triazine nitrogen's functional groups attached to the partially reduced GO nanosheets to effectively capture Hg(II) ions from water. The MT-PRGO adsorbent exhibits performance in both capacity and selectivity for Hg(II) superior to most of the reported materials used for the extraction of toxic metal ions from water. It displays a 100% removal of Hg(II) at concentrations up to 100 ppm and the adsorption is exceptionally rapid resulting in a 100% removal from 500 ppb and 50 ppm concentrations in 15 second and 30 min, respectively. The maximum adsorption capacity of 651 mg g−1 is achieved from a starting concentration as high as 1000 ppm Hg(II) ions. In a mixture containing Hg(II), Cd(II), Co(II), Cu(II), Zn(II), and Ni(II) ions with a high concentration of 200 mg L−1, the MT-PRGO adsorbent shows higher selectivity toward Hg(II) and Cd(II) with removal efficiencies of 70.5% and 40%, respectively. The results clearly demonstrate that the MT-PRGO is among the top of the carbon-based materials known for the high capacity of Hg(II) removal from aqueous solutions.The second adsorbent, melamine zirconium phosphate (M-ZrP), is designed to combine the amine and triazine nitrogen's functional groups of melamine with the hydroxyl active sites of zirconium phosphate to effectively capture Pb(II) ions from water. The M-ZrP adsorbent shows exceptionally high adsorption affinity for Pb(II) with a capacity of 681 mg g−1 and 1000 mg g−1 using an adsorbent dose of 1 g L−1 and 2 g L−1, respectively. The high adsorption capacity is also coupled with fast kinetics where the equilibrium time required for the 100% removal of Pb(II) from 1000 ppb, 100 ppm and 1000 ppm concentrations is 40 second, 5 min and 30 min, respectively using an adsorbent dose of 1 g L−1. In a mixture of six heavy metal ions at a concentration of 10 ppm, the removal efficiency is 100% for Pb(II), 99% for Hg(II), Cd(II) and Zn(II), 94% for Cu(II), and 90% for Ni(II) while at a higher concentration of 250 ppm the removal efficiency for Pb(II) is 95% compared to 23% for Hg(II) and less than 10% for the other ions. The remarkable efficiency and selectivity of the Pb(II) removal are attributed to the high chelating ability created by the presence of melamine, which has three basic nitrogen atoms in the triazine ring and two free basic amine groups, in close proximity to the hydroxyl groups on the surface of zirconium phosphate.
Because of the fast adsorption kinetics, high removal capacity and excellent regeneration, stability and reusability, the developed new materials MT-PRGO and M-ZrP are proposed as top performing remediation adsorbents for the solid phase extraction of Hg(II) and Pb(II), respectively from contaminated water.
Conflicts of interest
There are no conflicts to declare.Acknowledgements
We thank the National Science Foundation (CHE-1900094) for the support of this work.References
- R. P. Schwarzenbach, B. I. Escher, K. Fenner, T. B. Hofstetter, C. A. Johnson, U. von Gunten and B. Wehrli, The Challenge of Micropollutants in Aquatic Systems, Science, 2006, 313, 1072 CrossRef CAS
.
- C. J. Vorosmarty, et al., Global Threats to Human Water Security and River Biodiversity, Nature, 2010, 467, 555–561 CrossRef CAS
- J. C. Crittenden, R. R. Trussell, D. W. Hand, K. J. Howe and G. Tchobanoglous, Principles of Water Treatment, John Wiley & Sons, 2012, p. 706 Search PubMed
- S. Bolisetty, M. Peydayesh and R. Mezzenga, Sustainable Technologies for Water Purification from Heavy Metals: Review and Analysis, Chem. Soc. Rev., 2019, 48, 463–487 RSC
- I. Ali, Water Treatment by Adsorption Columns: Evaluation at Ground Level, Separ. Purif. Rev., 2014, 43, 175–205 CrossRef CAS
- S. Babel and T. A. Kurniawan, Low-cost Adsorbents for Heavy Metals Uptake from Contaminated Water: A Review, J. Hazard. Mater., 2003, 97, 219–243 CrossRef CAS
- I. Ali, New Generation Adsorbents for Water Treatment, Chem. Rev., 2012, 112, 5073–5091 CrossRef CAS
- A. Cincotti, A. Mameli, A. M. Locci, R. Orrù and G. Cao, Heavy Metals Uptake by Sardinian Natural Zeolites: Experiment and Modeling, Ind. Eng. Chem. Res., 2006, 45, 1074–1084 CrossRef CAS
- P. Z. Ray and H. J. Shipley, Inorganic Nano-Adsorbents for the Removal of Heavy Metals and Arsenic: A Review, RSC Adv., 2015, 5, 29885–29907 RSC
- S. Das, A. Samanta, G. Gangopadhyay and S. Jana, Clay-Based Nanocomposites as Recyclable Adsorbent toward Hg(II) Capture: Experimental and Theoretical Understanding, ACS Omega, 2018, 3, 6283–6292 CrossRef CAS
- L. Xu and J. Wang, The application of Graphene-based Materials for the Removal of Heavy Metals and Radionuclides from Water and Wastewater, Crit. Rev. Environ. Sci. Technol., 2017, 47, 1042–1105 CrossRef CAS
- N. Yin, K. Wang, Y. A. Xia and Z. Li, Novel Melamine Modified Metal-Organic Frameworks for Remarkably High Removal of Heavy Metal Pb(II), Desalination, 2018, 430, 120–127 CrossRef CAS
- M. X. Tan, Y. N. Sum, J. Y. Ying and Y. Zhang, A Mesoporous Poly-Melamine-Formaldehyde Polymer as a Solid Sorbent for Toxic Metal Removal, Energy Environ. Sci., 2013, 6, 3254–3259 RSC
- X. Wang, R. Li, J. Liu, R. Chen, H. Zhang, Q. Liu, Z. Li and J. Wang, Melamine Modified Graphene Hydrogels for the Removal of Uranium(VI) from Aqueous Solution, New J. Chem., 2017, 41, 10899–10907 RSC
- K. Li, G. Wu, M. Wang, X. Zhou and Z. Wang, Efficient Removal of Lead Ions from Water by a Low-Cost Alginate-Melamine Hybrid Sorbent, Appl. Sci., 2018, 8, 1518 CrossRef
- F. He, W. Wang, J.-W. Moon, J. Howe, E. M. Pierce and L. Liang, Rapid Removal of Hg(II) from Aqueous Solutions using Thiol-functionalized Zn-doped Biomagnetite Particles, ACS Appl. Mater. Interfaces, 2012, 4, 4373–4379 CrossRef CAS
- H. Xiao and S. Liu, Zirconium Phosphate (ZrP)-based Functional Materials: Synthesis, Properties and Applications, Mater. Des., 2018, 155, 19–35 CrossRef CAS
- H. Nakayama, A. Hayashi, T. Eguchi, N. Nakamura and M. Tsuhako, Unusual Adsorption Mechanism for Carboxylic Acid Gases by Polyamine-intercalated α-Zirconium Phosphate, J. Mater. Chem., 2002, 12, 3093–3099 RSC
- B. C. Pan, Q. R. Zhang, W. M. Zhang, B. J. Pan, W. Du, L. Lv, Q. J. Zhang, Z. W. Xu and Q. X. Zhang, Highly Effective Removal of Heavy Metals by Polymer-based Zirconium Phosphate: A Case Study of Lead Ion, J. Colloid Interface Sci., 2007, 310, 99–105 CrossRef CAS
- B. Pan, Q. Zhang, W. Du, W. Zhang, B. Pan, Q. Zhang, Z. Xu and Q. Zhang, Selective Heavy Metals Removal from Waters by Amorphous Zirconium Phosphate: Behavior and Mechanism, Water Res., 2007, 41, 3103–3111 CrossRef CAS
- S. Pourbeyram, Effective Removal of Heavy Metals from Aqueous Solutions by Graphene Oxide–Zirconium Phosphate (GO–Zr-P) Nanocomposite, Ind. Eng. Chem. Res., 2016, 55, 5608–5617 CrossRef CAS
- D. C. Marcano, D. V. Kosynkin, J. M. Berlin, A. Sinitskii, Z. Sun, A. Slesarev, L. B. Alemany, W. Lu and J. M. Tour, Improved Synthesis of Graphene Oxide, ACS Nano, 2010, 4, 4806–4814 CrossRef CAS
- F. S. Awad, K. M. AbouZeid, W. M. A. El-Maaty, A. M. El-Wakil and M. S. El-Shall, Effective Removal of Mercury(II) from Aqueous Solutions by Chemically Modified Graphene Oxide Nanosheets, U. A. R. J. Chem., 2020, 13, 2659–2670 CAS
- M. Monier, N. H. Elsayed and D. A. Abdel-Latif, Synthesis and Application of Ion-Imprinted Resin based on Modified Melamine–Thiourea for Selective Removal of Hg(II), Polym. Int., 2015, 64, 1465–1474 CrossRef CAS
- H. Yang, L. Song, Q. Tai, X. Wang, B. Yu, Y. Yuan, Y. Hu and R. K. K. Yuen, Comparative Study on the Flame Retarded Efficiency of Melamine Phosphate, Melamine Phosphite and Melamine Hypophosphite on Poly(butylene succinate) Composites, Polym. Degrad. Stab., 2014, 105, 248–256 CrossRef CAS
- F. S. Awad, K. M. AbouZeid, W. M. A. El-Maaty, A. M. El-Wakil and M. S. El-Shall, Efficient Removal of Heavy Metals from Polluted Water with High Selectivity for Mercury(II) by 2-Imino-4-thiobiuret–Partially Reduced Graphene Oxide (IT-PRGO), ACS Appl. Mater. Interfaces, 2017, 9, 34230–34242 CrossRef CAS
- K. Turcheniuk, C.-H. Hage, J. Spadavecchia, A. Y. Serrano, I. Larroulet, A. Pesquera, A. Zurutuza, M. G. Pisfil, L. Héliot, J. Boukaert, R. Boukherroub and S. Szunerits, Plasmonic Photothermal Destruction of Uropathogenic E. coli with Reduced Graphene Oxide and Core/Shell Nanocomposites of Gold Nanorods/Reduced Graphene Oxide, J. Mater. Chem. B, 2015, 3, 375–386 RSC
- R. Zhang, M. Li, Y. Huan, J. Xi, S. Zhang, X. Cheng, H. Wu, W. Peng, Z. Bai and X. Yan, A Potassium Thiocyanate Additive for Hysteresis Elimination in Highly Efficient Perovskite Solar Cells, Inorg. Chem. Front., 2019, 6, 434–442 RSC
- H. Zhu and S. A. Xu, Preparation and Fire Behavior of Rigid Polyurethane Foams Synthesized from Modified Urea–Melamine–Formaldehyde Resins, RSC Adv., 2018, 8, 17879–17887 RSC
- H. M. A. Hassan, V. Abdelsayed, A. E. R. S. Khder, K. M. AbouZeid, J. Terner, M. S. El-Shall, S. I. Al-Resayes and A. A. El-Azhary, Microwave Synthesis of Graphene Sheets Supporting Metal Nanocrystals in Aqueous and Organic Media, J. Mater. Chem., 2009, 19, 3832–3837 RSC
- H. Mou, J. Wang, D. Zhang, D. Yu, W. Chen, D. Wang and T. Mu, A One-step Deep Eutectic Solvent Assisted Synthesis of Carbon Nitride/Metal Oxide Composites for Photocatalytic Nitrogen Fixation, J. Mater. Chem. A, 2019, 7, 5719–5725 RSC
- D. Chen, H. Feng and J. Li, Graphene Oxide: Preparation, Functionalization, and Electrochemical Applications, Chem. Rev., 2012, 112, 6027–6053 CrossRef CAS
- V. Abdelsayed, S. Moussa, H. M. Hassan, H. S. Aluri, M. M. Collinson and M. S. El-Shall, Photothermal Deoxygenation of Graphite Oxide with Laser Excitation in Solution and Graphene-Aided Increase in Water Temperature, J. Phys. Chem. Lett., 2010, 1, 2804–2809 CrossRef CAS
- H. E. Van Wart and H. A. Scheraga, Raman Spectra of Cystine-related Disulfides. Effect of Rotational Isomerism about Carbon-Sulfur Bonds on Sulfur-Sulfur Stretching Frequencies, J. Phys. Chem., 1976, 80, 1812–1823 CrossRef CAS
- G. Li, Z. Zhao, J. Liu and G. Jiang, Effective Heavy Metal Removal from Aqueous Systems by Thiol Functionalized Magnetic Mesoporous Silica, J. Hazard. Mater., 2011, 192, 277–283 CAS
- L. Huang and Q. Shuai, Facile Approach To Prepare Sulfur-Functionalized Magnetic Amide-Linked Organic Polymers for Enhanced Hg(II) Removal from Water, ACS Sustainable Chem. Eng., 2019, 7, 9957–9965 CrossRef CAS
- D. Shetty, S. Boutros, A. Eskhan, A. M. De Lena, T. Skorjanc, Z. Asfari, H. Traboulsi, J. Mazher, J. Raya, F. Banat and A. Trabolsi, Thioether-Crown-Rich Calix[4]arene Porous Polymer for Highly Efficient Removal of Mercury from Water, ACS Appl. Mater. Interfaces, 2019, 11, 12898–12903 CrossRef CAS
- S. Mondal, S. Chatterjee, S. Mondal and A. Bhaumik, Thioether-Functionalized Covalent Triazine Nanospheres: A Robust Adsorbent for Mercury Removal, ACS Sustainable Chem. Eng., 2019, 7, 7353–7361 CrossRef CAS
- R. Liang and H. Zou, Removal of Aqueous Hg(II) by Thiol-Functionalized Nonporous Silica Microspheres Prepared by One-Step Sol–Gel Method, RSC Adv., 2020, 10, 18534–18542 RSC
- M. Afshari, M. Dinari, K. Zargoosh and H. Moradi, Novel Triazine-Based Covalent Organic Framework as a Superadsorbent for the Removal of Mercury(II) from Aqueous Solutions, Ind. Eng. Chem. Res., 2020, 59, 9116–9126 CrossRef
- R. Fang, C. Lu, Y. Zhong, Z. Xiao, C. Liang, H. Huang, Y. Gan, J. Zhang, G. Pan, X. Xia, Y. Xia and W. Zhang, Puffed Rice Carbon with Coupled Sulfur and Metal Iron for High-Efficiency Mercury Removal in Aqueous Solution, Environ. Sci. Technol., 2020, 54, 2539–2547 CrossRef CAS
- Z. Jiang and G. Liu, Microencapsulation of Ammonium Polyphosphate with Melamine-Formaldehyde-tris(2-hydroxyethyl)isocyanurate Resin and its Flame Retardancy in Polypropylene, RSC Adv., 2015, 5, 88445–88455 RSC
- W.-H. Rao, Z.-Y. Hu, H.-X. Xu, Y.-J. Xu, M. Qi, W. Liao, S. Xu and Y.-Z. Wang, Flame-Retardant Flexible Polyurethane Foams with Highly Efficient Melamine Salt, Ind. Eng. Chem. Res., 2017, 56, 7112–7119 CrossRef CAS
- X. Jin, J. Sun, J. S. Zhang, X. Gu, S. Bourbigot, H. Li, W. Tang and S. Zhang, Preparation of a Novel Intumescent Flame Retardant Based on Supramolecular Interactions and Its Application in Polyamide 11, ACS Appl. Mater. Interfaces, 2017, 9, 24964–24975 CrossRef CAS
- S. Wang, M. Ma, W. Man, Q. Zhang, N. Xiaolong, G. Sun, W. Zhang and T. Jiao, One-step Facile Fabrication of the Sea Urchin-like Zirconium Oxide for Efficient Phosphate Sequestration, RSC Adv., 2015, 5, 91218 RSC
- S. Dyjak, W. Kicinski and A. Huczko, Thermite-driven Melamine Condensation to CxNyHz Graphitic Ternary Polymers: Towards an Instant, Large-scale Synthesis of g-C3N4, J. Mater. Chem. A, 2015, 3, 9621–9631 RSC
- X. Yuan, K. Luo, K. Zhang, J. He, Y. Zhao and D. Yu, Combinatorial Vibration-Mode Assignment for FTIR Spectrum of Crystalline Melamine: a Strategic Approach towards Theoretical IR Vibrational Calculations of Triazine-Based Compounds, J. Phys. Chem. A, 2016, 120, 7427–7433 CrossRef CAS
- C. Yu, Z. Shao and H. Hou, A Functionalized Metal–Organic Framework Decorated with O− Groups Showing Excellent Performance for Lead(II) Removal from Aqueous Solution, Chem. Sci., 2017, 8, 7611–7619 RSC
- S. He, F. Zhang, S. Cheng and W. Wang, Synthesis of Sodium Acrylate and Acrylamide Copolymer/GO Hydrogels and Their Effective Adsorption for Pb2+ and Cd2+, ACS Sustainable
Chem. Eng., 2016, 4, 3948–3959 CrossRef CAS
- A. Jawad, Z. Liao, Z. Zhou, A. Khan, T. Wang, J. Ifthikar, A. Shahzad, Z. Chen and Z. Chen, Fe-MoS4: An Effective and Stable LDH-Based Adsorbent for Selective Removal of Heavy Metals, ACS Appl. Mater. Interfaces, 2017, 9, 28451–28463 CrossRef CAS
- Q. Zhang, B. Pan, S. Zhang, J. Wang, W. Zhang and L. Lv, New Insights into Nanocomposite Adsorbents for Water Treatment: A Case Study of Polystyrene-Supported Zirconium Phosphate Nanoparticles for Lead Removal, J. Nano. Res., 2011, 13, 5355 CrossRef CAS
- X. Ma, Y. Li, X. Li, L. Yang and X. Wang, Preparation of Novel Polysulfone Capsules Containing Zirconium Phosphate and their Properties for Pb2+ Removal from Aqueous Solution, J. Hazard. Mater., 2011, 188, 296–303 CrossRef CAS
- D. Zhao, Y. Yu and J. P. Chen, Treatment of Lead Contaminated Water by a PVDF Membrane that is Modified by Zirconium, Phosphate and PVA, Water Res., 2016, 101, 564–573 CrossRef CAS
- D. T. Sun, L. Peng, W. S. Reeder, S. M. Moosavi, D. Tiana, D. K. Britt, E. Oveisi and W. L. Queen, Rapid, Selective Heavy Metal Removal from Water by a Metal–Organic Framework/Polydopamine Composite, ACS Cent. Sci., 2018, 4, 349–356 CrossRef CAS
- K. Wang, J. Gu and N. Yin, Efficient Removal of Pb(II) and Cd(II) Using NH2-Functionalized Zr-MOFs via Rapid Microwave-Promoted Synthesis, Ind. Eng. Chem. Res., 2017, 56, 1880–1887 CrossRef CAS
- C. W. Abney, J. C. Gilhula, K. Lu and W. Lin, Metal-Organic Framework Templated Inorganic Sorbents for Rapid and Efficient Extraction of Heavy Metals, Adv. Mater., 2014, 26, 7993–7997 CrossRef CAS
- H. Saleem, U. Rafique and R. P. Davies, Investigations on Post-Synthetically Modified UiO-66-NH2 for the Adsorptive Removal of Heavy Metal Ions from Aqueous Solution, Microporous Mesoporous Mater., 2016, 221, 238–244 CrossRef CAS
- J. Wu, J. Zhou, S. Zhang, A. Alsaedi, T. Hayat, J. Li and Y. Song, Efficient Removal of Metal Contaminants by EDTA Modified MOF from Aqueous Solutions, J. Colloid Interface Sci., 2019, 555, 403–412 CrossRef CAS
- C. Xiong, S. Wang, P. Hu, L. Huang, C. Xue, Z. Yang, X. Zhou, Y. Wang and H. Ji, Efficient Selective Removal of Pb(II) by Using 6-Aminothiouracil Modified Zr-Based Organic Frameworks: From Experiments to Mechanisms, ACS Appl. Mater. Interfaces, 2020, 12, 7162–7178 CrossRef CAS
- P. Sharma, A. K. Singh and V. K. Shahi, Selective Adsorption of Pb(II) from Aqueous Medium by Cross-Linked Chitosan-Functionalized Graphene Oxide Adsorbent, ACS Sustainable Chem. Eng., 2019, 7, 1427–1436 CrossRef CAS
- T. Feng, J. Xu, C. Yu, K. Cheng, Y. Wu, Y. Wang and F. Li, Graphene Oxide Wrapped Melamine Sponge as an Efficient and Recoverable Adsorbent for Pb(II) Removal from Fly Ash Leachate, J. Hazard. Mater., 2019, 367, 26 CrossRef CAS
- J. Liu, X. Ge, X. Ye, G. Wang, H. Zhang, H. Zhou, Y. Zhang and H. Zhao, 3D graphene/δ-MnO2 Aerogels for Highly Efficient and Reversible Removal of Heavy Metal Ions, J. Mater. Chem. A, 2016, 4, 1970–1979 RSC
- F. Xu, T.-T. Zhu, Q.-Q. Rao, S.-W. Shui, W.-W. Li, H.-B. He and R.-S. Yao, Fabrication of Mesoporous Lignin-based Biosorbent from Rice Straw and its Application for Heavy-Metal-Ion Removal, J. Env.Sci., 2017, 53, 132–140 CrossRef
- P. Wang, T. Shen, X. Li, Y. Tang and Y. Li, Magnetic Mesoporous Calcium Carbonate-Based Nanocomposites for the Removal of Toxic Pb(II) and Cd(II) Ions from Water, ACS Appl. Nano Mater., 2020, 3, 1272–1281 CrossRef CAS
Footnote |
| † Electronic supplementary information (ESI) available: XRD patterns of graphite, GO and MT-PRGO (Fig. S1), 1H NMR of melamine and MT (Fig. S2), UV-Vis and Raman spectra of GO and MT-PRGO (Fig. S3), C 1s XPS spectra of GO and MT-PRGO (Fig. S4), O 1s, N 1s and S 2p XPS spectra of MT-PRGO (Fig. S5), effect of pH on the removal of Hg(II), Co(II) and Cu(II) ions by MT-PRGO (Fig. S6), Langmuir isotherms and kinetics of adsorption of Hg(II), Co(II) and Cu(II) ions on MT-PRGO (Fig. S7), effect of competitive ions on the removal of Hg(II) by MT-PRGO (Fig. S8), recycling of MT-PRGO for Hg(II) adsorption (Fig. S9), C 1s, N 1s, O 1s, and P 2p XPS spectra of MP (Fig. S10), O 1s, P 2p and Zr 3d XPS spectra of ZrP (Fig. S11), BET surface area and pore size distribution of MP, ZrP and M-ZrP (Fig. S12), effect of pH on the removal of Pb(II), Hg(II) and Cd(II) ions by M-ZrP (Fig. S13), Langmuir adsorption isotherms of Pb(II) on ZrP and M-ZrP (Fig. S14), effect of contact time on the removal of Hg(II) and Cd(II) ions by M-ZrP (Fig. S15), recycling of M-ZrP adsorbent for the removal of Pb(II) ions (Fig. S16), and XPS spectra of M-ZrP after the adsorption of Pb(II) ions (Fig. S17). Langmuir isotherm parameters for the adsorption of Hg(II), Co(II) and Cu(II) ions on MT-PRGO (Table S1), kinetic parameters for the adsorption of Hg(II), Co(II) and Cu(II) ions on MT-PRGO (Table S2), adsorption capacities of MT-PRGO in mixed metal ions system (Table S3), desorption of Hg(II) ions from MT-PRGO using HNO3 (Table S4), XPS surface composition of MP and M-ZrP (Table S5), surface area and estimated pore size distribution of MP, ZrP and M-ZrP (Table S6), and desorption of Pb(II), Hg(II) and Cd(II) ions from M-ZrP using HNO3 (Table S7). See DOI: 10.1039/d0ra07546a |
| This journal is © The Royal Society of Chemistry 2020 |