 Open Access Article
Insights into the impurities of Bi2WO6 synthesized using the hydrothermal method
Jiayou Liu ab,
Qianqian Nieabc,
Zhongchao Tanc,
Yulin Luod,
Shuai Wangd and
Hesheng Yu*ab
aKey Laboratory of Coal Processing and Efficient Utilization, Ministry of Education, Xuzhou 221116, China. E-mail: heshengyu@cumt.edu.cn
bSchool of Chemical Engineering and Technology, China University of Mining and Technology, Xuzhou 221116, China
cDepartment of Mechanical & Mechatronics Engineering, University of Waterloo, 200 University Avenue West, Waterloo N2L 3G1, Canada
dAdvanced Analysis and Computation Center, China University of Mining and Technology, Xuzhou 221116, China
First published on 9th November 2020
Abstract
Bismuth tungstate (Bi2WO6) nanomaterials are widely used as visible-light driven photocatalysts. However, limited attention has been paid to the purity of prepared Bi2WO6 nanoparticles, which may affect the photocatalytic performance and hinder in-depth study of Bi2WO6. In this work, the impurities of Bi2WO6 formed during the hydrothermal process under a wide range of acid–base conditions (from 1.5 M HNO3 to 0.5 M NaOH) were qualitatively analyzed and accurately quantified for the first time. After confirmation of Bi2WO6 stability, the impurities were dissolved using acid or base treatment, followed by measurements of the ion concentrations using Inductively Coupled Plasma Mass Spectrometry (ICP-MS). Furthermore, various characterization techniques including XRD, FE-SEM, TEM, UV-Vis DRS, XPS and FTIR were implemented to explore the change in morphology and optical properties of Bi2WO6 prepared in different acid–base environments, and to facilitate qualitative analysis of impurities. The hydrolytic properties of raw materials used for the synthesis of Bi2WO6 were also analyzed with UV-Vis transmittance observation. Following these analyses, the types and contents of impurities in Bi2WO6 prepared by the hydrothermal method under different acid–base conditions were determined. Results show that the primary impurity is WO3·0.33H2O (41.09%) for the precursor prepared in 1.5 M nitric acid solution. When the pH of the precursor was in the range of 0.97–7.01, the synthesized Bi2WO6 has relatively high purity, and the impure products were identified as BiONO3. Bi2O3 began to appear when pH reached 9.01 and it reached 18.88% when pH was 12.98. The final product was Bi2O3 exclusively for the precursor conditioned in 0.5 M NaOH solution. In addition, the accuracy of the proposed quantitative method using ICP-MS was validated for several scenarios by weight difference experiments.
1. Introduction
Many researchers consider photocatalysis to be a promising technology for sustainable energy production and environmental remediation. Photocatalysts such as TiO2,1 ZnO2 and SnO2![[thin space (1/6-em)]](https://www.rsc.org/images/entities/char_2009.gif) 3 have been extensively studied; however, such catalysts only respond to the ultraviolet light because of their wide band gaps. Meanwhile, ultraviolet light accounts for approximately 4%4 of the solar energy on the surface of the planet earth and 44% of sunlight is visible. As a result, visible-light responsive photocatalysts with a narrow band gap have attracted growing interest in research.
3 have been extensively studied; however, such catalysts only respond to the ultraviolet light because of their wide band gaps. Meanwhile, ultraviolet light accounts for approximately 4%4 of the solar energy on the surface of the planet earth and 44% of sunlight is visible. As a result, visible-light responsive photocatalysts with a narrow band gap have attracted growing interest in research.
Bismuth tungstate (Bi2WO6) has recently gained considerable attention because of its physicochemical stability and efficient response to visible light.5 Bi2WO6 and its modified catalysts have been used for degradation of organic wastewater, conversion of carbon dioxide (CO2), water splitting for hydrogen production, and removal of nitric oxide (NO) from atmosphere.6–11 Since Kudo12 first synthesize Bi2WO6 by conventional solid state reactions, many methods have emerged for its preparation including hydrothermal method,13,14 microwave-15 and ultrasonic-assisted16 hydrothermal method, solvothermal procedure,17 sol–gel process,18 grinding and calcination,19 and co-precipitation.20 Among these methods, the hydrothermal method is one of the most widely used because of its simplicity, safety, and high yield.21,22
During the hydrothermal synthesis process, the final products may be affected by factors, such as hydrothermal reaction temperature and pH value of precursors. Zhang and Zhu23 explored the impact of hydrothermal reaction temperature on the properties of Bi2WO6 nanocatalysts. They observed that the crystallinity and morphology of final products were affected by the temperature and time during hydrothermal process. Specifically, low temperature will lead to poor crystallinity, while high temperature will result in low photocatalytic activity. Additionally, it is well acknowledged that pH value also affects several physical properties of Bi2WO6 in a hydrothermal preparation. Huang et al.24 produced Bi2WO6 nanomaterials with different morphologies by adjusting the pH level of the precursor solution. At pH 8, the fluffy microspheres-like Bi2WO6 exhibited the highest photocatalytic activity. Hu et al.25 reported that the pH value of precursor solution affected the specific surface area and the porosity of their Bi2WO6 nanocatalysts. Lin et al.14 reported that pH value impacted on the particle sizes of the synthesized Bi2WO6 photocatalysts. Moreover, the pH value of precursor could affect the composition of final products. Some researchers prepared WO3/Bi2WO6 composite in a strong acid environment.26,27 Others discovered Bi3.84W0.16O6.24 in Bi2WO6 nanomaterials prepared under alkali conditions.28 Therefore, it is likely that the acidity and/or alkalinity of preparation conditions may have a strong impact on the final products. However, most researchers focused on properties like morphology and specific surface area; few attempted to determine the purity of Bi2WO6 nanomaterials prepared at different synthesis conditions.
It is therefore necessary to qualitatively and quantitatively analyze impurities to better understand the effects of synthesis conditions on the purity of Bi2WO6. The impure components in Bi2WO6 can be qualitatively analyzed by some characterization technologies such as XRD, SEM and FTIR.29,30 Earlier studies have indicated that the impurities in Bi2WO6 prepared via hydrothermal method mainly resulted from the hydrolysis of raw materials.26,31,32 Therefore, accurate and comprehensive understanding of the hydrolysis properties of Bi(NO3)3·5H2O and Na2WO4·2H2O at different pH levels is also essential to qualitative analysis of impurities.
To the best of our knowledge, however, there is not relevant research on the quantification of impurities in Bi2WO6 nanomaterials. One feasible strategy is to take advantage of the difference in physio-chemical properties between impurities and Bi2WO6. As far as we know, the hydrolysate of the raw material for Bi2WO6 preparation can be dissolved in an acid or hot alkali solution,33,34 while Bi2WO6 is relatively stable.35,36 Hence it is reasonable to carry out quantitative analysis by dissolving impurities from the Bi2WO6 samples.
The objective of the current work is to study the impurities of prepared Bi2WO6 nanocatalysts. For this purpose, we first synthesized Bi2WO6 using hydrothermal method from 1.5 M nitric acid (HNO3) to 0.5 M sodium hydroxide (NaOH) solutions. Then we identified the compounds of the impurities and other properties of the samples according to XRD, UV-Vis DRS, XPS FTIR, FE-SEM, TEM results and hydrolysis properties of raw materials for preparation of Bi2WO6. After that, the stability of Bi2WO6 was determined experimentally to ensure the feasibility of quantitative experiments. Later, impurities in the catalysts were dissolved into strong acid or hot alkaline solutions. Following that, the concentrations of key elements in the solutions were measured using ICP-MS, followed by conversion into mass weight of corresponding impurities. Finally, the accuracy of the quantitative method based on the ICP-MS technique was then verified by weight difference experiments. Overall, the present work is expected to shed light onto Bi2WO6-related studies and investigations using Bi(NO3)3·5H2O and/or Na2WO4·2H2O as raw materials.
2. Experimental
2.1 Materials
Reagents used in this research include Bi(NO3)3·5H2O (≥99.0%), Na2WO4·2H2O (≥99.5%), ethanol (≥99.7%), NaOH (≥96.0%) and concentrated HNO3 (65–68.0%). They are all of analytical grade and were purchased from Sinopharm Chemical Reagent Co. These chemicals were used as received without further purification. Ultrapure water with a resistivity of 18.2 MΩ cm−1 produced by Direct-Q 5 UV System (Merck Millipore Germany) was used in this study.2.2 Synthesis of Bi2WO6 in different acid and alkali conditions
The Bi2WO6 nanomaterials were prepared using hydrothermal method. The molar ratio between bismuth and tungstate was maintained at 2![[thin space (1/6-em)]](https://www.rsc.org/images/entities/char_2009.gif) :
:![[thin space (1/6-em)]](https://www.rsc.org/images/entities/char_2009.gif) 1. The preparation procedures of precursor suspension under strong acid or mild alkali condition differs slightly from those under dilute acid and base conditions. To prepare Bi2WO6 under strong acid condition, 1.0914 g of bismuth nitrate pentahydrate (Bi(NO3)3·5H2O) and 0.3711 g of sodium tungstate dihydrate (Na2WO4·2H2O) were first weighed using an analytical balance (METTLER TOLEDO-ME104E/02). They were then transferred to two beakers containing 30 mL of nitric acid solution, the concentration of which ranged from 0.5 M to 1.5 M. These two solutions were magnetically stirred for 30 minutes separately, before they were mixed up for another 20 minutes. Nanomaterials synthesized under such strong acid conditions are denoted as 0.5MHNO, 1.00MHNO, 1.25MHNO, and 1.5MHNO; the numerical numbers stand for HNO3 concentrate. As for mild base condition, the same amount of Bi(NO3)3·5H2O and Na2WO4·2H2O were dissolved in 30 mL of 0.5 M NaOH solution, respectively. The subsequent procedures are the same as those under strong acid conditions and the corresponding nanomaterials are denoted as 0.5MNAOH.
1. The preparation procedures of precursor suspension under strong acid or mild alkali condition differs slightly from those under dilute acid and base conditions. To prepare Bi2WO6 under strong acid condition, 1.0914 g of bismuth nitrate pentahydrate (Bi(NO3)3·5H2O) and 0.3711 g of sodium tungstate dihydrate (Na2WO4·2H2O) were first weighed using an analytical balance (METTLER TOLEDO-ME104E/02). They were then transferred to two beakers containing 30 mL of nitric acid solution, the concentration of which ranged from 0.5 M to 1.5 M. These two solutions were magnetically stirred for 30 minutes separately, before they were mixed up for another 20 minutes. Nanomaterials synthesized under such strong acid conditions are denoted as 0.5MHNO, 1.00MHNO, 1.25MHNO, and 1.5MHNO; the numerical numbers stand for HNO3 concentrate. As for mild base condition, the same amount of Bi(NO3)3·5H2O and Na2WO4·2H2O were dissolved in 30 mL of 0.5 M NaOH solution, respectively. The subsequent procedures are the same as those under strong acid conditions and the corresponding nanomaterials are denoted as 0.5MNAOH.
For dilute acid and base conditions ranging from pH 0.97 to pH 12.98, 1.4552 g of Bi(NO3)3·5H2O and 0.4948 g of Na2WO4·2H2O were dissolved in 25 mL of 0.3 M HNO3 solution and in 55 mL of ultrapure water, respectively. These two solutions were then magnetically stirred for 30 minutes separately, before they were mixed up for another 20 minutes. The pH of the precursor, which was monitored by a pH meter (S470-K, METTLER TOLEDO), was then adjusted to 0.97, 2.99, 4.99, 7.01, 9.01, 10.00, 11.05, 12.01 and 12.98 with NaOH and/or HNO3. The corresponding nanomaterials synthesized under these conditions are defined as 0.97BWO, 2.99BWO, 4.99BWO, 7.01BWO, 9.01BWO, 10.00BWO, 11.05BWO, 12.01BWO, and 12.98BWO, respectively.
The precursor suspension was then transferred to a 100 mL PTFE autoclave, and heated at 180 °C for 24 h. After naturally cooling down to room temperature, the solid was collected by centrifuge, followed by washing 3 times with ultrapure water and ethanol, respectively. The nanomaterials collected were then dried at 60 °C for 12 h; the resultant nanomaterials were stored for subsequent use.
2.3 Sample characterization
Crystal phase of the prepared photocatalysts was analyzed by the X-ray diffraction technique (XRD, Bruker AXS D8 Advance, Cu Kα, λ = 1.5406 Å, 40 kV, 40 mA) at 2θ angles from 5 to 80°,and a scan speed of 10° per min. Their optical properties were determined using UV-Vis diffused reflectance spectra (UV-Vis DRS, Hitachi U-3900H) over the wavelengths in the range of 275–800 nm. X-ray photoelectron spectroscopy (XPS) was performed on ESCALAB 250Xi using Al Kα radiation to determine the chemical valence and relative percentage of surface elements. The data of binding energy for all samples were calibrated with the C 1s signal at 284.8 eV. Field emission scanning electron microscope (FE-SEM, Hitachi-SU8220), which was operated at 10 kV acceleration voltage and 9800 nA emission current, was used to observe the morphology of the samples. Additionally, transmission electron microscopy (TEM) and high-resolution transmission electron microscopy (HR-TEM) observations were carried out on a Tecnai G2 F20 instrument in the bright field. Furthermore, chemical bonds of samples were determined using Fourier Transform Infrared Spectroscopy (FTIR, Bruker Vertex 80v) over the range of 400–4000 cm−1.2.4 Observation of critical point of hydrolysis
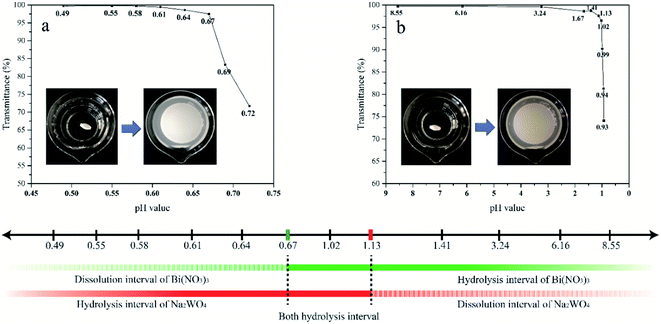
The raw materials [Bi(NO3)3·5H2O and Na2WO4·2H2O] used for the preparation of Bi2WO6 were subject to severe hydrolysis in solution, producing insoluble precipitates.9,27,31 The hydrolysis reactions contribute largely to the impurities in the Bi2WO6 produced during hydrothermal process. Therefore, understanding the hydrolysis properties of Bi3+ and WO42− ions at different pH levels is important to impurity analysis.The critical pH value of hydrolysis is defined as the pH value at which ions begin to hydrolyze. The critical pH values for Bi3+ and WO42− ions were determined using the transmittance pattern of the UV-Vis spectrophotometer (Hitachi U-3900H). The precipitate may affect the transmittance intensity of a solution. Therefore, transmittance observations can be used to identify the critical pH values. At the critical pH value, transmittance drops abruptly due to the presence of precipitates.
The procedure of UV-Vis transmittance observation was described as follows. Firstly, Bi(NO3)3 and Na2WO4 were completely dissolved in a strong acidic solution and ultrapure water, respectively. The obtained transparent Bi(NO3)3 and Na2WO4 solutions were then gradually regulated using NaOH and HNO3 solutions to reach a series of pH values with a small interval. The transmittance of these Bi(NO3)3 and Na2WO4 solutions was recorded at each pH value.
2.5 Catalysts stability
A new approach based on acid and base treatment is proposed herein to quantify the impurities in the Bi2WO6 nanomaterials produced by hydrothermal method. In this method, it is critical to ensure Bi2WO6 stability in the corresponding acid and base environments. For this purpose, 0.97BWO nanomaterials were treated with acid and alkaline solutions, respectively, following the same procedure as described in ICP-MS analysis, which can be found in the next section. Crystal structure stability and morphology stability were analyzed by examining the XRD patterns and FE-SEM images of 0.97BWO before and after treatment with acid or base solvents. In addition, chemical stability was observed based on the change in the mass of dissolved Bi and W elements during a period of 7 days.Nanomaterials prepared at strong acid (1.5MHNO) and base (12.98BWO) precursors were also analyzed to further confirm the stability of Bi2WO6. The XRD patterns and FE-SEM images of 1.5MHNO before and after alkali treatment was compared. The stability of 12.98BWO was confirmed by XRD results before and after soaking with acid.
2.6 Quantitative analysis of impurities
Upon confirmation of Bi2WO6 stability, Inductively Coupled Plasma Mass Spectrometry (ICP-MS, Agilent 7900) was used to determine the soluble bismuth and tungstate ions dissolved in solutions. Data is used for the quantification of impurities in the Bi2WO6 nanomaterials synthesized under different acid and alkali conditions. The samples for ICP-MS analysis were prepared following these steps: for those prepared at pH value equal to or above 0.97, and the 0.5MNAOH nanomaterials, samples were soaked in pH 0.5 HNO3 solution for one week to dissolve potential acid-soluble impurities. However, 1.5MHNO, 1.25MHNO, 1.00MHNO, 0.5MHNO and 0.97BWO samples were treated by boiling 0.5 M NaOH solution for 1 min to dissolve alkali-soluble impurities. The resultant suspension was separated by a centrifuge operating at 4500 rpm for 3 min; then the supernatant was then sampled and diluted for ICP-MS analysis.The ICP-MS results were further verified by weight difference tests. A specific amount of 1.5MHNO, 0.97BWO and 12.98BWO samples were treated using base or acid solution. The treated catalysts were then cleaned in a sintered disc filter. The 1.5MHNO nanomaterials after alkaline treatment were washed using ultrapure water during filtration. However, the 0.97BWO, 12.98BWO samples soaked in acid were washed 5 times using pH 0.5 HNO3 solution, followed by a thorough rinse with ultrapure water. This way, the hydrolysis of Bi3+ ions left on solids could be prevented, ensuring the accuracy of final analysis. After drying at 60 °C for 12 hours, the weight difference before and after acid or base treatment was recorded.
3. Results and discussion
3.1 XRD patterns of Bi2WO6 nanomaterials
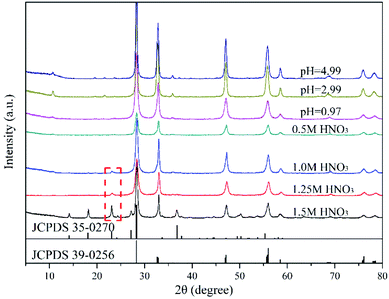
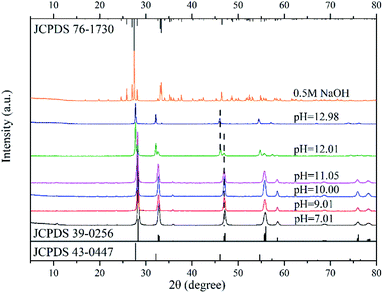
Fig. 1 and 2 show the XRD patterns of the catalysts prepared under different acid and base conditions. All samples, except for 12.98BWO and 0.5MNAOH, exhibited diffraction peaks that match up with Bi2WO6 standard card (JCPDS No.: 39-0256). The peaks appear to be sharp, indicating that the primary compound of the samples is highly crystalline Bi2WO6. Fig. 1 also shows that the phase of WO3·0.33H2O (JCPDS No.: 35-0270) is present in the nanomaterials synthesized in strong acid environments including 1.5 M, 1.25 M, and 1.0 M HNO3 solutions. The presence of WO3·0.33H2O is consistent with the results of SEM analysis in the following section. In such cases, the H+ ion concentrations in the precursor were so high that WO4− ions combined with H+ to produce insoluble precipitation of H2WO4. H2WO4 then dehydrated during the hydrothermal process to generate WO3·0.33H2O. However, it was difficult to observe the peaks of WO3·0.33H2O in the XRD spectrum of the 0.5MHNO samples. The samples of 0.5MHNO, 0.97BWO, 2.99BWO, and 4.99BWO showed only characteristic peaks of Bi2WO6, and the intensity of the strongest (131) peak at 28.299° changed significantly from about 1572 to about 10![[thin space (1/6-em)]](https://www.rsc.org/images/entities/char_2009.gif) 631 as the acidity decreased. This finding might be attributed to the increase in crystallite size and enhanced crystallinity perfection.28
631 as the acidity decreased. This finding might be attributed to the increase in crystallite size and enhanced crystallinity perfection.28
Fig. 2 shows the XRD patterns of catalysts synthesized in neutral and alkaline environments. For pH values ranging from 7.01 to 11.05, the XRD spectrums showed the phase of Bi2WO6 only. When the pH value increased to 12.01, however, a new crystal phase of Bi3.84W0.16O6.24 (JCPDS No.: 43-0447), besides Bi2WO6, appeared in the prepared nanomaterials. Moreover, the intensity of the diffraction peak of Bi3.84W0.16O6.24 was stronger than that of Bi2WO6. This may be attributed to the solubility of [WO4]2− in the precursor suspension, which is much greater than that of [Bi2O2]2+ in a strong alkaline environment. Therefore, [Bi2O2]2+ can precipitate rapidly, forming the new phase of Bi3.84W0.16O6.24.28,37 As the pH value reached 12.98, however, the phase of Bi2WO6 disappeared and only Bi3.84W0.16O6.24 existed. In this paper, Bi3.84W0.16O6.24 is regarded as another crystalline phase of Bi2WO6 rather than impurities because of its strong stability and catalytic ability. Synthesized Bi3.84W0.16O6.24 could be converted to α-Bi2O3 (JCPDS No.: 76-1730) when the precursor was further conditioned by 0.5 M NaOH solution. The formation of α-Bi2O3 resulted from the high concentration of OH− in the precursor, leading to the production of Bi(OH)3. Bi(OH)3 further transformed into α-Bi2O3 under hydrothermal reaction conditions.38 Consequently, Bi3+ ions were unable to participate in the synthesis of Bi3.84W0.16O6.24 and Bi2WO6 with WO42−.
According to the XRD patterns, WO3·0.33H2O, Bi3.84W0.16O6.24, and α-Bi2O3 were observed sequentially with increasing precursor alkalinity in addition to Bi2WO6. The results not only demonstrated the successful synthesis of Bi2WO6, but also strongly proved that different substances could be produced under different acid–base conditions.
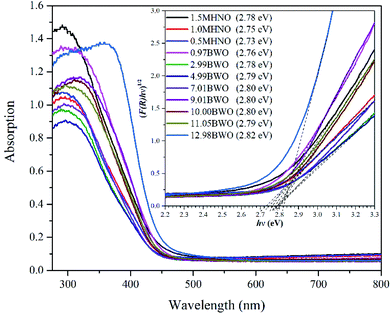
3.2 Optical properties of catalysts
The UV-Vis DRS was used to determine the photo-response range of nanomaterials synthesized under different acid and alkali conditions. It can be seen from Fig. 3 that all samples showed high photo-absorption at around 380 nm, and their absorption bands were approximately 450 nm. This indicates that all the synthesized samples are responsive to visible light regardless of the pH value of the precursor. In addition, the optical band gap of the as-prepared photocatalysts were calculated using Kubelka–Munk (KM) method,39 and the results are included in the legend of Fig. 3.Fig. 3 shows that the band gaps of different catalysts, including 0.97BWO, 2.99BWO, 4.99BWO, 7.01BWO, 9.01BWO, 10.00BWO and 11.05BWO, varied slightly between 2.76–2.80 eV. This range is consistent with those in other studies on Bi2WO6.40,41 The absorption edges of 1.5MHNO, 1MHNO and 0.5MHNO are 446 nm, 451 nm and 454 nm corresponding to band gaps of 2.78 eV, 2.75 eV and 2.73 eV, respectively. The band gap of 12.98BWO (which is Bi3.84W0.16O6.24) is 2.82 eV, corresponding to previous report as well.42 The results in this section indicate that all samples have visible light response capabilities and that the band gap lies between 2.73 eV and 2.82 eV.
3.3 Morphology and structure of prepared nanomaterials
Morphologies of the samples were characterized by FE-SEM and TEM techniques. It can be seen from Fig. 4a that the 1.5MHNO sample appears like a flower with dewdrops. Specifically, the flower-like base is made up with large nanosheets, which are decorated by small “nanocrumbs”. The large nanosheets are composed of Bi2WO6 and the nanocrumbs are WO3·0.33H2O. The presence of these two substances is further confirmed with the XRD pattern of 1.5MHNO. As the acidity decreases, regular large nanosheets disappear, and are replaced by irregular flocs consisting of small nanosheets for precursor prepared in 0.5 M HNO3 solution (Fig. 4b). Fig. 4c shows the morphology of Bi2WO6 prepared at pH 0.97. Numerous small nanosheets accumulate to form large wheat spike-like shapes (see the inset on the top right). Further accumulation of these spike-like structures resulted in 3D spheres, the diameters of which are about 4–7 μm.The morphologies of the synthesized catalysts are similar to each other when the pH values of the precursors fall into the range of 4.99–7.01 (Fig. 4d and e). Both appear to be building blocks, formed by interspersion between small rectangular pieces. The side lengths of these blocks are approximately 0.6–1.0 μm. The lower the acidity is, the thicker the blocks are.
Fig. 4f and g illustrate that the shapes of samples 9.01BWO and 11.05BWO are like square bricks. These square bricks of Bi2WO6 are randomly plied up without obvious aggregation. As the pH value reaches 12.01, a new crystal phase of Bi3.84W0.16O6.24 emerges. Two different morphologies can be clearly observed in Fig. 4h. The sheet shape is for the Bi2WO6 and the regular octahedron shape is for Bi3.84W0.16O6.24. It also shows that the Bi3.84W0.16O6.24 crystal is the dominate phase. This finding agrees with the XRD patterns of 12.01BWO samples presented in Fig. 2, which show two crystal phases.
Fig. 4i shows the morphology of 12.98BWO nanomaterials. It does not show the structure of the Bi2WO6 sheet, but regular octahedral crystals of Bi3.84W0.16O6.24 and some irregular small crystals. According to the FTIR results in the following section and those in earlier studies,31,38 these irregular crystals are likely Bi2O3. Finally, the synthesized crystals become irregular Bi2O3 spheres and rods with various sizes when the precursor is conditioned using 0.5 M NaOH solution (Fig. 4j). The transformation arises from the fact that a large amount of OH− ions in the precursor directly combines with Bi3+ ions to form Bi(OH)3, which is then converted into Bi2O3 after dehydration during hydrothermal process.43
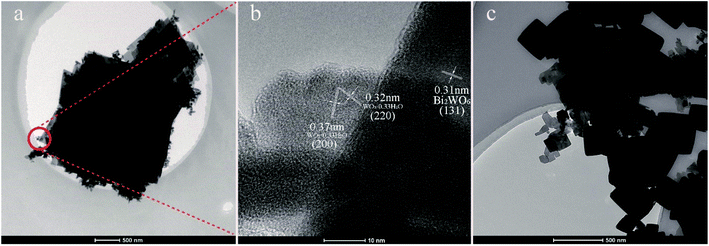
Fig. 5 presents the TEM images of 1.5MHNO and 12.01BWO samples. The overall TEM image of 1.5MHNO in Fig. 5a shows large nanosheets decorated by small “nanocrumbs”. The section inside the circle was further analyzed using HR-TEM (Fig. 5b), which reveals the lattice interplanar spacing (0.31 nm) of the large nanosheets corresponding to the (131) plane of Bi2WO6. The nanocrumbs sprinkled onto the large nanosheet have interplanar distances of 0.32 nm and 0.37 nm, corresponding to the crystal lattice spacing of the (220) and (200) planes of WO3·0.33H2O, respectively. These findings are consistent with the SEM image shown in Fig. 4a. Fig. 5c shows the TEM image of 12.01BWO. Both granular and flaky crystals can be clearly seen. These SEM and TEM images clearly show the change of morphology and transformation of dominate compounds with the variation from strong acid to mild base circumstances.
3.4 XPS analyses
Fig. 6 shows the percentage and chemical valence states of surface elements determined by XPS. The high-resolution XPS spectra of O 1s are shown in Fig. 6a. Through Gaussian distribution, the O 1s peaks of samples could be deconvoluted into three peaks at 529.19–529.87 eV, 529.91–530.46 eV and 531.10–532.34 eV. They are assigned to lattice oxygen, hydroxyl groups and H2O molecules adsorbed on the samples surface.11 Generally, a high ratio of the peak area of hydroxyl groups to that of lattice oxygen indicates a high concentration of oxygen vacancies.44 According to this rule, it can be speculated that the concentration of oxygen vacancy depends upon the acidity of precursor environment. The 7.01BWO samples have the highest concentration of oxygen vacancy, while the 0.5MNAOH samples have the smallest one.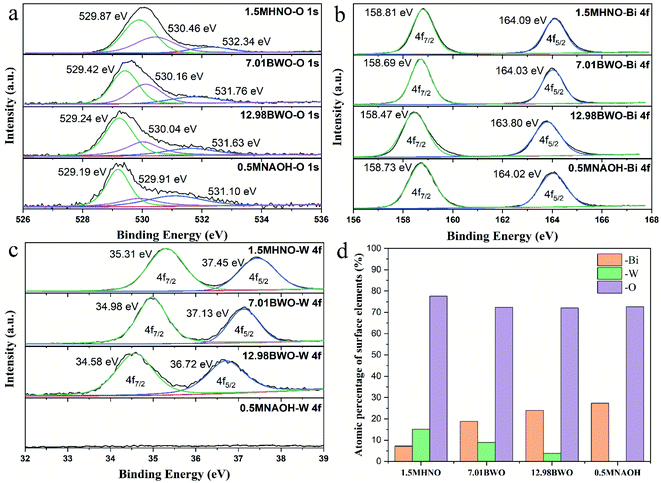 | ||
| Fig. 6 High-resolution XPS spectrums of (a) O 1s, (b) Bi 4f and (c) W 4f of samples; (d) atomic percentage of surface elements on samples. | ||
As shown in Fig. 6b, the spectrum of Bi 4f had two peaks located at around 158.74 eV and 164.05 eV, which correspond to Bi 4f7/2 and 4f5/2, respectively. Moreover, the difference between the two binding energies is about 5.31 eV, indicating the existence of Bi3+ in all samples.10 In Fig. 6c, the peaks around 34.96 and 37.10 eV are fitted into W 4f7/2 and 4f5/2, respectively. The peak distance of 2.14 eV indicates that W in these samples are mainly presented as W6+.45 Moreover, the absence of W peaks in the 0.5MNAOH sample confirms that 0.5MNAOH samples are Bi2O3.
Fig. 6d shows the XPS atomic percentage of surface elements on different samples. The content of O element changes insignificantly with the variation in precursor acidity. When the acidity gradually increases, the W element gradually increases, whereas the Bi element gradually decreases. This finding is associated with gradual transformation of the main substances from Bi2O3 into Bi3.84W0.16O6.24, into Bi2WO6, and into Bi2WO6/WO3·0.33H2O with increasing acidity.
3.5 FTIR analyses
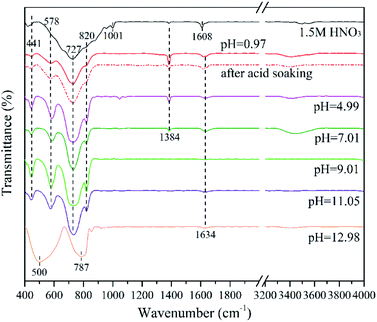
Fig. 7 shows the FTIR spectra of the as-prepared samples. The absorption peaks mainly range from 400 to 1000 cm−1. Specifically, the adsorption band at 441 cm−1 and 578 cm−1 are owing to the bending vibrations of Bi–O bond; the strong peaks at 727 cm−1 and 820 cm−1 are attributed to the W–O and W–O–W bond of Bi2WO6, respectively.16,46 These peaks prove the successful synthesis of Bi2WO6 nanomaterials.The minor peaks at 1001 cm−1 and 1608 cm−1 of 1.5MHNO's FTIR spectrum are assigned to the W![[double bond, length as m-dash]](https://www.rsc.org/images/entities/char_e001.gif) O valence vibrations and δ(O–H) stretching vibrations of coordinated water, respectively. They are likely attributed to the crystal phase of WO3·0.33H2O.47 Additionally, the weak peak at 1634 cm−1 corresponds to the O–H bond of the adsorbed water molecules.48 The peaks at 500 cm−1 and 787 cm−1 are likely originated from the vibrations of Bi–O and W–O bonds of Bi3.84W0.16O6.24. Unlike the characteristic peaks in Bi2WO6, the intensity of the Bi–O peak is greater than that of W–O. This may result from the increase of Bi–O bond in Bi3.84W0.16O6.24.
O valence vibrations and δ(O–H) stretching vibrations of coordinated water, respectively. They are likely attributed to the crystal phase of WO3·0.33H2O.47 Additionally, the weak peak at 1634 cm−1 corresponds to the O–H bond of the adsorbed water molecules.48 The peaks at 500 cm−1 and 787 cm−1 are likely originated from the vibrations of Bi–O and W–O bonds of Bi3.84W0.16O6.24. Unlike the characteristic peaks in Bi2WO6, the intensity of the Bi–O peak is greater than that of W–O. This may result from the increase of Bi–O bond in Bi3.84W0.16O6.24.
It is worth noting that the small peak at 1384 cm−1 corresponds to the vibration of N–O bond.46,48 It was ascribed to the hydrolysis products of Bi(NO3)3·5H2O, such as BiONO3 and Bi2O2(OH)NO3.31,49 This conclusion can also be verified by comparing the FTIR spectra of 0.97BWO before and after the acid treatment. After acid soaking, most of the impurities (BiONO3 and Bi2O2(OH)NO3) in 0.97BWO was dissolved, which corresponds to a sudden decrease in the peak at 1384 cm−1 while others remained almost unchanged. This peak becomes weaker with the increasing alkalinity, and it disappears at pH 9.01. With the escalation of OH− concentration in the precursor, BiONO3 and Bi2O2(OH)NO3 gradually transform into Bi(OH)3, which could be further converted to Bi2O3 via hydrothermal reaction. Furthermore, the tiny peak at 1384 cm−1 of 1.5MHNO is probably due to the hydrolysis of minor residual of Bi3+ ions, which forms BiONO3 precipitates on nanocatalyst surface during washing with ultrapure water.
The nanomaterials synthesized at pH value greater than 7.01 has no obvious peaks between 3400 cm−1 and 3800 cm−1, which are the characteristic peaks of O–H.50–52 It is believed that most Bi(OH)3 was converted to Bi2O3, which is the main impurity at pH ≥ 9.01.
3.6 Stability analysis
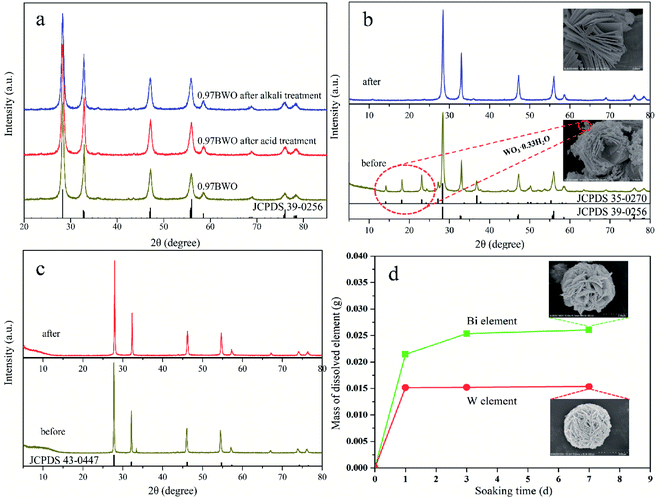
The stability of the prepared Bi2WO6 is evaluated in terms of crystal structure, morphology, and chemical composition. Fig. 8a shows the XRD patterns of original 0.97BWO and 0.97BWO before and after treatment with acid or base solutions, which shows that the three XRD patterns are barely affected by the treatment. They are almost the same, and can match the Bi2WO6 standard card (JCPDS No.: 39-0256) well. It indicates that the crystal structure of as-prepared Bi2WO6 is not damaged during the acid or base treatment.On the contrary, Fig. 8b clearly demonstrates that XRD pattern of 1.5MHNO changes after alkali treatment. The disappearance of the characteristic peaks of WO3·0.33H2O impurity indicates that WO3·0.33H2O in 1.5MHNO can be dissolved in a boiling alkaline solution, but Bi2WO6 is stable. The disappearance of the “nanocrumbs” scattered on the flower-like Bi2WO6 in the inset SEM images supports this conclusion. For Bi3.84W0.16O6.24 (Fig. 8c), XRD spectrum remains the same before and after acid leaching, indicating that Bi3.84W0.16O6.24 is relatively stable.
The chemical stability of Bi2WO6 is verified by ICP-MS data. Fig. 8d shows the variation of Bi and W elements leached from 1 g of 0.97BWO sample over 7 days. As soaking time increases, the mass of dissolved Bi element in the HNO3 solution at pH 0.5 first increased and then leveled off. Similar trend is observed for the change of W element dissolved in 0.5 M NaOH solution. The constant quantity of the leaching elements after 3 days strongly proves the chemical stability of Bi2WO6. Meanwhile, undamaged microspheres of 0.97BWO in the inset SEM images of Fig. 8d indicates morphological stability.
In summary, Bi2WO6 and Bi3.84W0.16O6.24 are stable enough to resist dissolution during acid and base treatments. Therefore, the Bi and W elements measured by ICP-MS in the following leaching experiment are believed to be derived from soluble impurities rather than from Bi2WO6 and Bi3.84W0.16O6.24.
3.7 Determination of impurities
The impurities in Bi2WO6 prepared under a wide range of acid–base conditions were qualitatively analyzed according to the characterization results and hydrolysis properties of the raw materials. The mass percentage of impurities was calculated using ICP-MS results, and the accuracy was verified by several weight difference experiments.It is believed that the impurities in the Bi2WO6 nanomaterials prepared using hydrothermal reaction are primarily hydrolysis products and derivatives of Bi3+ and WO42− ions. The primary impurities include WO3·0.33H2O, BiONO3, Bi2O2(OH)NO3, and Bi2O3. Eqn (1)–(6) describe the formation of such impurities. When the pH of the precursor is lower than 1.13, WO42− ions will combine with H+ ions to form H2WO4, which is transformed to WO3·0.33H2O in the subsequent hydrothermal reaction (eqn (1) and (2)). Bi3+ ions are subject to hydrolysis to form BiONO3 and Bi2O2(OH)NO3 precipitates when the pH is greater than 0.67 (eqn (3) and (4)). Since the degree of hydrolysis in the second step (eqn (4)) is much lower than that in the first step (eqn (3)), the hydrolysis products of Bi3+ ions are mainly BiONO3 instead of Bi2O2(OH)NO3. In a relatively strong base solution, impurities could progressively turn to Bi2O3, which is transformed from Bi(OH)3 (eqn (5) and (6)).
| WO42− + 2H+ → H2WO4 | (1) |
| H2WO4 → WO3·0.33H2O + 0.67H2O | (2) |
| Bi(NO3)3 + H2O ↔ BiONO3 + 2HNO3 | (3) |
| 2BiONO3 + H2O ↔ Bi2O2(OH)NO3 + HNO3 | (4) |
| Bi(NO3)3 + 3OH− → Bi(OH)3 + 3NO3− | (5) |
| 2Bi(OH)3 → Bi2O3 + 3H2O | (6) |
Fig. 9 indicates both Bi3+ and WO42− ions can be hydrolyzed at pH 0.97. Their major hydrolysis products, WO3·0.33H2O and BiONO3, could appear in the catalysts. The presence of WO3·0.33H2O is proven by ICP-MS measurements. The peak at 1384 cm−1 in the FTIR spectra confirms the presence of BiONO3.
For the pH values between 2.99 and 7.01, the hydrolysis of WO42− ions becomes negligible. BiONO3, which is the predominant product of Bi3+ hydrolysis, constitutes to the impurity in the samples. The FTIR spectra of samples prepared within this pH range have a clear peak at 1384 cm−1, indicating the existence of BiONO3. As indicated by the FTIR results the hydrolysate BiONO3 disappears when synthesizing catalyst under alkaline (pH ≥ 9.01) conditions. The presence of Bi(OH)3 seems unlikely because there is not obvious vibration characteristic peak of O–H. Earlier studies indicate that impurities are very likely Bi2O3,38,54–56 which could be converted from Bi(OH)3 through hydrothermal reactions.
The Bi3+ ions were identified by ICP-MS after the 12.98BWO sample was soaked in acid solution, indicating the presence of acid soluble impurities. The aforementioned FTIR analysis proves that the acid-soluble impurity in 12.98BWO is likely Bi2O3. It is believed that the impurity is δ-Bi2O3 (ref. 57) because the positions of strong diffraction peaks of δ-Bi2O3 in XRD pattern (JCPDS No.: 27-0052 or JCPDS No.: 52-1007) are almost overlapping with those of the primary crystal phase of Bi3.84W0.16O6.24.
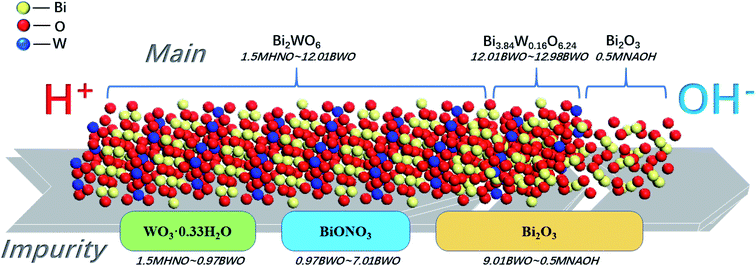
Fig. 10 shows a concise diagram based on the preceding analyses presented to describe the transformation of samples and their impurities with the change of acid and alkali environments. Both the main compounds and the impurities in the samples undergo transformation. The main compounds begin to convert from Bi2WO6 to Bi3.84W0.16O6.24 at precursor pH of around 12. Further increase in alkalinity leads to the production of Bi2O3. The impurities then gradually shift from WO3·0.33H2O to BiONO3 around pH 1, and to Bi2O3 at near pH 7.
Weight difference experiments were conducted before and after purification to validate our identification analysis and the newly developed quantification method using ICP-MS. The results are tabulated in the last column of Table 1. ICP-MS provides similar results to the weight difference experiments. Most discrepancies are within 3.5%, except for the 12.98BWO samples, which is 11%. This indicates the analysis of impure compounds and quantitative determination of impurities using ICP-MS method are reliable.
| Samples | Impurities | Mass weight (%) ICP-MS | Mass weight (%) weight difference experiment |
|---|---|---|---|
| 1.5MHNO | WO3·0.33H2O | 41.09 | 39.75 |
| 1.25MHNO | WO3·0.33H2O | 14.27 | — |
| 1MHNO | WO3·0.33H2O | 9.90 | — |
| 0.5MHNO | WO3·0.33H2O | 5.99 | — |
| 0.97BWO | WO3·0.33H2O/BiONO3 | 1.99/3.58 | —/3.63 |
| 2.99BWO | BiONO3 | 3.52 | — |
| 4.99BWO | BiONO3 | 2.75 | — |
| 7.01BWO | BiONO3 | 2.80 | — |
| 9.01BWO | Bi2O3 | 1.50 | — |
| 10.00BWO | Bi2O3 | 2.03 | — |
| 11.05BWO | Bi2O3 | 4.90 | — |
| 12.98BWO | Bi2O3 | 18.88 | 21.26 |
| 0.5MNAOH | Bi2O3 | 102.90 | 100.00 |
4. Conclusions
In summary, Bi2WO6 nanomaterials synthesized by hydrothermal methods in different acid–base environments all contain impurities. The pathway of impurities conversion with continuously changing acidity or alkalinity was determined. Strong acidity can lead to the formation of WO3·0.33H2O as impurities. Impurities such as BiONO3, Bi2O2(OH)NO3 and Bi2O3 appeared as the alkalinity increases. The synthesized catalysts had a relatively high purity when the pH of precursor is between 1 and 10. In addition, the as-prepared Bi2WO6 and Bi3.84W0.16O6.24 nanomaterials were stable in both acid and base environments. Furthermore, this study provides a simple and feasible method to quantitatively analyze the impurity of Bi2WO6, which was verified by weight difference experiments. This work is expected to shed light onto Bi2WO6-related studies and investigations using Bi(NO3)3·5H2O and/or Na2WO4·2H2O as raw materials.Conflicts of interest
There are no conflicts to declare.Acknowledgements
This work is financially supported by “the Fundamental Research Funds for the Central Universities” (No.: 2019XKQYMS59). The authors would like to acknowledge the technical support from Advanced Analysis and Computation Center within China University of Mining and Technology.References
- M. Kong, Y. Li, X. Chen, T. Tian, P. Fang, F. Zheng and X. Zhao, J. Am. Chem. Soc., 2011, 133, 16414–16417 CrossRef CAS
.
- T. J. Liu, Q. Wang and P. Jiang, RSC Adv., 2013, 3, 12662–12670 RSC
.
- H. L. Zhang and C. G. Hu, Catal. Commun., 2011, 14, 32–36 CrossRef CAS
.
- Z. Li, W. Luo, M. Zhang, J. Feng and Z. Zou, Energy Environ. Sci., 2013, 6, 347–370 RSC
.
- B. Y. Alfaifi, A. A. Tahir and K. G. U. Wijayantha, Sol. Energy Mater. Sol. Cells, 2019, 195, 134–141 CrossRef CAS
.
- F. Ma, Q. Yang, Z. Wang, Y. Liu, J. Xin, J. Zhang, Y. Hao and L. Li, RSC Adv., 2018, 8, 15853–15862 RSC
.
- S. W. Cao, B. J. Shen, T. Tong, J. W. Fu and J. G. Yu, Adv. Funct. Mater., 2018, 28, 11 Search PubMed
.
- J. Zhao, Y. Yang, X. Dong, Q. Ma, W. Yu, J. Wang and G. Liu, RSC Adv., 2016, 6, 64741–64748 RSC
.
- Y. Huang, Z. H. Ai, W. K. Ho, M. J. Chen and S. Lee, J. Phys. Chem. C, 2010, 114, 6342–6349 CrossRef CAS
.
- H. Huang, K. Liu, K. Chen, Y. Zhang, Y. Zhang and S. Wang, J. Phys. Chem. C, 2014, 118, 14379–14387 CrossRef CAS
.
- H. Huang, R. Cao, S. Yu, K. Xu, W. Hao, Y. Wang, F. Dong, T. Zhang and Y. Zhang, Appl. Catal., B, 2017, 219, 526–537 CrossRef CAS
.
- A. Kudo and S. Hijii, Chem. Lett., 1999, 28, 1103–1104 CrossRef
.
- Y. Y. Li, J. P. Liu, X. T. Huang and G. Y. Li, Cryst. Growth Des., 2007, 7, 1350–1355 CrossRef CAS
.
- X. Lin, Z. X. Liu, X. Y. Guo, C. B. Liu, H. J. Zhai, Q. W. Wang and L. M. Chang, Mater. Sci. Eng., B, 2014, 188, 35–42 CrossRef CAS
.
- J. Huang, G. Tan, A. Xia, H. Ren and L. Zhang, Res. Chem. Intermed., 2014, 40, 903–911 CrossRef CAS
.
- A. Kaur and S. K. Kansal, Chem. Eng. J., 2016, 302, 194–203 CrossRef CAS
.
- M. S. Gui and W. D. Zhang, Nanotechnology, 2011, 22, 9 CrossRef
.
- T. Y. Han, X. Wang, Y. C. Ma, G. L. Shao, X. L. Dong and C. L. Yu, J. Sol-Gel Sci. Technol, 2017, 82, 101–108 CrossRef CAS
.
- P. Zhang, X. Teng, X. Feng, S. Ding and G. Zhang, Ceram. Int., 2016, 42, 16749–16757 CrossRef CAS
.
- S. O. Alfaro and A. Martínez-de La Cruz, Appl. Catal., A, 2010, 383, 128–133 CrossRef CAS
.
- Y. Zhou, Z. P. Tian, Z. Y. Zhao, Q. Liu, J. H. Kou, X. Y. Chen, J. Gao, S. C. Yan and Z. G. Zou, ACS Appl. Mater. Interfaces, 2011, 3, 3594–3601 CrossRef CAS
.
- X. Wang, L. Chang, J. Wang, N. Song, H. Liu and X. Wan, Appl. Surf. Sci., 2013, 270, 685–689 CrossRef CAS
.
- C. Zhang and Y. Zhu, Chem. Mater., 2005, 17, 3537–3545 CrossRef CAS
.
- H. Huang, H. Chen, Y. Xia, X. Tao, Y. Gan, X. Weng and W. Zhang, J. Colloid Interface Sci., 2012, 370, 132–138 CrossRef CAS
.
- T. Hu, H. Li, R. Zhang, N. Du and W. Hou, RSC Adv., 2016, 6, 31744–31750 RSC
.
- H. Zhou, Z. Wen, J. Liu, J. Ke, X. Duan and S. Wang, Appl. Catal., B, 2019, 242, 76–84 CrossRef CAS
.
- M. S. Gui, W. D. Zhang, Y. Q. Chang and Y. X. Yu, Chem. Eng. J., 2012, 197, 283–288 CrossRef CAS
.
- S. Yao, J. Wei, B. Huang, S. Feng, X. Zhang, X. Qin, P. Wang, Z. Wang, Q. Zhang and X. Jing, J. Solid State Chem., 2009, 182, 236–239 CrossRef CAS
.
- R. Senthil Kumar and P. Rajkumar, Infrared Phys. Technol., 2014, 67, 30–41 CrossRef CAS
.
- A. Kljun, T. A. S. Benians, F. Goubet, F. Meulewaeter, J. P. Knox and R. S. Blackburn, Biomacromolecules, 2011, 12, 4121–4126 CrossRef CAS
.
- D. M. Chen, Q. Hao, Z. H. Wang, H. Ding and Y. F. Zhu, Crystengcomm, 2016, 18, 1976–1986 RSC
.
- S. F. Chen, W. M. Tang, Y. F. Hu and X. L. Fu, Crystengcomm, 2013, 15, 7943–7950 RSC
.
- Z. Q. Jia and C. N. Tian, Desalination, 2009, 247, 423–429 CrossRef CAS
.
- P. Goodman, R. Marks, C. Nexhip, T. A. O'Donnell and P. Miller, Physica C, 1993, 217, 325–334 CrossRef CAS
.
- H. Wang, Y. Liang, L. Liu, J. Hu and W. Cui, Appl. Surf. Sci., 2017, 392, 51–60 CrossRef CAS
.
- X. Zhao, T. G. Xu, W. Q. Yao, C. Zhang and Y. F. Zhu, Appl. Catal., B, 2007, 72, 92–97 CrossRef CAS
.
- J. Shi, Y. Liang, Z. Li and B. Fang, ChemistrySelect, 2019, 4, 5010–5018 CrossRef CAS
.
- M. Malligavathy and P. D. Pathinettam, Adv. Mater. Processes, 2017, 2, 51–55 CrossRef
.
- A. Rauf, M. S. A. Sher Shah, G. H. Choi, U. B. Humayoun, D. H. Yoon, J. W. Bae, J. Park, W. J. Kim and P. J. Yoo, Adv. Mater. Processes, 2015, 3, 2847–2855 CAS
.
- T. Saison, P. Gras, N. Chemin, C. Chanéac, O. Durupthy, V. Brezova, C. Colbeau-Justin and J.-P. Jolivet, J. Phys. Chem. C, 2013, 117, 22656–22666 CrossRef CAS
.
- Y. Zhuo, J. Huang, L. Cao, H. Ouyang and J. Wu, Mater. Lett., 2013, 90, 107–110 CrossRef CAS
.
- C. Wang, L. Zhu, C. Song, G. Shan and P. Chen, Appl. Catal., B, 2011, 105, 229–236 CrossRef CAS
.
- P. Xiao, L. Zhu, Y. Zhu and Y. Qian, J. Solid State Chem., 2011, 184, 1459–1464 CrossRef CAS
.
- M. T. L. Lai, C. W. Lai, K. M. Lee, S. W. Chook, T. C. K. Yang, S. H. Chong and J. C. Juan, J. Alloys Compd., 2019, 801, 502–510 CrossRef CAS
.
- S. Zhong, C. Li, M. Shen, C. Lv and S. Zhang, J. Mater. Res. Technol., 2019, 8, 1849–1858 CrossRef CAS
.
- Z. Du, R. Guo, J. Lan, S. Jiang, C. Cheng, L. Zhao and L. Peng, Fibers Polym., 2017, 18, 2212–2218 CrossRef CAS
.
- B. Liu, J. Wang, J. Wu, H. Li, Z. Li, M. Zhou and T. Zuo, J. Mater. Chem. A, 2014, 2, 1947–1954 RSC
.
- L. Wang, G. Yang, D. Wang, C. Lu, W. Guan, Y. Li, J. Deng and J. Crittenden, Appl. Surf. Sci., 2019, 495, 143521 CrossRef CAS
.
- L. Hao, L. Kang, H. W. Huang, L. Q. Ye, K. L. Han, S. Q. Yang, H. J. Yu, M. Batmunkh, Y. H. Zhang and T. Y. Ma, Adv. Mater., 2019, 31, 7 Search PubMed
.
- L. Chang, F. Cao, J. Cai, W. Liu, J. Zhang and C. Cao, Electrochem. Commun., 2009, 11, 2245–2248 CrossRef CAS
.
- A. Mihaylova, K. Hadjiivanov, S. Dzwigaj and M. Che, J. Phys. Chem. B, 2006, 110, 19530–19536 CrossRef CAS
.
- R. Kefirov, E. Ivanova, K. Hadjiivanov, S. Dzwigaj and M. Che, Catal. Lett., 2008, 125, 209 CrossRef CAS
.
- Y. Tian, G. Hua, W. Xu, N. Li, M. Fang and L. Zhang, J. Alloys Compd., 2011, 509, 724–730 CrossRef CAS
.
- M. Ge, Y. Li, L. Liu, Z. Zhou and W. Chen, J. Phys. Chem. C, 2011, 115, 5220–5225 CrossRef CAS
.
- M. Faisal, A. A. Ibrahim, H. Bouzid, S. Al Sayari, M. Al Assiri and A. A. Ismail, J. Mol. Catal. A: Chem., 2014, 387, 69–75 CrossRef CAS
.
- T. Wang, F. Zhang, G. Xiao, S. Zhong and C. Lu, Photochem. Photobiol., 2015, 91, 291–297 CrossRef CAS
.
- A. Phuruangrat, P. Dumrongrojthanath, N. Ekthammathat, S. Thongtem and T. Thongtem, J. Nanomater., 2014, 2014, 59 Search PubMed
.
| This journal is © The Royal Society of Chemistry 2020 |

