 Open Access Article
Cationic gemini surfactant stimulates amyloid fibril formation in bovine liver catalase at physiological pH. A biophysical study
Javed Masood Khan *a,
Ajamaluddin Malikb,
Md. Tabish Rehmanc,
Mohamed F. AlAjmic,
Mohammad Z. Ahmedc,
Ghada Obaid Almutairib,
Md. Khalid Anwerd and
Rizwan Hasan Khane
aDepartment of Food Science and Nutrition, Faculty of Food and Agricultural Sciences, King Saud University, 2460, Riyadh 11451, Saudi Arabia. E-mail: jmkhan@ksu.edu.sa; javedjmk@gmail.com
bDepartment of Biochemistry, College of Science, King Saud University, Riyadh, Saudi Arabia
cDepartment of Pharmacognosy, College of Pharmacy, King Saud University, Riyadh, Saudi Arabia
dDepartment of Pharmaceutics, College of Pharmacy, Prince Sattam Bin Abdulaziz University, Alkharj, 11942, Saudi Arabia
eInterdisciplinary Biotechnology Unit, Aligarh Muslim University, Aligarh, U.P., India
First published on 8th December 2020
Abstract
Surfactant molecules stimulate amyloid fibrillation and conformational switching in proteins but the mechanisms by which they accomplish these effects are unclear. A cationic gemini surfactant, C16C4C16Br2, with two positively charged heads and two-16C hydrophobic tails induces the amyloid fibrillation of bovine liver catalase (BLC) in vitro at physiological pH. The BLC transformed into amyloid aggregates in the presence of low concentrations (2–150 μM) of C16C4C16Br2 at pH 7.4, as confirmed by the use of several biophysical techniques (Rayleigh light scattering (RLS), intrinsic fluorescence, thioflavin T fluorescence (ThT), far-UV circular dichroism, and transmission electron microscopy). The secondary structure of BLC also changed according to the concentration of C16C4C16Br2: the α-helical structure of BLC decreased in the presence of 2–100 μM of C16C4C16Br2 but at concentrations above 200 μM BLC regained a α-helical structure very similar to the native BLC. In silico molecular docking between BLC and C16C4C16Br2 suggest that the positively charged heads of the surfactant interact with Asp127 through attractive electrostatic interactions. Moreover, a Pi-cation electrostatic interaction and hydrophobic interactions also take place between the tails of the surfactant and BLC. The stability of the BLC–C16C4C16Br2 complex was confirmed by performing a molecular dynamics simulation and evaluating parameters such as root mean square deviation (RMSD), root mean square fluctuation (RMSF), radius of gyration (Rg), and solvent accessible surface area (SASA). Apart from its aggregation inducing properties, the gemini surfactant itself causes toxicity to the cancerous cell (A549): which is confirmed by MTT assay. This work delivers new insight into the effect of cationic gemini surfactants in amyloid aggregation and paves the way to the rational design of new anti-amyloidogenic agents.
Introduction
Amyloidosis is caused by the deposition of globular soluble proteins into insoluble amyloid-like structures in the extracellular spaces, causing cell death and tissue degeneration.1 More than 25 types of proteins and polypeptides are associated with several neuronal diseases. For instance, the Aβ peptide is directly linked to Alzheimer's disease, the PrP protein is related to transmissible spongiform encephalopathies, familial amyloidoses are due to the misfolding of transthyretin and lysozyme, and so on.2,3 There are two types of amyloidogenic proteins: (i) globular proteins with a defined tertiary structure and (ii) proteins devoid of tertiary structures (disordered proteins).2,4 Amyloid fibrils are ordered aggregates with a “cross-β” core structure made up of β-sheets arrays and arranged parallel to the long axis of the fibrils.5 Globular proteins partially unfold at low pH and high temperature and then form well-defined amyloid-like aggregates.6,7 Many proteins have a strong tendency to form amyloid or amyloid-like aggregates by interacting with surfactants and lipids at physiological and low pH.8,9 Generally, anionic surfactants stimulate amyloid fibril formation in proteins.10 Negatively charged surfactants and phospholipids interact with proteins via electrostatic and hydrophobic interaction and stimulate amyloid fibril formation.11,12 Monomeric sodium dodecyl sulfate (SDS) binds to proteins and changes their local conformation, however, at micellar concentrations it causes more global change and the proteins unfold.13 Several anionic surfactants such as sodium dodecyl sulfate, sodium octyl sulfate, and sodium deoxycholate, accelerate amyloid fibrillation of β2-microglobulin near the critical micelle concentration (CMC).14 Generally, cationic surfactants do not form electrostatic interactions with proteins but this depends on pH.15 Cationic surfactants may also promote amyloidosis.16 In this study, we explored the effects of a non-conventional gemini surfactant i.e., bis(cetyldimethylammonium)butane dibromide (C16C4C16Br2) on the structures of BLC. The C16C4C16Br2 surfactant is dimeric in nature and consists of two identical amphiphilic moieties (16C) (hydrophobic chains and two polar head groups). A 4C spacer at the head groups connects both the amphiphilic moieties. Gemini surfactants have gained substantial attention due to their unique properties and applications. They have a lower CMC compared to the single-chain conventional surfactants.17 Gemini surfactants have several important applications. For example, they are used as an additive in the mitigation and remediation of soils contaminated by organic compounds. Gemini surfactants also emulsify fuels for diesel engines and improve improved engine performance, reduce emissions, and reduce in torque18Besides, they have lower aquatic toxicity compared to the monomeric ones. This lower toxicity may be directly related to the higher hydrophilicity of the gemini surfactants.19 They also exhibit extremely high antimicrobial activity against bacteria, viruses, molds, and yeasts and their minimal inhibitory concentrations (MICs) are lower than that the monomeric conventional surfactants.20 Gemini surfactants are relatively easy to eliminate from the environment as they are more susceptible to alkaline hydrolysis compared to monomeric conventional surfactants.21 The hydrophobicity of gemini surfactants also plays an important role in protein–surfactant interactions.22
Here, we investigate the effect of the cationic gemini surfactant C16C4C16Br2 on the formation of amyloid fibrils in BLC at physiological pH. The critical micellar concentrations of gemini (C16C4C16Br2) surfactant was found around 0.025 mM in distilled water.23 The mechanism by which gemini surfactants stimulate amyloid fibril formation in proteins is reported very less.24,25 This motivated us to explore the influence of a gemini surfactant on amyloid fibril formation of BLC at physiological pH.
Catalase is a ubiquitous enzyme found in almost every aerobic organism and it protects cells from the adverse effects of free radicals. BLC is a tetrameric protein with a molecular mass of 240 kDa, composed of four identical (∼57 kDa) subunits, each possessing a high-spin Fe(III) protoporphyrin IX.26 This enzyme has the highest turnover number (4 × 10⁷ s−1) and it is not obeying ordinary Michaelis–Menton mechanism.27 BLC has many industrial (dairy and textile industries) and medical applications (breakdown the reactive oxygen spices i.e., hydrogen peroxide (H2O2) into H2O).28 Catalase is also used as a biosensor for the detection of H2O2.29
In the current work, we analyzed the conformational changes of BLC proteins when exposed to various concentrations of C16C4C16Br2 at physiological pH. The conformational transition was characterized by the use of spectroscopic, microscopic, and computational techniques. The cytotoxicity effect of gemini surfactant was also evaluated in details.
Experimental section
Chemicals
Bovine liver catalase (BLC), and thioflavin-T were purchased from Sigma-Aldrich Chemicals Co. (St. Louis, MO, USA). Human lung cancer cell line A549 (ATCC® CCL-185) was purchased from ATCC. The gemini surfactant (C16C4C16Br2) was provided by Dr Amin Mir from the Department of Chemistry, University of Kashmir, Srinagar, India. All other chemicals used were of analytical grade.BLC stock preparation
BLC concentration was measured on a PerkinElmer, Lamda 25 spectrophotometer attached with Peltier. The absorbance of BLC was taken at 405 nm and stock concentrations were calculated using an extinction coefficient E1 cm1% of 13.5.30Rayleigh light scattering (RLS) measurements
C16C4C16Br2-induced aggregation of BLC was assessed by measuring light scattering measurements on a Cary Eclipse fluorescence spectrophotometer (Agilent Technologies) at room temperature. The BLC (0.2 mg mL−1) samples treated with 0 to 750 μM C16C4C16Br2 at pH 7.4 and incubated for 12 h. The incubated samples were excited at 350 nm and the emission in the range of 300–450 nm was recorded. The light scattering values at 350 nm were then plotted against C16C4C16Br2 concentration.Tryptophan fluorescence
Trp fluorescence spectra were scanned on a Cary Eclipse fluorescence spectrophotometer in a 1 cm path-length quartz cell. All the samples BLC (0.2 mg mL−1) with and without C16C4C16Br2 were equilibrated for 12 h at room temperature. A BLC concentration of 0.2 mg mL−1 was used in all the samples and the measurements were made at room temperature. All the samples were excited at 295 nm and the spectra were scanned in from 300 to 400 nm.Thioflavin-T (ThT) assay
ThT was dissolved in MilliQ water and filtered through a 0.45 μM Millipore syringe filter. After filtration, the ThT concentration was calculated using a molar extinction coefficient of 36![[thin space (1/6-em)]](https://www.rsc.org/images/entities/char_2009.gif) 000 M−1 cm−1 at 412 nm. The BLC samples (0.2 mg mL−1) treated with different C16C4C16Br2 concentrations were incubated for 12 h at pH 7.4. The 5.0 μM ThT solution was added to the C16C4C16Br2-treated BLC samples and again incubate for 30 min in the dark. ThT-incubated samples were then excited at 440 nm and emission was recorded from 450 to 600 nm on a Cary Eclipse fluorescence spectrophotometer. Excitation and emission slit widths were fixed at 5.0 nm.
000 M−1 cm−1 at 412 nm. The BLC samples (0.2 mg mL−1) treated with different C16C4C16Br2 concentrations were incubated for 12 h at pH 7.4. The 5.0 μM ThT solution was added to the C16C4C16Br2-treated BLC samples and again incubate for 30 min in the dark. ThT-incubated samples were then excited at 440 nm and emission was recorded from 450 to 600 nm on a Cary Eclipse fluorescence spectrophotometer. Excitation and emission slit widths were fixed at 5.0 nm.
Circular dichroism measurements
CD measurements were made at room temperature on a Chirascan Plus spectropolarimeter (Applied Photophysics Ltd., Leatherhead, Surrey, UK) was calibrated with ammonium (+)-10-camphorsulfonate. The CD results are presented as the mean residual ellipticity (MRE).| MRE = θobs(mdeg)/10 × n × Cp × l |
Transmission electron microscopy (TEM)
TEM images of C16C4C16Br2-induced BLC aggregates were viewed on a JOEL TEM operating at an accelerating voltage of 200 kV. The 10 μL samples of C16C4C16Br2-induced BLC aggregate were poured onto a 200-mesh copper grid and incubated for 5 min. The excess fluids were removed using Whatman paper and then the dried grids were negatively stained with 2% (w/v) uranyl acetate. The stained grids were further dried in a desiccator for two days and then viewed in TEM.Molecular docking
To visualize the interaction between C16C4C16Br2 and BLC, molecular docking was performed using AutoDock4.2 as described previously.31 The 2D structure of C16C4C16Br2 was drawn using the Sketcher module in “Maestro-2018 (Schrodinger, LLC, NY, USA)” and its energy was minimized using the OPLS3e forcefield. The ionization state of C16C4C16Br2 was generated at pH 7.4 using Epik-2018 (Schrodinger, LLC, NY, USA). The 3D coordinates of BLC (PDB ID 1TGU) were retrieved from PDB-RCSB databank. Before molecular docking, the BLC structure was preprocessed using the protein preparation wizard of Maestro-2018 (Schrodinger, LLC, NY, USA) as reported previously.32 Crystallographic water molecules and any heterogeneous ligand were deleted, missing hydrogen atoms were incorporated, and correct bond orders were allotted. A network of hydrogen bonds was produced and the whole system was energy-minimized using the OPLS3e forcefield. The dimensions of the grid-box were set to 85 × 85 × 85 Å centered at 36.3, 32.1, and 29.0 Å with 0.375 Å spacing. For molecular docking, Lamarckian Genetic Algorithm (LGA) along with Solis and Wets local search methods were engaged, as described previously.33 The initial position of C16C4C16Br2, its orientation and torsion were set arbitrarily. The maximum number of energy calculations was set at 2.5 × 10⁶ for each docking run, keeping the population size at 150, the translational step at 0.2 Å, and torsion steps and quaternion at 5. Discovery Studio (Accelrys) was utilized to analyze the docking results and prepare the final figures. The docking affinity of C16C4C16Br2 for BLC was determined from docking energy (ΔG) using the following equation:34ΔG = −RT![[thin space (1/6-em)]](https://www.rsc.org/images/entities/char_2009.gif) ln ln![[thin space (1/6-em)]](https://www.rsc.org/images/entities/char_2009.gif) Kd Kd |
Molecular dynamics simulation
C16C4C16Br2 was evaluated by performing a molecular dynamics simulation using Desmond-2018 (Schrodinger, LLC, NY, USA) as reported previously.31 Briefly, the BLC–C16C4C16Br2 complex was placed at the center of an orthorhombic simulation box, and at least 1 nm away from the box boundaries. The simulation box was solvated with TIP3P water molecules and counterions were added to neutralize the system. Physiological conditions were mimicked by adding 150 mM NaCl. The temperature and pressure were maintained at 300 K and 1 bar atmosphere and maintained constant throughout the simulation using Nose–Hoover chain thermostat and Martyna–Tobias–Klein barostat, respectively.9,35 Before the production run, the whole system was minimized (2000 iterations) keeping a convergence criterion of 1 kcal mol−1 Å−1. Molecular dynamics simulation was performed for 50 ns with a time step of 2 fs. The structure and energy were recorded in the trajectory at every 10 ps. The results were analyzed in Maestro-2018 (Schrodinger, LLC, NY, USA) and the plots were drawn in Origin Pro 8.Evaluation of the cytotoxic effect of the gemini surfactant
The cytotoxic activity of C16C4C16Br2 was tested in a human lung cancer cell line A549 (ATCC® CCL-185) which was obtained from ATCC. Briefly, the A549 cells were seeded in a 96-well plate (1 × 10⁴ cells per well) and kept overnight for adhesion at 37 °C in a humidified atmosphere at 5% CO2. The culture was maintained in Dulbecco's Modified Eagle Medium (DMEM) (GIBCO) supplemented with 10% Fetal Bovine Serum (FBS) and 1% penicillin–streptomycin antibiotic (10![[thin space (1/6-em)]](https://www.rsc.org/images/entities/char_2009.gif) 000 U ml−1). The next day cells were washed twice with 1× PBS and placed in fresh medium (DMEM without FBS and antibiotic) along with different concentrations of C16C4C16Br2 (0 μM to 100 μM) and incubated for 3.5 h at 37 °C. Controls with and without C16C4C16Br2 were set aside to determine the extent of cell survival. After 3.5 h, the cellular morphology changes were observed using a phase-contrast microscope. MTT (10 μL at 10 mg mL−1) was added in each well and incubated for 3 hours at 37 °C. Living cells reduce the yellow dye MTT to purple formazan. After removal of medium, 200 μL of acidified isopropyl alcohol (0.04 N HCl) was added and the samples were slowly shaken at room temperature for 10 to 15 min. The color change was quantified with an ELISA plate reader (570 nm) using a Bio-Tek microplate reader. The cell viability was calculated as follows:
000 U ml−1). The next day cells were washed twice with 1× PBS and placed in fresh medium (DMEM without FBS and antibiotic) along with different concentrations of C16C4C16Br2 (0 μM to 100 μM) and incubated for 3.5 h at 37 °C. Controls with and without C16C4C16Br2 were set aside to determine the extent of cell survival. After 3.5 h, the cellular morphology changes were observed using a phase-contrast microscope. MTT (10 μL at 10 mg mL−1) was added in each well and incubated for 3 hours at 37 °C. Living cells reduce the yellow dye MTT to purple formazan. After removal of medium, 200 μL of acidified isopropyl alcohol (0.04 N HCl) was added and the samples were slowly shaken at room temperature for 10 to 15 min. The color change was quantified with an ELISA plate reader (570 nm) using a Bio-Tek microplate reader. The cell viability was calculated as follows:| % V = (Atreatment − Ablank/Acontrol − Ablank) × 100 |
Results
Rayleigh scattering measurements
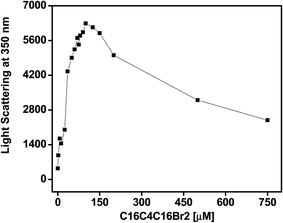
The fluorescence intensity at 350 nm after excitation at the same wavelength is a very sensitive method used to study protein aggregation. The RLS measurements allowed us to observe the impact of C16C4C16Br2 on BLC aggregation at pH 7.4. The light scattering at 350 nm of BLC samples with increasing concentrations of C16C4C16Br2 was measured at pH 7.4 at room temperature. As shown in Fig. 1, the BLC sample without C16C4C16Br2 showed no scattering, indicating the absence of aggregates at this pH. However, the for BLC samples incubated with C16C4C16Br2 concentrations from 2.0 to 125.0 μM, a continuous increase in light scattering was recorded. Moreover, for concentrations ≥150.0 μM scattering suddenly dropped but was not completely lost. The RLS results suggest that at C16C4C16Br2 concentrations ranging from 35.0 to 125.0 μM, large aggregates were formed, and the scattering drop observed at higher C16C4C16Br2 concentrations was due to the formation of smaller BLC aggregates.Intrinsic fluorescence changes of BLC exposed to C16C4C16Br2
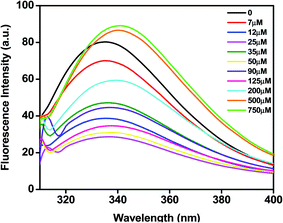
Most proteins possess tryptophan (Trp), tyrosine (Tyr), and phenylalanine (Phe) amino acids and these residues have an intrinsic fluorescence property. Intrinsic fluorescence spectroscopy is an effective method to evaluate the conformational changes of BLC caused by C16C4C16Br2. The BLC samples with increasing concentrations of C16C4C16Br2 were excited at 295 nm which exclusively excites the Trp residues and the emission maximum between 300 and 400 nm was recorded. As shown in Fig. 2, the emission maximum of BLC was observed at ∼335 nm. However, the fluorescence intensity of BLC decreases after the addition of C16C4C16Br2 (7–125 μM) and the wavelength maximum was significantly shifted towards red wavelength. The initial decrease in fluorescence intensity with a slight red shift in wavelength maxima indicates that BLC forms aggregates in the presence of C16C4C16Br2. Next, the fluorescence intensity of BLC increased compared to native BLC with a red shift of almost 10 nm in the presence of higher C16C4C16Br2 concentrations (500.0 and 750.0 μM). This increase in fluorescence intensity accompanied by a red shift was characteristic of a conformational change of BLC. The change in intrinsic fluorescence suggests that BLC aggregates in the presence of lower C16C4C16Br2 concentrations, while higher concentrations provoke conformational changes.Gemini (C16C4C16Br2)-induced fibrillation of BLC measured by ThT
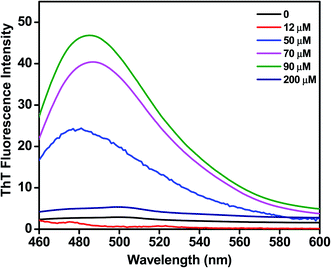
We assessed the influence of C16C4C16Br2 on the fibrillation of BLC using a ThT fluorescence assay. ThT dye binding is a widely used method to monitor the fibrillation of proteins. As shown in Fig. 3, the BLC sample without C16C4C16Br2 does not display ThT fluorescence, which confirms that BLC alone does not aggregate. When lower concentrations (12–90 μM) of C16C4C16Br2 were added, the ThT fluorescence increased dose-dependently, reaching a maximum value at 90 μM C16C4C16Br2. In contrast, higher concentrations of C16C4C16Br2 (≥150 μM) resulted in a complete loss of ThT fluorescence. Overall, these results suggest that low concentrations of C16C4C16Br2 dose-dependently induce amyloid fibrillation of BLC but the fibrils disappeared in the presence of higher C16C4C16Br2 concentrations.Secondary structure modification by C16C4C16Br2
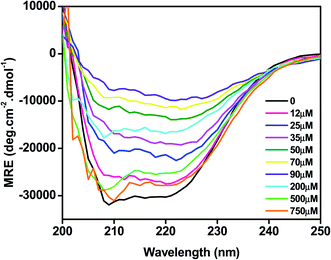
The effect of C16C4C16Br2 on the secondary structure of BLC was studied by CD spectroscopy. As presented in Fig. 4, the far UV-CD spectrum of BLC without C16C4C16Br2 shows two negative minima around 208 and 222 nm, which is typical of α-helical structure.36 When BLC was treated with 12.0–90.0 μM of C16C4C16Br2, negative ellipticity decreased gradually, reaching a minimum in the presence of 90.0 μM C16C4C16Br2. These changes in negative ellipticity indicate a reduction of α-helix due to BLC aggregation. However, in presence of 200.0–750.0 μM C16C4C16Br2, the BLC regained negative ellipticity, which reached a maximum in the presence of 750.0 μM C16C4C16Br2. The structural content of BLC in response to C16C4C16Br2 surfactant was calculated using the K2D2 method and the data are presented in Table 1. Overall, the far-UV CD results suggest that low concentrations of C16C4C16Br2 stimulate the aggregation of BLC and reduce α-helicity, while higher concentrations of C16C4C16Br2 provoked a regain in α-helicity.| S. no. | Conditions | % α-helix | % β-sheet |
|---|---|---|---|
| 1 | BLC | 38.04 ± 1.00 | 10.06 ± 1.02 |
| 2 | BLC + 12.0 μM C16C4C16Br2 | 38.04 ± 1.06 | 10.06 ± 1.03 |
| 3 | BLC + 25.0 μM C16C4C16Br2 | 36.00 ± 1.16 | 15.29 ± 1.04 |
| 4 | BLC + 35.0 μM C16C4C16Br2 | 35.93 ± 1.01 | 12.19 ± 1.02 |
| 5 | BLC + 50.0 μM C16C4C16Br2 | 15.83 ± 1.15 | 31.46 ± 1.00 |
| 6 | BLC + 70.0 μM C16C4C16Br2 | 14.47 ± 1.09 | 35.07 ± 1.07 |
| 7 | BLC + 90.0 μM C16C4C16Br2 | 7.98 ± 1.40 | 58.94 ± 1.23 |
| 8 | BLC + 200.0 μM C16C4C16Br2 | 30.60 ± 1.50 | 12.77 ± 1.25 |
| 9 | BLC + 500.0 μM C16C4C16Br2 | 35.86 ± 1.43 | 11.33 ± 1.72 |
| 10 | BLC + 750.0 μM C16C4C16Br2 | 37.33 ± 1.85 | 10.06 ± 1.65 |
Fibril morphology investigated by TEM
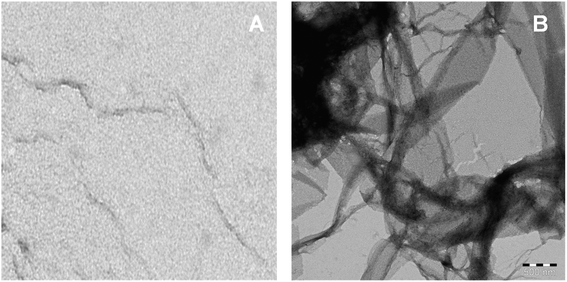
The imaging techniques was used to verify our spectroscopic results, the morphology of C16C4C16Br2-induced BLC aggregates was examined by TEM microscopy. The electron microscopy images of BLC without and with C16C4C16Br2 are reported in Fig. 5. BLC without C16C4C16Br2 displayed no fibril structure. However, BLC with 90.0 μM C16C4C16Br2 showed a typical long unbranched amyloid fibrils structure. The TEM images confirm that BLC forms a well-defined amyloid-like structure.Analysis of molecular docking between BLC and C16C4C16Br2 surfactant
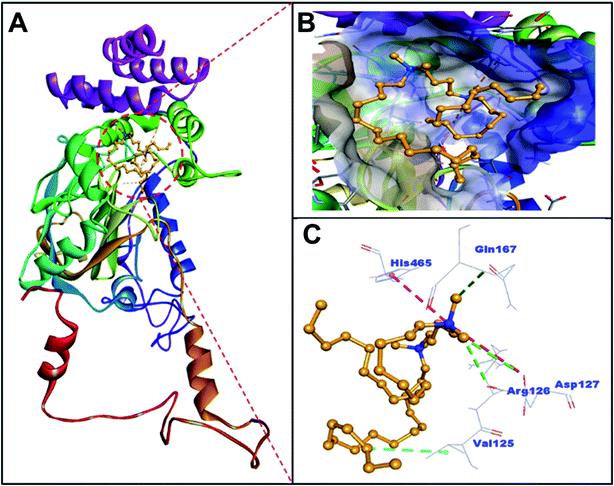
BLC is a dumbbell-shaped tetramer of identical monomers comprised of 506 amino acid residues, and contains a heme and NADH binding sites.37 Each monomer is composed of four domains I–IV spanning through amino acid residues 1–75, 76–320, 321–436 and 437–506 respectively.38 The heme moiety of BLC is located in domain II, which is also the largest domain of BLC. Notably, the surface of BLC is composed of domain IV along with three α-helices of the heme-containing domain II.39,40 In this study, the analysis of molecular docking between C16C4C16Br2 and BLC suggested that C16C4C16Br2 bound to domain II but away from the heme and NADPH binding sites (Fig. 6 and Table 2). Primarily, C16C4C16Br2 interacts with BLC through electrostatic interactions (attractive type with Asp127 and Pi-cation type with His465), carbon–hydrogen bonding (Arg126, Asp127, and Gln167), and hydrophobic interaction (alkyl type with Val125). In addition, BLC and C16C4C16Br2 formed many van der Waals' interactions with residues Ser121, Ala122, Thr124, Lys176, Pro178, Trp185, Phe199, Val246, Ala249, Ala250, Ala253, and Asn461 (Fig. 7 and Table 2). The docking energy and the corresponding docking affinity of C16C4C16Br2 towards BLC were predicted to be −5.5 kcal mol−1 and 1.08 × 10⁴ M−1 respectively (Table 2).| Type of interactions | Docking energy (kcal mol−1) | Docking affinity, Kd (M−1) | |||
|---|---|---|---|---|---|
| Hydrophobic interactionsa | Electrostatic interactionsa | Carbon–hydrogen bondinga | van der Waals' interactions | ||
| a Distance is given in the parentheses. | |||||
| Lig:C–Val125 (4.2906 Å) | Lig:N–Asp127:Oδ1 (5.1834 Å), Lig:N–His465 (4.7715 Å) | Lig:C–Arg126:O (3.7769 Å) | Ser121 | −5.5 | 1.08 × 10⁴ |
| Ala122 | |||||
| Thr124 | |||||
| Lys176 | |||||
| Lig:C–Asp127:Oδ1 (3.7634 Å) | Pro178 | ||||
| Trp185 | |||||
| Phe199 | |||||
| Val246 | |||||
| Lig:C–Gln167:Oε1 (3.6315 Å) | Ala249 | ||||
| Ala250 | |||||
| Ala253 | |||||
| Asn461 | |||||
Analysis of molecular dynamics simulation
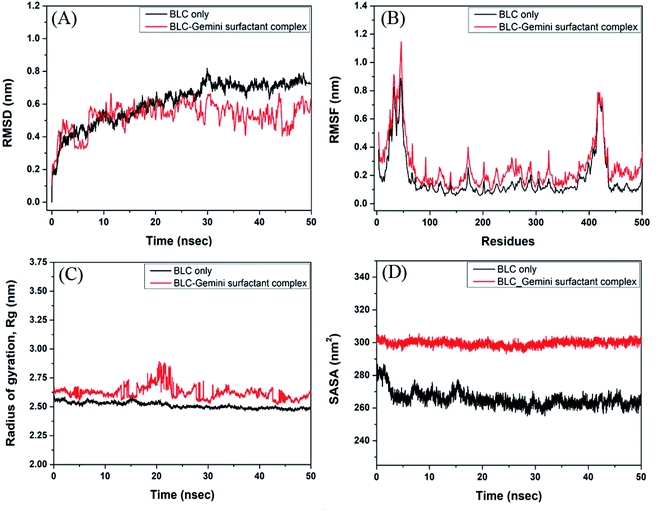
The stability and dynamics of BLC–C16C4C16Br2 complex were evaluated by performing molecular dynamics simulation for 50 ns (Fig. 7). Root mean square deviation (RMSD) is a measure of deviation in the structure of the protein–ligand complex from the initial from, throughout the simulation. Here, we have determined the RMSD across Cα-atoms of BLC in the absence and presence of C16C4C16Br2. In Fig. 7A, it is apparent that the RMSD of BLC alone initially, and stabilizes after 30 ns of simulation. Conversely, the RMSD of BLC and C16C4C16Br2 complex remains constant during 10–50 ns of simulation time, thereby indicating the formation of a stable complex. The average RMSD values of BLC in the absence and presence of C16C4C16Br2 were estimated to be 0.66 and 0.55 nm, respectively, which are within the acceptable limit of 0.2 nm.Root mean square fluctuation (RMSF) is a measure of protein's flexibility due to the movement of the protein's side chains. Here, we estimated the flexibility and rigidity of BLC's amino acid residues in the absence and presence of C16C4C16Br2 by measuring the RMSF of Cα-atoms during 50 ns simulation. As shown in Fig. 7B, the average RMSF values of BLC and the BLC–C16C4C16Br2 complex were 0.18 and 0.27 nm respectively. The most fluctuating regions of native BLC protein and BLC–C16C4C16Br2 complex are two loop regions present at the N- and C-terminal ends (residues 19–25 and 366–439 respectively). Overall, these results indicate that C16C4C16Br2 forms a stable complex with BLC.
The radius of gyration (Rg) measures the overall compactness of a protein upon ligand binding and during the simulation. Analyses of Rg also reveal the folding pattern, stability, and conformational changes in protein due to ligand binding. Here, we monitored the Rg of BLC and the BLC–C16C4C16Br2 complex as a function of simulation time (Fig. 7C). The average Rg values of BLC alone or in complex with C16C4C16Br2 were estimated to be 2.51 and 2.62 nm, respectively. A slight increase in the Rg of the BLC–C16C4C16Br2 complex indicates that the binding of C16C4C16Br2 resulted in a partial loss of BLC compactness measures the exposure of amino acid residues to the solvent as a result of ligand binding. Here, we monitored the SASA of BLC alone or the BLC–C16C4C16Br2 complex throughout simulation time (Fig. 7D). We found that the SASA of BLC and the BLC–C16C4C16Br2 complex remained constant throughout the simulation, with average values of 265.4 and 299.66 nm2, respectively. A slight increase in the SASA of C16C4C16Br2-bound BLC indicates that the protein is partially exposed to the surrounding solvent molecules.
Cytotoxicity results
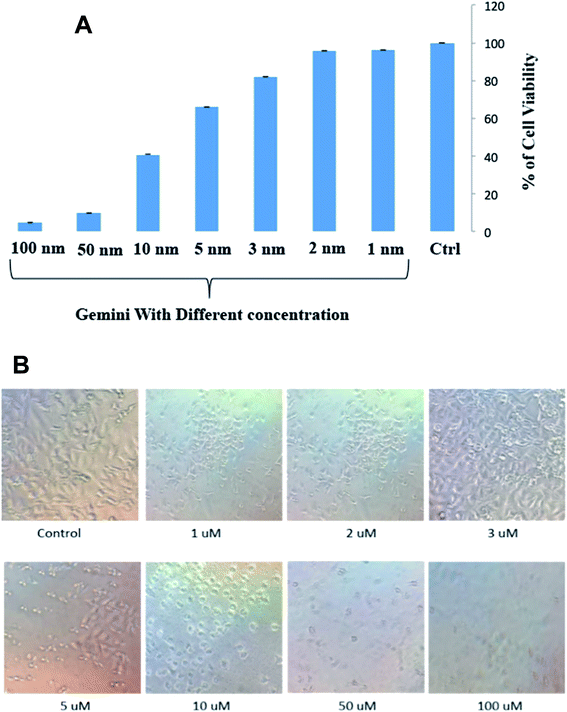
C16C4C16Br2 was performed on A549 cells using an MTT assay. The histogram of cell survival versus the different concentrations of C16C4C16Br2 is presented in Fig. 8A.The strong cytotoxicity of C16C4C16Br2 against A549 cells was observed from the concentration of 10 μM and most of the cell is died and morphology is changed within 3.5 h of incubation at 37 °C shown in Fig. 8A and B. However, the cells were remained healthy and survived in the presence of low concentrations (1–3 μM) of C16C4C16Br2 and the morphology of cell is unchanged. The non-polar and polar parts of the surfactant interact with the lipid bilayer and form holes in the cell surface, which leads to the leakage of cytoplasmic constituents and eventually to cell destruction.41–43
Discussion
Surfactants generally interact with proteins through electrostatic and hydrophobic interactions and cause conformational changes which can result in protein aggregation and unfolding.44 Common surfactants such as SDS, cetyltrimethylammonium bromide (CTAB), and TX-100 stimulate amyloid fibril formation.45 SDS is highly used to induce amyloid fibril formation but cationic surfactant-induced amyloid fibrillation is less studied.46 Cationic gemini surfactants have two positively charged head groups and two hydrophobic tails but their amyloid inducing property is less reported. There are few reports about the modulation of amyloid fibrillogenesis in Aβ (1–40) peptide by a positively charged gemini surfactant.47 The two cationic gemini surfactants with the same charge on head and similar tail lengths but linked with different carbon chain spacer i.e., C5 and C6 (C5 and C6) are found to stimulate amyloidosis in concanavalin A, but the C6 spacer gemini surfactant induces bigger size aggregates compared to the C5 gemini surfactant.25In this study, we have extensively explored the effect of cationic gemini surfactant C16C4C16Br2 on BLC protein fibrillation by exploiting different spectroscopic and computational techniques and the cytotoxicity effect of gemini was also explored. The RLS results suggest that BLC form aggregates in the presence of low concentrations of C16C4C16Br2 surfactant (2–150.0 μM). However, concentrations above than 150.0 μM cause a slight decrease in aggregation. The RLS results suggest that the C16C4C16Br2 surfactant induces lower sizes aggregates in the presence of lower C16C4C16Br2 concentrations at and as the concentrations of C16C4C16Br2 surfactant increases, the size of BLC aggregation is also increased. Similar RLS pattern was reported for SDS and CTAB is inducing aggregation induction in hen egg white egg-white lysozyme.48 Tertiary structure modification of BLC in the presence of C16C4C16Br2 was also characterized. The fluorescence intensity of BLC dropped significantly in the presence of low concentrations of C16C4C16Br2, indicating aggregation of BLC. The possible cause for the decrease in fluorescence intensity is the movement of tryptophan residues into a more hydrophobic environment. The fluorescence intensity increased along with a red shift in wavelength maximum observed in the presence of slightly higher C16C4C16Br2 concentrations. The increase in fluorescence intensity and red shift in wavelength maximum is attributed to the tryptophan residues of BLC, which become exposed to a polar environment because of the unfolding of the tertiary structure. The fluorescence intensity of BSA was reduced in the presence of C16C4C16Br2.49 The nature of BLC aggregates was also characterized by ThT dye binding. ThT binding is used to distinguish the nature of protein aggregates. C16C4C16Br2-induced BLC aggregates displayed a huge increase in ThT fluorescence intensity, confirming the amyloid structure of BLC aggregates. In a previous report, the ThT fluorescence intensity at 485 nm significantly increased because of the formation of amyloid fibril when HSA was treated with 60% (v/v) ethanol and heated at 65 °C for 6 h.50 The secondary structural conversion and TEM imaging data also support that C16C4C16Br2-induced aggregates have a well-defined amyloid structure. The α-helical structure of proteins turn to β-structures (β-sheeted and cross β-sheet) and random coils when proteins form aggregates or amyloid fibril structure.51 An interesting secondary structural transformation was also observed when C16C4C16Br2 and BLC interacted. The α-helical structure of BLC decreased in the presence of low C16C4C16Br2 concentrations but increased in the presence of non-aggregating C16C4C16Br2 concentrations as shown in Table 1. This observation confirmed that low concentrations of C16C4C16Br2 surfactant induce amyloid fibrillation in BLC while higher concentrations change the BLC conformation. The spectroscopic results were supported by the in silico computational observation that C16C4C16Br2 interact with BLC through hydrophobic and electrostatic forces, and thus perturbs its dynamics with solvent molecules. The results of RMSD and RMSF suggest that the interaction between C16C4C16Br2 and BLC was stable in nature. Conversely, the results of Rg and SASA indicate that BLC undergoes a partial unfolding when binding to C16C4C16Br2.
The cytotoxicity data suggest that C16C4C16Br2 surfactant at low concentrations causes cytotoxicity in the cancerous cell line (A549). The imaging techniques result suggests that the morphology of the cancerous cell was significantly changed in the presence of the C16C4C16Br2 surfactant. The possible reason for the toxicity of the C16C4C16Br2 surfactant is due to higher hydrophobicity and presence of positively charged heads. The electrostatic interactions occurred between cationic head of the gemini surfactant and the negatively charged centers of the plasma membrane. The electrostatic and hydrophobicity interactions of the gemini surfactant destabilize the integrity of the plasma membrane which leads to the leaking and death of the cell. The antibacterial activity and cytotoxicity effect of different spacer lengths of gemini surfactant was also seen and reported that the increase in spacer length of gemini surfactant causes more antibacterial and toxicity in the cell.43
The detailed mechanism of C16C4C16Br2 induced amyloid fibrillation is presented in Fig. 9. BLC is a folded tetramer at pH 7.4 and all the subunits are arranged in defined shape. The polar amino acids are lie on the surface of the protein. The negatively charged amino acids (aspartate and glutamate) are present in the anionic form while positively charged amino acids are neutral at pH 7.4. When adding low concentrations of C16C4C16Br2 at this pH, the positively charged head groups of C16C4C16Br2 interact with the negatively charged amino acids and perturb the BLC–solvent interaction. Consequently, hydrophobic residues of BLC become exposed to the solvent increasing hydrophobic interactions between BLC and C16C4C16Br2. The perturbation of BLC–solvent interaction is due to electrostatic interactions and increased hydrophobic interaction making a suitable environment for BLC to form amyloid fibrils. However, the amyloid fibrillation did not occur in the presence of higher concentrations of C16C4C16Br2 because the charge neutralization is unbalance. Interestingly, the secondary structure (α-helix) of BLC again regain its original form.
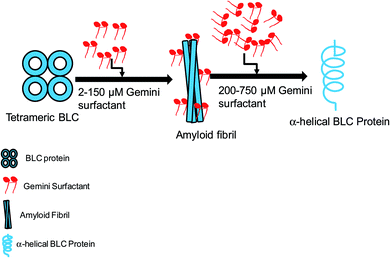 | ||
| Fig. 9 Graphical representation of C16C4C16Br2-induced amyloid fibrillation followed by conformational transition. | ||
Conclusions
This work monitored, the effect of cationic gemini surfactant C16C4C16Br2 on the fibrillogenesis and the secondary structural modification of BLC. All spectroscopic and microscopic results demonstrated that a low concentration of C16C4C16Br2 induces amyloid fibrillation of BLC. Molecular docking results suggest that the positively charged heads of C16C4C16Br2 are in close contact with the negatively charged center of the protein (Oδ1 of Asp127) through electrostatic interactions, while the hydrophobic tails of C16C4C16Br2 interacts with the hydrophobic residues of BLC (Val125). Molecular dynamics simulation also suggests that the binding of C16C4C16Br2 to BLC was stable, even though it causes a partial unfolding of BLC. These interplay of electrostatic and hydrophobic interactions between BLC and C16C4C16Br2 result in amyloid fibrillation of BLC. However, higher concentrations of C16C4C16Br2 did not cause the amyloid fibrillation because the electrostatic interaction is disturbed by the excessive availability of positive charges. The cytotoxicity of the C16C4C16Br2 surfactant was noticed in A549 cells as tested by MTT assay. The morphology of cells was changed and percent cell viability decreases with increase in the concentrations of C16C4C16Br2 surfactant. These results may help to understand the mechanism of amyloid fibrillation and start the development of reagent that perturb the electrostatic as well as hydrophobic interactions to control amyloid fibrillation.Authorship contribution
Javed Masood Khan: conceptualization, data curation, formal analysis, funding acquisition, investigation, methodology, project administration, resources, software, supervision, validation, writing – original draft, writing – review & editing. Ajamaluddin Malik: resources, formal analysis, methodology, writing – review & editing. Md Tabish Rehman: software, visualization, methodology, investigation, writing – review & editing. Mohamed F. AlAjmi: software and visualization. Mohammad Z Ahmed: formal analysis and writing – review & editing. Md. Khalid Anwer: formal analysis and writing – review & editing. Rizwan Hasan Khan: methodology, resources, supervision, writing – review & editing.Abbreviations
| BLC | Bovine liver catalase |
| DLS | Dynamic light scattering |
| TEM | Transmission electron microscopy |
| ThT | Thioflavin-T |
Conflicts of interest
The authors declare that they do not any known competing financial interests or personal relationships that could have appeared to influence the work reported in this paper.Acknowledgements
The authors extend their appreciation to the Deanship of Scientific Research at King Saud University for funding the work through the research group project no. RG-1440-099. The authors thank the Deanship of Scientific Research and RSSU at King Saud University for their technical support.References
- J. W. Kelly, Curr. Opin. Struct. Biol., 1998, 8, 101–106 CrossRef CAS.
- B. O'Nuallain, S. Shivaprasad, I. Kheterpal and R. Wetzel, Biochemistry, 2005, 44, 12709–12718 CrossRef.
- G. Wei, Z. Su, N. P. Reynolds, P. Arosio, I. W. Hamley, E. Gazit and R. Mezzenga, Chem. Soc. Rev., 2017, 46, 4661–4708 RSC.
- F. Chiti and C. M. Dobson, Nat. Chem. Biol., 2009, 5, 15–22 CrossRef CAS.
- T. P. Knowles, J. F. Smith, A. Craig, C. M. Dobson and M. E. Welland, Phys. Rev. Lett., 2006, 96, 238301 CrossRef.
- V. J. McParland, N. M. Kad, A. P. Kalverda, A. Brown, P. Kirwin-Jones, M. G. Hunter, M. Sunde and S. E. Radford, Biochemistry, 2000, 39, 8735–8746 CrossRef CAS.
- M. Hernandez, Y. Hu and J. R. Kim, Chem. Commun., 2013, 49, 10712–10714 RSC.
- Z. Jiang and J. C. Lee, J. Mol. Biol., 2014, 426, 4074–4086 CrossRef CAS.
- T. A. Pertinhez, M. Bouchard, R. A. Smith, C. M. Dobson and L. J. Smith, FEBS Lett., 2002, 529, 193–197 CrossRef CAS.
- S. Yamamoto, K. Hasegawa, I. Yamaguchi, S. Tsutsumi, J. Kardos, Y. Goto, F. Gejyo and H. Naiki, Biochemistry, 2004, 43, 11075–11082 CrossRef CAS.
- M. A. Ismael, J. M. Khan, A. Malik, M. A. Alsenaidy, S. Hidayathulla, R. H. Khan, P. Sen, M. Irfan and A. M. Alsenaidy, Colloids Surf., B, 2018, 170, 430–437 CrossRef CAS.
- T. Ookoshi, K. Hasegawa, Y. Ohhashi, H. Kimura, N. Takahashi, H. Yoshida, R. Miyazaki, Y. Goto and H. Naiki, Nephrol., Dial., Transplant., 2008, 23, 3247–3255 CrossRef CAS.
- M. Jafari and F. Mehrnejad, PLoS One, 2016, 11, e0165213 CrossRef.
- M. So, A. Ishii, Y. Hata, H. Yagi, H. Naiki and Y. Goto, Langmuir, 2015, 31, 9973–9982 CrossRef CAS.
- M. N. Jones, H. A. Skinner and E. Tipping, Biochem. J., 1975, 147, 229–234 CrossRef CAS.
- J. M. Khan, M. S. Khan, M. S. Ali, N. A. Al-Shabib and R. H. Khan, RSC Adv., 2016, 6, 38100–38111 RSC.
- M. S. Kamal, J. Surfactants Deterg., 2016, 19, 223–236 CrossRef CAS.
- M. N. Maithufi, D. J. Joubert and B. Klumperman, Energy Fuels, 2011, 25, 162–171 CrossRef CAS.
- M. T. Garcia, O. Kaczerewska, I. Ribosa, B. Brycki, P. Materna and M. Drgas, Chemosphere, 2016, 154, 155–160 CrossRef CAS.
- A. Laatiris, M. el Achouri, M. R. Infante and Y. Bensoudaa, Microbiol. Res., 2008, 163, 645–650 CrossRef CAS.
- A. R. Tehrani-Bagha, H. Oskarsson, C. G. van Ginkel and K. Holmberg, J. Colloid Interface Sci., 2007, 312, 444–452 CrossRef CAS.
- Y. Pi, Y. Shang, C. Peng, H. Liu, Y. Hu and J. Jiang, Biopolymers, 2006, 83, 243–249 CrossRef CAS.
- Kabir-ud-Din, M. A. Rub and A. Z. Naqvi, J. Phys. Chem. B, 2010, 114, 6354–6364 CrossRef CAS.
- J. M. Khan, M. S. Khan, A. Qadeer, M. A. Alsenaidy, A. Ahmed, N. A. Al-Shabib and R. H. Khan, Colloids Surf., A, 2017, 522, 494–502 CrossRef CAS.
- J. M. Khan, M. R. Khan, P. Sen, A. Malik, M. Irfan and R. H. Khan, J. Mol. Liq., 2018, 269, 796–804 CrossRef CAS.
- M. R. Murthy, T. J. Reid 3rd, A. Sicignano, N. Tanaka and M. G. Rossmann, J. Mol. Biol., 1981, 152, 465–499 CrossRef CAS.
- P. Nicholls, I. Fita and P. C. Loewen, Adv. Inorg. Chem., 2001, 51, 51–106 CrossRef CAS.
- G. O. Fruhwirth, A. Paar, M. Gudelj, A. Cavaco-Paulo, K. H. Robra and G. M. Gubitz, Appl. Microbiol. Biotechnol., 2002, 60, 313–319 CrossRef CAS.
- M. Shamsipur, M. Asgari, M. G. Maragheh and A. A. Moosavi-Movahedi, Bioelectrochemistry, 2012, 83, 31–37 CrossRef.
- K. Prakash, S. Prajapati, A. Ahmad, S. K. Jain and V. Bhakuni, Protein Sci., 2002, 11, 46–57 CrossRef CAS.
- N. A. Al-Shabib, J. M. Khan, A. Malik, M. A. Alsenaidy, M. T. Rehman, M. F. AlAjmi, A. M. Alsenaidy, F. M. Husain and R. H. Khan, J. Mol. Liq., 2018, 269, 511–520 CrossRef CAS.
- M. F. AlAjmi, M. T. Rehman, A. Hussain and G. M. Rather, Int. J. Biol. Macromol., 2018, 116, 173–181 CrossRef CAS.
- M. T. Rehman, H. Shamsi and A. U. Khan, Mol. Pharm., 2014, 11, 1785–1797 CrossRef CAS.
- M. T. Rehman, S. Ahmed and A. U. Khan, J. Biomol. Struct. Dyn., 2016, 34, 1849–1864 CrossRef CAS.
- G. J. Martyna, D. J. Tobias and M. L. Klein, J. Chem. Phys., 1994, 101, 4177–4189 CrossRef CAS.
- S. Rashtbari, G. Dehghan, R. Yekta and A. Jouyban, Bioimpacts, 2017, 7, 147–153 CrossRef CAS.
- W. Eventoff, N. Tanaka and M. G. Rossmann, J. Mol. Biol., 1976, 103, 799–801 CrossRef CAS.
- I. Fita and M. G. Rossmann, J. Mol. Biol., 1985, 185, 21–37 CrossRef CAS.
- T. J. Reid 3rd, M. R. Murthy, A. Sicignano, N. Tanaka, W. D. Musick and M. G. Rossmann, Proc. Natl. Acad. Sci. U. S. A., 1981, 78, 4767–4771 CrossRef CAS.
- B. K. Vainshtein, W. R. Melik-Adamyan, V. V. Barynin, A. A. Vagin and A. I. Grebenko, Nature, 1981, 293, 411–412 CrossRef CAS.
- B. Brycki and A. Szulc, PLoS One, 2014, 9, e84936 CrossRef.
- B. Brycki, Pol. J. Microbiol., 2010, 59, 227–231 CAS.
- S. S. Zhang, S. P. Ding, J. Yu, X. R. Chen, Q. F. Lei and W. J. Fang, Langmuir, 2015, 31, 12161–12169 CrossRef CAS.
- Y. Wang, B. Jia, M. You, H. Fan, S. Cao, H. Li, W. Zhang and G. Ma, J. Phys. Chem. B, 2019, 123, 6200–6211 CrossRef CAS.
- M. K. Siddiqi, Y. E. Shahein, N. Hussein and R. H. Khan, J. Mol. Struct., 2016, 1119, 12–17 CrossRef CAS.
- A. Abelein, J. D. Kaspersen, S. B. Nielsen, G. V. Jensen, G. Christiansen, J. S. Pedersen, J. Danielsson, D. E. Otzen and A. Graslund, J. Biol. Chem., 2013, 288, 23518–23528 CrossRef CAS.
- M. Cao, Y. Han, J. Wang and Y. Wang, J. Phys. Chem. B, 2007, 111, 13436–13443 CrossRef CAS.
- S. K. Chaturvedi, J. M. Khan, M. K. Siddiqi, P. Alam and R. H. Khan, Int. J. Biol. Macromol., 2016, 83, 315–325 CrossRef CAS.
- Y. Li, X. Wang and Y. Wang, J. Phys. Chem. B, 2006, 110, 8499–8505 CrossRef CAS.
- N. K. Pandey, S. Ghosh and S. Dasgupta, J. Phys. Chem. B, 2010, 114, 10228–10233 CrossRef CAS.
- J. Juarez, S. G. Lopez, A. Cambon, P. Taboada and V. Mosquera, J. Phys. Chem. B, 2009, 113, 10521–10529 CrossRef CAS.
| This journal is © The Royal Society of Chemistry 2020 |

