 Open Access Article
Creative Commons Attribution 3.0 Unported Licence
Green and facile sol–gel synthesis of the mesoporous SiO2–TiO2 catalyst by four different activation modes†
Héctor Péreza,
René Miranda b,
Zenaida Saavedra-Leos
 c,
Ramon Zarraga
 d,
Pedro Alonsoa,
Edgar Moctezuma
 a and
Joel Martínez
 *a
*a
aFacultad de Ciencias Químicas, Universidad Autónoma de San Luis Potosí, SLP, Mexico 78210. E-mail: atlanta126@gmail.com
bFacultad de Estudios Superiores Cuautitlán, Universidad Nacional Autónoma de México, Estado de México, Mexico 54740
cCoordinación Académica Región Altiplano, Universidad Autónoma de San Luis Potosí, Matehuala, SLP, Mexico 78700
dDepartamento de Química–DCNE, Universidad de Guanajuato, Guanajuato, Mexico 36050
First published on 29th October 2020
Abstract
The most environmentally friendly protocol for obtaining mesoporous SiO2–TiO2 catalysts has been sought. Water has been employed as a green solvent, the energy input has been minimized, and three further principles (1, 3, and 12) of Green Chemistry have been considered. Four different modes for promoting the reaction have been comparatively evaluated, namely near-infrared and microwave electromagnetic irradiations, ultrasound, and traditional mantle heating. Brunauer–Emmett–Teller (BET) analyses of the catalysts produced revealed that the non-conventional activation modes afforded both large surface areas (335–441 m2 g−1) and smaller crystal sizes (7.2–15.3 nm) than the mantle heating process. These modes also generated the catalysts in shorter reaction times than traditional mantle heating, 10–30 min versus 3 h, with anatase as the sole crystalline phase. The photocatalytic degradation of 4-chlorophenol has been carried out to assess the catalytic efficiencies of the hybrid materials. The catalyst synthesized with microwave assistance showed the best mineralization activity (97%), followed by those prepared with ultrasound, near-infrared, and mantle heating. The materials have been extensively characterized by FTIR, XRD, DRS-UV/Vis, SEM, 29Si MAS NMR, and BET analyses. To the best of our knowledge, this is the first such comparative assessment of green energetic alternatives in developing a sol–gel process.
Introduction
The sol–gel process is one of the most prevalent routes for producing oxide materials with control of their textural and surface properties, furnishing them with high purity and homogeneity.1–3 Due to their mesoporous structures, oxide materials are important in many industrial processes, for example as catalysts,4 absorbents,5 gas sensors,6 and photocatalysts.7 Established methods involve both the hydrolysis and polycondensation of metal alkoxides, producing homogeneous oxides at lower temperatures.3 The SiO2–TiO2 system has interesting applications as a photocatalyst, facilitating the elimination of several pollutants from water.7Previously reported approaches for the production of SiO2–TiO2 hybrid catalysts are associated with several eco-disadvantages, arising from the use of slightly toxic organic or hazardous inorganic acids, such as HOAc,8–10 HCl and H2SO4,9 or HF,11 and the requirement for auxiliary substances, such as 2-methoxyethanol,2 ethanol,8 n-propanol,12 and ammonia solution.10 Moreover, these procedures generally involve long reaction times, in addition to extended drying and aging times,8–12 and sometimes require supercritical conditions.10
On the other hand, Green Chemistry is a working paradigm at the molecular level aimed at sustainability;13 this guiding mode to chemical production has a protocol of Twelve Principles.14 In this regard, researchers strive to design chemicals and chemical manufacturing processes that pose insignificant risk to human health and the environment, although it must be conceded that no activity is risk-free.15
As part of our research program, we are interested in the implementation of green procedures, mainly using non-conventional activation methods, such as near-infrared (NIR) and microwave (MW) irradiations or ultrasound (US).16 Consequently, the goal of this work is the achievement of a green approach17 for the production of SiO2–TiO2 catalysts, comparing four different modes for activating the reaction, namely NIR, MW, US, and traditional mantle heating (MH), applying various principles of the Green Chemistry protocol. To the best of our knowledge, this is the first report comparing the efficacies of these activation modes in generating the target materials.
Results and discussion
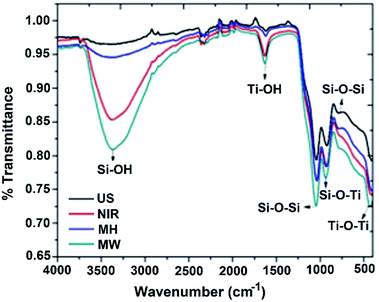
Fourier-transform infrared spectroscopy (FTIR)
The infrared spectra of the target materials, taking the 1![[thin space (1/6-em)]](https://www.rsc.org/images/entities/char_2009.gif) :
:![[thin space (1/6-em)]](https://www.rsc.org/images/entities/char_2009.gif) 1 molar ratio catalysts as representative examples, are presented in Fig. 1. Data for the other molar compositions are summarized in Table S1.†
1 molar ratio catalysts as representative examples, are presented in Fig. 1. Data for the other molar compositions are summarized in Table S1.†
The bands in the ranges 1057–1039 and 806–795 cm−1 can be assigned to symmetric and asymmetric stretching vibrations, respectively, of Si–O–Si bonds. Bands at 931–919 cm−1 can be attributed to a stretching vibration of Si–O–Ti bonds, and the broad bands in the range 432–410 cm−1 can be assigned to symmetric stretching vibrations of Ti–O–Ti units. Intense broad bands in the range 3379–3326 cm−1 correspond to the hydroxyl group of the silanol moiety and, complementarily, bands in the range 1636–1617 cm−1 can be attributed to a bending mode of this hydroxyl group.
It should be borne in mind that titania strongly retains adsorbed undissociated water due to the strong Lewis acidity of its coordinatively unsaturated Ti4+ surface sites.18 Considering the intensities of the bands assigned to the Si–OH moiety (3379–3326 cm−1) in Fig. 1, an intense broad band is seen for the sample prepared by the MW method, indicating a catalyst with higher surface area and higher titania content in comparison to those prepared with NIR, US, or MH assistance, respectively. The bands of lower intensity may be explained in terms of a deficit of titania on the surfaces of the materials. Considering a 1![[thin space (1/6-em)]](https://www.rsc.org/images/entities/char_2009.gif) :
:![[thin space (1/6-em)]](https://www.rsc.org/images/entities/char_2009.gif) 4 catalyst molar ratio for all four methods (Fig. S1a†), the principal differences were observed for the broad and intense Ti–O–Ti band. In addition, the Si–OH band was more intense for the samples prepared with MW and NIR assistance; less intense bands for those prepared with US and MH were probably due to a lower titania content, and hence, less retention of undissociated water. For a 4
4 catalyst molar ratio for all four methods (Fig. S1a†), the principal differences were observed for the broad and intense Ti–O–Ti band. In addition, the Si–OH band was more intense for the samples prepared with MW and NIR assistance; less intense bands for those prepared with US and MH were probably due to a lower titania content, and hence, less retention of undissociated water. For a 4![[thin space (1/6-em)]](https://www.rsc.org/images/entities/char_2009.gif) :
:![[thin space (1/6-em)]](https://www.rsc.org/images/entities/char_2009.gif) 1 catalyst molar ratio (Fig. S1b†), the Ti–O–Ti band was less well-defined for all of the samples. The Si–OH bands were slightly less intense compared to the other molar ratios, probably because the higher silica content and lower titania content resulted in less undissociated water on the surface. In summary, the FTIR spectral data are consistent with the proposed compositions of the SiO2–TiO2 mixed-oxide catalysts.
1 catalyst molar ratio (Fig. S1b†), the Ti–O–Ti band was less well-defined for all of the samples. The Si–OH bands were slightly less intense compared to the other molar ratios, probably because the higher silica content and lower titania content resulted in less undissociated water on the surface. In summary, the FTIR spectral data are consistent with the proposed compositions of the SiO2–TiO2 mixed-oxide catalysts.
X-ray diffraction (XRD)
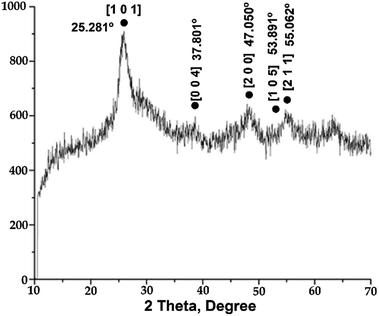
The diffraction patterns of the prepared catalysts reflect their amorphous nature. The expected signals of the silica component were not visible, implying that it exists in an amorphous state.19 Moreover, the signals of the anatase TiO2 crystalline phase were not well defined due to the high content of silica in the network, causing signal overlap (Fig. 2). Greater intensity of the peaks assigned to the anatase phase indicates that more titania is deposited on the silica surface.11 For the 4![[thin space (1/6-em)]](https://www.rsc.org/images/entities/char_2009.gif) :
:![[thin space (1/6-em)]](https://www.rsc.org/images/entities/char_2009.gif) 1 and 1
1 and 1![[thin space (1/6-em)]](https://www.rsc.org/images/entities/char_2009.gif) :
:![[thin space (1/6-em)]](https://www.rsc.org/images/entities/char_2009.gif) 1 SiO2–TiO2 molar ratios (Fig. S2†), the diffraction patterns were similar. That is to say, because of the amorphous nature of the silica, it was difficult to detect the diffraction peaks of titania due to signal overlap. Specifically, at the 1
1 SiO2–TiO2 molar ratios (Fig. S2†), the diffraction patterns were similar. That is to say, because of the amorphous nature of the silica, it was difficult to detect the diffraction peaks of titania due to signal overlap. Specifically, at the 1![[thin space (1/6-em)]](https://www.rsc.org/images/entities/char_2009.gif) :
:![[thin space (1/6-em)]](https://www.rsc.org/images/entities/char_2009.gif) 1 molar ratio, the peaks at 25.281 and 47.050° were at their least intense (Fig. S2a†); at the 4
1 molar ratio, the peaks at 25.281 and 47.050° were at their least intense (Fig. S2a†); at the 4![[thin space (1/6-em)]](https://www.rsc.org/images/entities/char_2009.gif) :
:![[thin space (1/6-em)]](https://www.rsc.org/images/entities/char_2009.gif) 1 molar ratio, only a very broad diffraction peak at 25.281° could be discerned.
1 molar ratio, only a very broad diffraction peak at 25.281° could be discerned.
Evidently, the addition of silica significantly influences the phase transition of titania, inhibiting formation of the crystalline rutile phase. On the other hand, the calcination process improves the crystallinity of the sample. Thus, the obtained results imply a better atomic structure between TiO2 and SiO2, inhibiting the rutile phase transformation and increasing polycrystallization. This may be ascribed to the formation of strong Ti–O–Si bonds, diminishing the crystal size. Consequently, these materials have high thermal stability, allowing their calcination at 500 °C without formation of the rutile phase.20
Differential reflectance spectroscopy-UV/Vis (DRS-UV/Vis)
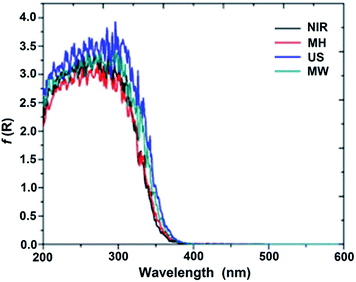
According to the DRS-UV/Vis spectral data summarized in Table S2,† the absorption edge of SiO2–TiO2 appears in the UV region. Evidently, the wavelength values were not noticeably modified in comparison to that for TiO2 (3.2 eV).Band gaps for all of the SiO2–TiO2 hybrid catalysts were calculated by the Kubelka–Munk21 method (Fig. 3), and proved to be proportional to the absorptions of the samples.8 The obtained results illustrate that the shift in the absorption edge for the SiO2–TiO2 catalyst depends on the synthetic method, the nature of the precursors, and the calcination temperature of the sample.22
According to the above observations, the catalysts prepared with MW and US assistance show slightly stronger absorptions, and hence smaller band gaps, compared to those prepared by the NIR and MH methods. This absorption may be associated with the charge-transfer transition between the constituent atoms titania and the higher content of titania on the surface of the network.8 Good mineralization of 4-chlorophenol is achieved due to the convenient crystal size of the composites; see below. As shown in Fig. S3a,† the catalyst with a 1![[thin space (1/6-em)]](https://www.rsc.org/images/entities/char_2009.gif) :
:![[thin space (1/6-em)]](https://www.rsc.org/images/entities/char_2009.gif) 4 molar ratio showed similar behavior to that with a 1
4 molar ratio showed similar behavior to that with a 1![[thin space (1/6-em)]](https://www.rsc.org/images/entities/char_2009.gif) :
:![[thin space (1/6-em)]](https://www.rsc.org/images/entities/char_2009.gif) 1 molar ratio. For the catalyst with a 4
1 molar ratio. For the catalyst with a 4![[thin space (1/6-em)]](https://www.rsc.org/images/entities/char_2009.gif) :
:![[thin space (1/6-em)]](https://www.rsc.org/images/entities/char_2009.gif) 1 molar ratio, higher absorption of the US was observed, due to the greater charge-transfer transition between the atoms of titania, possibly due to small spherical agglomerates thereof. The band gaps were higher than that for TiO2.
1 molar ratio, higher absorption of the US was observed, due to the greater charge-transfer transition between the atoms of titania, possibly due to small spherical agglomerates thereof. The band gaps were higher than that for TiO2.
Brunauer–Emmett–Teller analysis (BET)
The adsorption–desorption isotherms of the SiO2–TiO2 catalysts were seen to be of type IV, characteristic of agglomerated mesoporous materials, according to the Brunauer–Demming–Demming–Teller (BDDT) classification.23 According to IUPAC classification, a clear H3-type hysteresis loop was detected, which is related to the occurrence of pore condensation. The first part of the sorption isotherm is associated with weak interactions between the adsorbent and the adsorbate. An H3-type hysteresis loop is the most common for inorganic oxides, often associated with a mesoporous material consisting of channels of cylindrical pores or agglomerates of non-uniform spherical particles.24The specific surface areas calculated using the multi-point BET method, the average pore diameters (Barrett–Joyner–Halenda (BJH) method), and the total pore volumes are provided in Table 1. The differences in crystal sizes and surface areas between the samples can be explained by considering the production modes, since the extent of polymerization is dependent on the number of moles of water added to the alkoxide. An increase in H2O/alkoxide ratio increased the BET surface area. The extent of cross-linking determines the degree of polymerization.25 Accordingly, a higher H2O/alkoxide ratio was used, resulting in smaller crystal sizes and a higher BET surface area.
![[thin space (1/6-em)]](https://www.rsc.org/images/entities/char_2009.gif) :
:![[thin space (1/6-em)]](https://www.rsc.org/images/entities/char_2009.gif) 1) catalyst
1) catalyst
| Properties | NIR | MW | US | MH |
|---|---|---|---|---|
| Area (m2 g−1) | 335 | 441 | 417 | 408 |
| Pore size (nm) | 4.33 | 5.57 | 4.78 | 2.77 |
| Pore volume (cm3 g−1) | 0.363 | 0.585 | 0.527 | 0.290 |
| Crystal size (nm) | 15.3 | 7.2 | 7.9 | 8.5 |
| Mineralization (%) | 70 | 97 | 91 | 54 |
The best physical properties were obtained by the MW procedure, which may be attributed to better physical behavior of the mixture reaction in terms of mass transfer and diffusion. Inferior physical properties were obtained by the MH method, due to slow diffusion and mass transfer in the reaction mixture. For the NIR method, the surface area was probably reduced by partial evaporation of water from the reaction mixture.
Chemical synthesis
As mentioned above, after an extensive search of the literature,12,13,26,27 we believe this to be the first report concerning comparison of the various activation methods in the production of such mixed-oxide catalysts.Regarding the use of MH, it should be borne in mind that heat is carried out by conduction from the source to the reaction mixture. Consequently, a long reaction time is required for the hydrolysis. Moreover, the obtained composites have good surface area, but small particle size and low pore volume.
For activation by NIR radiation, it must be taken into account that this mode induces vibrations of the chemical bonds of the molecules (stretching, bending, rocking, and twisting), matching the absorption characteristics of both the solvent and the reagents. Thus, NIR is absorbed by the mixture, producing the essential heat to promote the reaction.13 This process provided the target catalysts with lower surface area (335 m2 g−1). Consequently, the hydrolysis process was affected; however, both the pore diameter and volume were improved in comparison to the MH process.
As regards US activation of the reaction, the obtained results can only be attributed to cavitation effects inside micro drops of solvent, decreasing the diffusion layer and mass transfer.28 The energy input is sufficient to initiate nucleation, leading to growth of a three-dimensional network. However, application of a mechanical force can induce breaking of the network, leading to agglomeration of the material with concomitant decreases in both surface area and pore size.
In the case of MW assistance, activation is favored by the polarity of the reaction medium, due to the capability (tan![[thin space (1/6-em)]](https://www.rsc.org/images/entities/char_2009.gif) δ) of several compounds (mainly solvents) to transform electromagnetic energy into heat.29 Thus, the solvent transmits heat to the reagents, in the present case promoting hydrolysis and polymerization. In other words, the quantity of heat transferred enhances the reaction rates, generating the network in a conveniently short time, with large surface area and pores of optimal size and volume. As a general important result, in this work, the NIR and MW processes must be considered as the best options for producing this type of catalyst, because they afford the products in a shorter time than the MH method.
δ) of several compounds (mainly solvents) to transform electromagnetic energy into heat.29 Thus, the solvent transmits heat to the reagents, in the present case promoting hydrolysis and polymerization. In other words, the quantity of heat transferred enhances the reaction rates, generating the network in a conveniently short time, with large surface area and pores of optimal size and volume. As a general important result, in this work, the NIR and MW processes must be considered as the best options for producing this type of catalyst, because they afford the products in a shorter time than the MH method.
It is important to highlight that the abovementioned features are in full compliance with the green chemistry protocol (GCP).14
Firstly, the by-products of the reaction, ethanol derived from tetraethylorthosilicate (TEOS) and n-butanol derived from tetrabutylorthotitanate (TBOT), are both slightly toxic, but are biodegradable according to the Toxic Release Inventory of the Environmental Protection Agency (TRI-EPA).30 These features conform to three of the principles of the GCP: principle one (prevention), three (less hazardous chemical synthesis), and ten (degradation).
Secondly, we note that in previous reports concerning the production of SiO2–TiO2, the use of HCl, HF, or H2SO4 was described,8–12 all of which are highly toxic according to the TRI-EPA. In this work, these substances were avoided, conforming to two principles of the GCP: three (less hazardous chemical synthesis) and twelve (inherently safer chemistry for accident prevention). As regards principle five (safer solvents and auxiliaries), the described procedure represents a good green approach since the solvent employed, water, is considered as one of the greenest solvents. Finally, as regards principle six (design for energy efficiency), greener novel modes (NIR, US, MW) for activating the reaction are offered as better alternatives to traditional MH.
Field-emission scanning electron microscopy (FE-SEM)
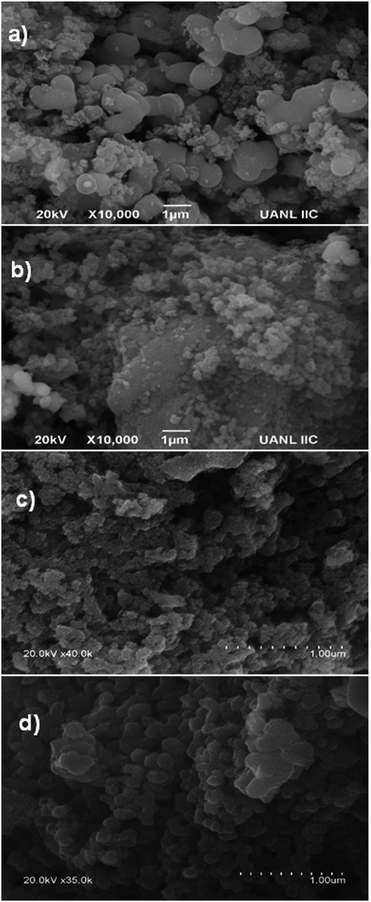
As can be seen in Fig. 4a, for the sample with a 1![[thin space (1/6-em)]](https://www.rsc.org/images/entities/char_2009.gif) :
:![[thin space (1/6-em)]](https://www.rsc.org/images/entities/char_2009.gif) 1 molar ratio, the FE-SEM image shows that the catalyst produced by means of MH was composed of uniform spherical micro aggregates of TiO2 with a rough external surface, together with irregular spheres of SiO2. The obtained low surface area (Table 1) can probably be ascribed to weak interactions between SiO2 and TiO2 and less dissolution of Si and Ti in the reaction mixture.
1 molar ratio, the FE-SEM image shows that the catalyst produced by means of MH was composed of uniform spherical micro aggregates of TiO2 with a rough external surface, together with irregular spheres of SiO2. The obtained low surface area (Table 1) can probably be ascribed to weak interactions between SiO2 and TiO2 and less dissolution of Si and Ti in the reaction mixture.
Concerning the employment of US as the activation procedure (Fig. 4b), a rough external surface is observed, composed of irregular spheres of SiO2 and small spherical agglomerates of TiO2. Irregular large crystals of SiO2 can also be observed, which probably arose from cavitation bubbles acting as nuclei and initiators of seeding.26,28 Moreover, collapse of the bubbles could lead to agglomeration of both kinds of particles, favoring the growth of many larger particles (vide supra). A poor stirring effect could delay diffusion across the layer, diminishing mass transfer.
Regarding the products from the employment of NIR and MW as activation procedures (as shown in Fig. 4c and d, respectively), they are composed of small uniform spherical particles of TiO2 together with more regular uniform spheres of SiO2. It is important to highlight that with these electromagnetic irradiations, the activation energy constitutes an excellent indicator of the improvement of the reaction.13,29 It has also been reported that the electric components of these irradiations exert vibrational and orientational effects, modifying the activation energy term in the Arrhenius equation and improving the process.31 These heating modes are fundamentally different from conventional heating since the electromagnetic radiations interact directly with the reagents, leading to efficient energy transfer at the molecular level, improving the dissolution and interaction of Si and Ti in the reaction mixture, resulting in faster formation of abundant nuclei and hence a shorter nucleation period. On the contrary, conventional heating is transmitted by conduction to the interior of the sample and is strongly dependent on efficient stirring to facilitate the distribution of heat.29,31b In other words, with the employment of NIR and MW as activation modes, more nuclei are formed in the mixture; thus, small crystals are formed, producing aggregates composed of smaller particles.
On the other hand, thermal stability is an essential prerequisite in many potential applications of nanomaterials, but conventionally produced titania nanoparticles exhibit low thermal stability.32,33 By the proposed process, it is possible to achieve a large BET surface area, thereby decreasing the crystal size and the crystallization time. The XRD, SEM, and BET surface area results presented herein imply good thermal stability, which we ascribe to strong interactions between SiO2 and TiO2.
29Si magic angle spinning nuclear magnetic resonance (29Si MAS NMR)
Fig. 5 shows representative 29Si MAS NMR for the 1![[thin space (1/6-em)]](https://www.rsc.org/images/entities/char_2009.gif) :
:![[thin space (1/6-em)]](https://www.rsc.org/images/entities/char_2009.gif) 1, 1
1, 1![[thin space (1/6-em)]](https://www.rsc.org/images/entities/char_2009.gif) :
:![[thin space (1/6-em)]](https://www.rsc.org/images/entities/char_2009.gif) 4, and 4
4, and 4![[thin space (1/6-em)]](https://www.rsc.org/images/entities/char_2009.gif) :
:![[thin space (1/6-em)]](https://www.rsc.org/images/entities/char_2009.gif) 1 composites generated with the assistance of NIR, US, and MW, respectively. After peak deconvolution, three signals were observed at δ = −92, −100, and −109 ppm with different intensities. Each of the signals represents a specific degree of polymerization; Q denotes a silicon atom center and the superscripts 2, 3, and 4 indicate the number of Si–O–Si bridges connected to Q. The signals at δ = −92, −100, and −109 ppm correspond to Si sites in Q2, Q3, and Q4 configurations, respectively. Thus, the respective signals correspond to one, two, or no OTi groups35 around each Si atom.
1 composites generated with the assistance of NIR, US, and MW, respectively. After peak deconvolution, three signals were observed at δ = −92, −100, and −109 ppm with different intensities. Each of the signals represents a specific degree of polymerization; Q denotes a silicon atom center and the superscripts 2, 3, and 4 indicate the number of Si–O–Si bridges connected to Q. The signals at δ = −92, −100, and −109 ppm correspond to Si sites in Q2, Q3, and Q4 configurations, respectively. Thus, the respective signals correspond to one, two, or no OTi groups35 around each Si atom.
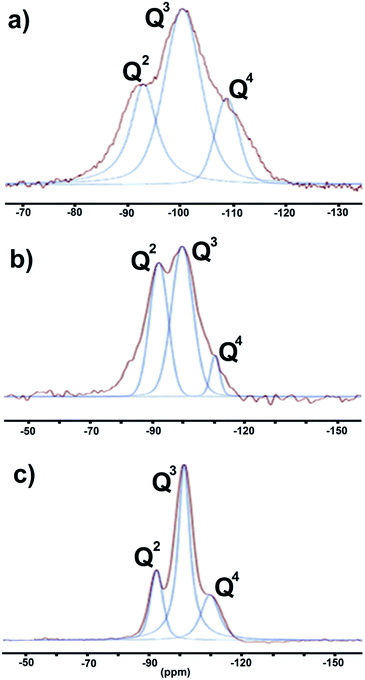 | ||
Fig. 5 The 29Si MAS NMR-deconvolution spectra: (a) SiO2–TiO2 (1![[thin space (1/6-em)]](https://www.rsc.org/images/entities/char_2009.gif) : :![[thin space (1/6-em)]](https://www.rsc.org/images/entities/char_2009.gif) 1), (b) SiO2–TiO2 (1 1), (b) SiO2–TiO2 (1![[thin space (1/6-em)]](https://www.rsc.org/images/entities/char_2009.gif) : :![[thin space (1/6-em)]](https://www.rsc.org/images/entities/char_2009.gif) 4), (c) SiO2–TiO2 (4 4), (c) SiO2–TiO2 (4![[thin space (1/6-em)]](https://www.rsc.org/images/entities/char_2009.gif) : :![[thin space (1/6-em)]](https://www.rsc.org/images/entities/char_2009.gif) 1). 1). | ||
The proportions of the different Si species were estimated from the integrated areas of their peaks (Table 2). For the 1![[thin space (1/6-em)]](https://www.rsc.org/images/entities/char_2009.gif) :
:![[thin space (1/6-em)]](https://www.rsc.org/images/entities/char_2009.gif) 1 catalyst, the content of Q3 (48%) was approximately twice those of Q2 (27%) and Q4 (23%). For the 1
1 catalyst, the content of Q3 (48%) was approximately twice those of Q2 (27%) and Q4 (23%). For the 1![[thin space (1/6-em)]](https://www.rsc.org/images/entities/char_2009.gif) :
:![[thin space (1/6-em)]](https://www.rsc.org/images/entities/char_2009.gif) 4 catalyst, the proportions of Q2, Q3, and Q4 were 40%, 51%, and 8%, respectively, and for the 4
4 catalyst, the proportions of Q2, Q3, and Q4 were 40%, 51%, and 8%, respectively, and for the 4![[thin space (1/6-em)]](https://www.rsc.org/images/entities/char_2009.gif) :
:![[thin space (1/6-em)]](https://www.rsc.org/images/entities/char_2009.gif) 1 catalyst they were 19%, 61%, and 18%, respectively, indicating that Q4 sites accounted for only a small fraction of the Si–O–Si tetrahedra. Consequently, the majority of Si nuclei are surrounded by OTi or OH groups, implying a high degree of titanium substitution in the silica network, that is, extensive formation of Si–O–Ti and Si–OH bonds.34 In order to more accurately assess the number of Si–O–Si bonds, we employed the AFQ parameter,23,36 calculated according to the following equation:
1 catalyst they were 19%, 61%, and 18%, respectively, indicating that Q4 sites accounted for only a small fraction of the Si–O–Si tetrahedra. Consequently, the majority of Si nuclei are surrounded by OTi or OH groups, implying a high degree of titanium substitution in the silica network, that is, extensive formation of Si–O–Ti and Si–OH bonds.34 In order to more accurately assess the number of Si–O–Si bonds, we employed the AFQ parameter,23,36 calculated according to the following equation:
![[thin space (1/6-em)]](https://www.rsc.org/images/entities/char_2009.gif) :
:![[thin space (1/6-em)]](https://www.rsc.org/images/entities/char_2009.gif) 1, 1
1, 1![[thin space (1/6-em)]](https://www.rsc.org/images/entities/char_2009.gif) :
:![[thin space (1/6-em)]](https://www.rsc.org/images/entities/char_2009.gif) 4, and 4
4, and 4![[thin space (1/6-em)]](https://www.rsc.org/images/entities/char_2009.gif) :
:![[thin space (1/6-em)]](https://www.rsc.org/images/entities/char_2009.gif) 1 mixtures have AFQ values of 3.53, 3.00, and 3.30, respectively.
1 mixtures have AFQ values of 3.53, 3.00, and 3.30, respectively.
| Molar ratio SiO2–TiO2 | δ/% | ||
|---|---|---|---|
| Q2 | Q3 | Q4 | |
1![[thin space (1/6-em)]](https://www.rsc.org/images/entities/char_2009.gif) : :![[thin space (1/6-em)]](https://www.rsc.org/images/entities/char_2009.gif) 1 1 |
−92.2/27.7 | −100.3/48.4 | −108.7/23.9 |
1![[thin space (1/6-em)]](https://www.rsc.org/images/entities/char_2009.gif) : :![[thin space (1/6-em)]](https://www.rsc.org/images/entities/char_2009.gif) 4 4 |
−92.9/40.4 | −100.5/51.6 | −110.3/8.0 |
4![[thin space (1/6-em)]](https://www.rsc.org/images/entities/char_2009.gif) : :![[thin space (1/6-em)]](https://www.rsc.org/images/entities/char_2009.gif) 1 1 |
−92.2/19.5 | −101.3/61.8 | −110.0/18.6 |
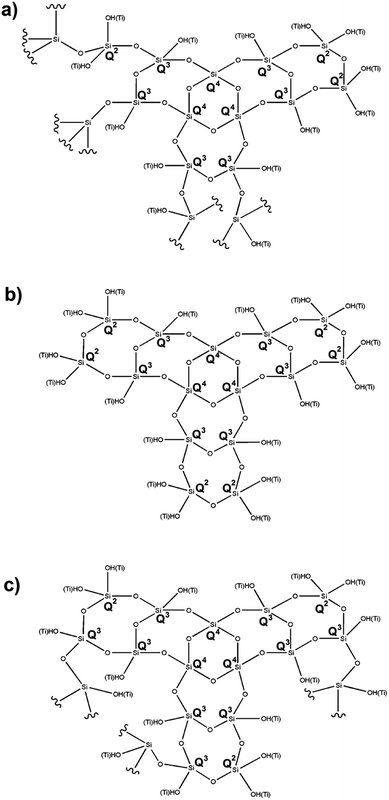
Based on the above data, it is possible to propose appropriate structures for the respective synthesized hybrid catalysts. Chart 1a shows the proposed structure for the 1![[thin space (1/6-em)]](https://www.rsc.org/images/entities/char_2009.gif) :
:![[thin space (1/6-em)]](https://www.rsc.org/images/entities/char_2009.gif) 1 catalyst, maintaining the twofold greater amount of Q3 over the Q2 and Q4 centers. Chart 1b shows a similar ratio between Q3 and Q2 in the 4
1 catalyst, maintaining the twofold greater amount of Q3 over the Q2 and Q4 centers. Chart 1b shows a similar ratio between Q3 and Q2 in the 4![[thin space (1/6-em)]](https://www.rsc.org/images/entities/char_2009.gif) :
:![[thin space (1/6-em)]](https://www.rsc.org/images/entities/char_2009.gif) 1 molar ratio catalyst. Chart 1c shows a threefold greater amount of Q3 with respect to the Q2 and Q4 centers, bearing in mind that Q4 is present in a minor proportion and is considered as the center of the network. In addition, we are convinced that all TiO2 is incorporated into the silica network, and that the different molar ratios are not important for generating composites of this type.
1 molar ratio catalyst. Chart 1c shows a threefold greater amount of Q3 with respect to the Q2 and Q4 centers, bearing in mind that Q4 is present in a minor proportion and is considered as the center of the network. In addition, we are convinced that all TiO2 is incorporated into the silica network, and that the different molar ratios are not important for generating composites of this type.
Photocatalytic assays
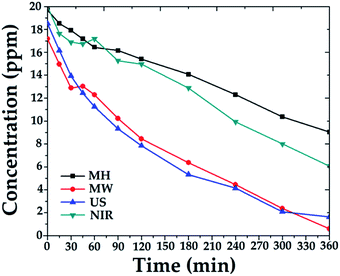
The photocatalytic degradation of 4-chlorophenol was performed to determine the mineralization efficiencies of the hybrid materials.37 For example, 250 mg of each 1![[thin space (1/6-em)]](https://www.rsc.org/images/entities/char_2009.gif) :
:![[thin space (1/6-em)]](https://www.rsc.org/images/entities/char_2009.gif) 4 catalyst was applied with irradiation for 6 h. Comparative degradation profiles are shown in Fig. 6.
4 catalyst was applied with irradiation for 6 h. Comparative degradation profiles are shown in Fig. 6.
Degradation percentages over the 1![[thin space (1/6-em)]](https://www.rsc.org/images/entities/char_2009.gif) :
:![[thin space (1/6-em)]](https://www.rsc.org/images/entities/char_2009.gif) 4 catalysts were in the range 54–97%, depending on the activation mode. The best catalytic activity was obtained with catalysts synthesized with MW assistance, followed by US, NIR, and MH synthesis, respectively.
4 catalysts were in the range 54–97%, depending on the activation mode. The best catalytic activity was obtained with catalysts synthesized with MW assistance, followed by US, NIR, and MH synthesis, respectively.
The obtained results are consistent with the physical properties listed in Table 1. In other words, the combination of surface area, pore size, pore volume, and crystal size of catalysts synthesized by MW favors adsorption of 4-chlorophenol molecules and facilitates their diffusion into the catalyst. Similar behavior was observed for the catalyst synthesized with US assistance; thus, advanced degradation was attained.
Comparing the other generated materials, those prepared with NIR and MH assistance both showed lower adsorptions of 4-chlorophenol, which may be ascribed to the sizes and volumes of their pores, 4.33 and 2.77 nm and 0.363 and 0.290 cm3 g−1, respectively, in this last probably due to cluster growth. Consequently, less mineralization was achieved over the sample prepared by the MH procedure.
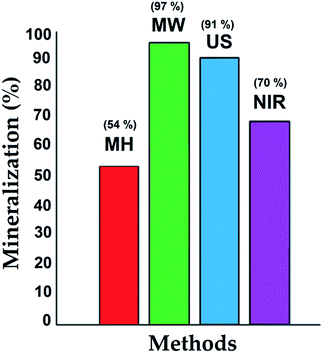
During the photocatalytic assays, total organic carbon analyses were performed, indicating the mineralization (CO2 and H2O); the results are shown as a bar chart in Fig. 7. At the beginning of the process, a significant amount of 4-chlorophenol was adsorbed on the catalyst, and then its degradation process at the active sites (TiO2) proceeded under illumination with UV light.37 The results were consistent with the characterization of the materials, with high surface areas, appropriate pore size and volume, and small crystal size favoring adsorption of the contaminant and its interaction with the TiO2 incorporated in the structure of the SiO2. The degradation over these materials showed a synergistic effect between adsorption and photocatalytic activity.
Experimental
General information
Tetrabutylorthotitanate (TBOT), tetraethylorthosilicate (TEOS), were purchased from Sigma Aldrich Chemical and were used without further purification. Near-infrared irradiation was generated using a commercial device “Flavor-Time®” (1350 W/110 V/120 V–60 Hz|220 V/240 V–60 Hz). Microwave-assisted synthesis was performed using a CEM Focused Microwave™ Synthesis System, Discover model. Ultrasound-assisted synthesis was performed using a Transonic 460/H Elma (35 kHz) ultrasound bath.The bands corresponding to the vibrating bonds of the target compounds were determined by Fourier transform infrared spectroscopy (FTIR, Bruker 27) with the connection of Attenuated Total Reflection (ATR). The crystalline phase composition was determined by X-ray diffraction measurements (XRD Bruker D8 Advance) with CuKα radiation. The surface area of the samples was calculated by the BET equation using the N2 adsorption–desorption curves, measured in a Quantachrome Autosorb-1 instrument. The optical absorption of the photocatalysts was determined using a DRS-UV-vis spectrophotometer (Thermo Fisher Scientific-Evolution 600), equipped with an integrating sphere (TFS-Praying Mantis). The morphologies and size of the particles were acquired using FE-SEM (FEI-Nova nanosem 200). The 29Si MAS NMR spectra were recorded using a Bruker Advance III 400 MHz, operating at 79.47 MHz, using 4 mm ZrO2 rotors, the contact time was 3000 μs, d1 = 4 s with spinning rate of 8 kHz and 8000 scans, and as an internal reference was used talc (−98.1 ppm), the chemical shifts (δ) are expressed in ppm.
General procedure for the SiO2–TiO2 hybrid catalyst
A set of five molar compositions of SiO2–TiO2 were evaluated 1![[thin space (1/6-em)]](https://www.rsc.org/images/entities/char_2009.gif) :
:![[thin space (1/6-em)]](https://www.rsc.org/images/entities/char_2009.gif) 4, 1
4, 1![[thin space (1/6-em)]](https://www.rsc.org/images/entities/char_2009.gif) :
:![[thin space (1/6-em)]](https://www.rsc.org/images/entities/char_2009.gif) 2, 1
2, 1![[thin space (1/6-em)]](https://www.rsc.org/images/entities/char_2009.gif) :
:![[thin space (1/6-em)]](https://www.rsc.org/images/entities/char_2009.gif) 1, 2
1, 2![[thin space (1/6-em)]](https://www.rsc.org/images/entities/char_2009.gif) :
:![[thin space (1/6-em)]](https://www.rsc.org/images/entities/char_2009.gif) 1, and 4
1, and 4![[thin space (1/6-em)]](https://www.rsc.org/images/entities/char_2009.gif) :
:![[thin space (1/6-em)]](https://www.rsc.org/images/entities/char_2009.gif) 1. For a 1
1. For a 1![[thin space (1/6-em)]](https://www.rsc.org/images/entities/char_2009.gif) :
:![[thin space (1/6-em)]](https://www.rsc.org/images/entities/char_2009.gif) 1 molar ratio, a mixture of TEOS (2083.00 mg), TBOT (3403.20 mg) were placed in an appropriate Erlenmeyer or bottom flask, and 5 mL of distilled water for MH, US, MW, and 10 mL of distilled water for NIR procedures. The mixture was treated using and comparing four different activation modes: near-infrared irradiation during 15 min at 90 °C with vigorous magnetic stirring, placing the magnetic agitator under Flavor-Time; ultrasound bath for 30 min at 25 °C; microwave irradiation during 10 min at 80 °C with 100 W power, and mantle heating for 3 h at 60 °C. For another molar ratio 1
1 molar ratio, a mixture of TEOS (2083.00 mg), TBOT (3403.20 mg) were placed in an appropriate Erlenmeyer or bottom flask, and 5 mL of distilled water for MH, US, MW, and 10 mL of distilled water for NIR procedures. The mixture was treated using and comparing four different activation modes: near-infrared irradiation during 15 min at 90 °C with vigorous magnetic stirring, placing the magnetic agitator under Flavor-Time; ultrasound bath for 30 min at 25 °C; microwave irradiation during 10 min at 80 °C with 100 W power, and mantle heating for 3 h at 60 °C. For another molar ratio 1![[thin space (1/6-em)]](https://www.rsc.org/images/entities/char_2009.gif) :
:![[thin space (1/6-em)]](https://www.rsc.org/images/entities/char_2009.gif) 2 (1041.50 mg of TEOS and 3403.20 mg of TBOT), 1
2 (1041.50 mg of TEOS and 3403.20 mg of TBOT), 1![[thin space (1/6-em)]](https://www.rsc.org/images/entities/char_2009.gif) :
:![[thin space (1/6-em)]](https://www.rsc.org/images/entities/char_2009.gif) 4 (520.75 mg of TEOS and 3403.20 mg of TBOT), 2
4 (520.75 mg of TEOS and 3403.20 mg of TBOT), 2![[thin space (1/6-em)]](https://www.rsc.org/images/entities/char_2009.gif) :
:![[thin space (1/6-em)]](https://www.rsc.org/images/entities/char_2009.gif) 1 (4166.00 mg of TEOS and 3403.20 mg of TBOT), and 4
1 (4166.00 mg of TEOS and 3403.20 mg of TBOT), and 4![[thin space (1/6-em)]](https://www.rsc.org/images/entities/char_2009.gif) :
:![[thin space (1/6-em)]](https://www.rsc.org/images/entities/char_2009.gif) 1 (4166.00 of TEOS and 1701.60 mg of TBOT) were following the same procedure. Then, the gels were aged and dried for 3 h at 80 °C. Finally, the materials were finely ground and calcinated for 5 h at 500 °C.
1 (4166.00 of TEOS and 1701.60 mg of TBOT) were following the same procedure. Then, the gels were aged and dried for 3 h at 80 °C. Finally, the materials were finely ground and calcinated for 5 h at 500 °C.
Evaluation of photocatalytic activity (PCA)
The degradations were carried out in a reaction system, consisting of a stainless-steel annular cylinder that serves as a support of four UV light lamps (15 W) with maximum emission at 350 nm. The system has a glass cell of 750 mL of capacity and 8 cm of diameter equipped with a hood of two ports: for the inlet of oxygen, which is supplied by a glass tube whit constant flow 100 mL min−1, and the feeding of the sample. The reactor bears a fan placed in the down of the system to avoid heating of the lamps and the reaction mixture, and a magnetic stirring plate to maintain the mix homogeneously.The PCA of the SiO2–TiO2 catalysts for the degradation of 4-chlorophenol was evaluated in aqueous solution at pH 6. The catalyst (250 mg) was added a glass cell containing 250 mL of an aqueous solution of 4-chlorophenol (20 ppm). The suspension was magnetically stirred in the dark for 30 min to achieve the adsorption–desorption equilibrium. Then, the UV lights lamps, fan, and oxygen are switch on. The reaction is carried out for 6 h. Then the samples were filtered with 0.22 μg GV millipore membranes, and the solution obtained was stored in the dark for total organic carbon (TOC) analysis by mean of DRS-UV-vis spectroscopy.
Conclusions
A green approach for the production of silica–titania catalysts, with interesting photocatalytic activity, has been achieved. Compliance with several principles of the Green Chemistry Protocol (1, 3, 5, 6, 10, and 12) has been addressed, with two green features being the employment of non-conventional activation modes with efficacies in the order MW > US > NIR, as opposed to traditional MH (principle 6), and the use of water as a green solvent (principle 5). The prepared catalysts have been extensively characterized by FTIR, XRD, DRS-UV/Vis, BET, FE-SEM, and 29Si MAS NMR. The efficacies of the four activation modes have been evaluated and discussed. Finally, the pertinence of the SiO2–TiO2 catalysts has been suitably demonstrated by evaluating their PCA efficiencies in the degradation of 4-chlorophenol in aqueous solution.Conflicts of interest
There are no conflicts to declare.Acknowledgements
H. Pérez acknowledges the financial support from CONACYT for the Master scholarship CVU 711676. R. Miranda acknowledges PAPIME-UNAM PE209919 for financial support. H. Pérez and E. Moctezuma acknowledges to Fondo de Ciencia Básica-CONACYT 256795-2016 and PDCPN 2014-01-248698.Notes and references
- C. J. Brinker and G. W. Scherer, Sol-gel science the physics and chemistry of sol-gel processing, Academic Press, Boston, USA, 1990 Search PubMed.
- E. Pabón Gelves, S. M. Borja Ordóñez, J. Ordóñez Loza and A. Ramírez Vélez, Rev. EIA, 2013, 10, 123–132 Search PubMed.
- L. L. Hench and J. K. West, Chem. Rev., 1990, 90, 33–72 CrossRef CAS.
- P. Singh, F. Syed and F. Z. Haque, Orient. J. Chem., 2014, 30, 1577–1584 CrossRef.
- L. Mercier and T. J. Pinnavaia, Adv. Mater., 1997, 9, 500–503 CrossRef CAS.
- E. Bontempi, L. E. Depero, C. Frigeri and G. Sberveglieri, Sens. Actuators, B, 2002, 83, 230–237 CrossRef.
- (a) X. Zhang, F. Zhang and K.-Y. Chan, Appl. Catal., 2005, 284, 193–198 CrossRef CAS; (b) E. Moctezuma, E. Leyva, C. A. Aguilar, R. A. Luna and C. Montalvo, J. Hazard. Mater., 2012, 243, 130–138 CrossRef CAS; (c) E. Moctezuma, E. Leyva, M. López, A. Pinedo, B. Zermeño and B. Serrano, Top. Catal., 2013, 56, 1875–1882 CrossRef CAS; (d) M. E. Zarazúa-Morín, L. M. Torres-Martínez, E. Moctezuma, I. Juárez-Ramírez and B. B. Zermeño, Res. Chem. Intermed., 2016, 42, 1029–1043 CrossRef.
- B. Llano, J. M. Marín, G. Restrepo and L. A. Ríos, Appl. Catal., A, 2010, 387, 135–140 CrossRef CAS.
- F. Z. Haque, R. Nandanwar, P. Singh, K. Dharavath and F. F. Syed, Silicon, 2018, 10, 413–419 CrossRef CAS.
- S. Cheng, X. Liu, S. Yun, H. Luo and Y. Gao, Ceram. Int., 2014, 40, 13781–13786 CrossRef CAS.
- G. Zu, J. Shen, W. Wang, L. Zou, Y. Lian and Z. Zhang, ACS Appl. Mater. Interfaces, 2015, 7, 5400–5409 CrossRef CAS.
- N. Aman, N. N. Das and T. Mishra, J. Environ. Chem. Eng., 2016, 4, 191–196 CrossRef CAS.
- (a) R. Escobedo, R. Miranda and J. Martínez, Int. J. Mol. Sci., 2016, 17, 453 CrossRef; (b) J. Martínez and R. Miranda, Chapter 3: Infrared irradiation, an excellent, alternative green energy source. Green Chemistry Applications, ed. M. Eyvaz, IntechOpen, London, UK, 2019, DOI:10.5772/intechopen.83805.
- P. T. Anastas and J. C. Warner, Green chemistry: theory and practice, Oxford University Press, Oxford, USA, 2000 Search PubMed.
- J. Clark and D. Macquarrie, Handbook of green chemistry and technology, Blackwell Science, Oxford, USA, 2002 Search PubMed.
- (a) J. Martínez, B. Velasco-Bejarano, F. Delgado, R. Pozas, H. M. Torres Domínguez, J. G. Trujillo Ferrara, G. A. Arroyo and R. Miranda, Nat. Prod. Commun., 2008, 3, 1465–1468 CrossRef; (b) J. Martínez, J. Rosas, J. Pérez, Z. Saavedra, V. Carranza and P. Alonso, Nat. Prod. Res., 2018, 33, 447–452 CrossRef; (c) J. Martínez, S. Romero-Vega, R. Abeja-Cruz, C. Álvarez-Toledano and R. Miranda, Int. J. Mol. Sci., 2013, 14, 2903–2915 CrossRef; (d) M. Zarco Juarez, J. O. Martínez, O. Noguez Cordova, M. I. Nicolás Vazquez, T. Ramírez-Apan, J. Pérez Flores, R. Miranda Ruvalcaba and G. A. Arroyo Razo, J. Chem., 2013, 2013, 1–9 CrossRef; (e) J. Martínez, L. Sánchez, F. J. Pérez, V. Carranza, F. Delgado, L. Reyes and R. Miranda, J. Chem., 2016, 2016, 1–6 CrossRef; (f) R. G. Escobedo-González, A. Vázquez Cabañas, A. Martínez González, P. Mendoza Sánchez, Z. Saavedra-Leos, J. Cruz-Olivares, J. Nava Serrano, J. Martínez and R. Miranda Ruvalcaba, Molecules, 2019, 24, 3035 CrossRef.
- M. L. Morales Galicia, J. O. Martínez, L. B. Reyes-Sánchez, O. Martín Hernández, G. A. Arroyo Razo, A. Obaya Valdivia and R. Miranda Ruvalcaba, Educ. Quim., 2011, 22, 240–248 Search PubMed.
- (a) X. Gao and I. E. Wachs, Catal. Today, 1999, 51, 233–254 CrossRef CAS; (b) H. Zhang and J. F. Banfield, J. Mater. Chem., 1998, 8, 2073–2076 RSC; (c) B. A. Morrow and J. L. G. Fierro, Spectroscopic characterization of heterogeneous catalysis, Elsevier Science Publishers Amsterdam, Netherlands, 1990 Search PubMed; (d) S. Kein, S. Thorimbert and W. F. Maier, J. Catal., 1996, 163, 476–488 CrossRef.
- Z. M. Shi and T. J. Bao, J. Non-Cryst. Solids, 2017, 459, 75–82 CrossRef CAS.
- Z. Li, B. Hou, Y. Xu, D. Wu, Y. Sun, W. Hu and F. Deng, J. Solid State Chem., 2005, 178, 1395–1405 CrossRef CAS.
- B. J. Brinkworth, Appl. Opt., 1972, 11, 1434–1435 CrossRef CAS.
- V. Iliev, D. Tomova, S. Rakovsky, A. Eliyas and G. L. Puma, J. Mol. Catal. A: Chem., 2010, 327, 51–57 CrossRef CAS.
- K. S. W. Sing, D. H. Everett, R. A. W. Haul, L. Moscou, R. A. Prierotti, J. Rouquerol and T. Siemieniewska, Pure Appl. Chem., 1985, 57, 603–619 CAS.
- S. Lowell, J. E. Shields, M. A. Thomas and M. Thommes, Characterization of porous solids and powders: surface area, pore size and density, Springer Netherlands Heidelberg, Germany, 2006 Search PubMed.
- (a) R. D. González, T. López and R. Gómez, Catal. Today, 1997, 35, 293–317 CrossRef; (b) N. A. Delgado, L. Hinojosa-Reyes, I. L. Guzman-Mar, M. A. Gracia-Pinilla and A. Hernández-Ramírez, Catal. Today, 2013, 209, 35–40 CrossRef.
- S. V. Sancheti and P. R. Gogate, Ultrason. Sonochem., 2017, 36, 527–543 CrossRef CAS.
- P. I. Liu, L. C. Chung, H. Shao, T. M. Liang, R. Y. Horng, M. M. Chen-Chi and M. C. Chang, Titanium dioxide: chemical properties, applications and environmental effects, Nova Science Publishers Inc New York, USA, 2014 Search PubMed.
- S. Askari, S. M. Alipour, R. Halladj and M. H. Davood Abadi Farahani, J. Porous Mater., 2013, 20, 285–302 CrossRef CAS.
- (a) A. de la Hoz, A. Díaz-Ortiz and A. Moreno, Chem. Soc. Rev., 2005, 34, 164–178 RSC; (b) B. Hayes, Microwave synthesis: chemistry at the speed of light, CEM Publishing Matthews, USA, 2002 Search PubMed.
- Toxics Release Inventory (TRI) Program, https://www.epa.gov/toxics-release-inventory-tri-program/tri-listed-chemicals, accessed on 22 June 2020 Search PubMed.
- (a) E. Haque, N. A. Khan, J. H. Park and S. H. Jhung, Chem. – Eur. J., 2010, 16, 1046–1052 CrossRef CAS; (b) M. Gharibeh, G. A. Tompsett, W. C. Conner and K. S. Yngvesson, ChemPhysChem, 2008, 9, 2580–2591 CrossRef CAS; (c) A. Díaz-Ortiz, P. Prieto and A. de la Hoz, Chem. Rec., 2019, 19, 85–97 CrossRef.
- Y. Tanaka and M. Suganuma, J. Sol-Gel Sci. Technol., 2001, 22, 83–89 CrossRef CAS.
- A. M. Ruiz, G. Dezanneau, J. Arbiol, A. Cornet and J. R. Morante, Chem. Mater., 2004, 16, 862–871 CrossRef CAS.
- K. J. D. Mackenzie and M. E. Smith, Multinuclear solid-state NMR of inorganic materials, Pergamon, Oxford, UK, 2002, vol. 6 Search PubMed.
- D. M. Pickup, G. Mountjov, G. W. Wallidge, R. Anderson, J. M. Cole, R. J. Newport and M. E. Smith, J. Mater. Chem., 1999, 9, 1299–1305 RSC.
- C. Mutter, T. N. M. Bernards, M. P. J. Peeters, J. H. Lammers and M. R. Böhmer, Thin Solid Films, 1999, 351, 95–98 CrossRef CAS.
- B. Zermeño, E. Moctezuma and R. García, Sustainable Environ. Res., 2011, 21, 299–305 Search PubMed.
Footnote |
| † Electronic supplementary information (ESI) available: Tables 1 and 2, and equation to obtain the band gap. See DOI: 10.1039/d0ra07569h |
| This journal is © The Royal Society of Chemistry 2020 |

