DOI:
10.1039/D0RA07583C
(Paper)
RSC Adv., 2020,
10, 41612-41617
The photoelectron-imaging spectroscopic study and chemical bonding analysis of VO2−, NbO2− and TaO2−†
Received
4th September 2020
, Accepted 29th October 2020
First published on 13th November 2020
Abstract
The transition-metal di-oxides, namely VO2−, NbO2− and TaO2− have been studied using photoelectron velocity map imaging (PE-VMI) in combination with theoretical calculations. The adiabatic electron affinities of VO2−, NbO2− and TaO2− are confirmed to be 2.029(8), 1.901(10) and 2.415(8) eV, respectively. By combining Franck–Condon (FC) simulation with theoretical calculations, the vibrational feature related to Nb–O and Ta–O stretching modes for the ground state has been unveiled. The photoelectron angular distribution (PAD) for VO2−, NbO2− and TaO2− is correlated to the photo-detachment of the highest occupied molecular orbitals (HOMOs), which primarily gets involved in s- and d-orbitals of the V, Nb and Ta atoms. A variety of theoretical calculations have been used to analyze the chemical bonding features of VO2−1/0, NbO2−1/0 and TaO2−1/0, which show that the strong M–O (M = V, Nb and Ta) bond is mainly characterized as ionicity.
Introduction
Vanadium, niobium and tantalum oxides are widely used as metal oxide catalysts in chemical and materials industries.1–3 For the past several decades, the molecular structure and reactivity of surface metal oxide species have been extensively studied. In addition, these investigations and valuable reactions inspired us to design supported metal oxide catalysts at the molecular level.4–6 As the reactivity of supported catalysts is known to depend on the particle size of catalysts, there has been a focus on the chemistry of gas-phase size-selected oxide clusters as model catalytic systems.7–13
Moreover, vanadium, niobium and tantalum oxides have been extensively studied in the gas phase and solid matrices via spectroscopy.14–23 The laser ablation of transition metal oxides shows very rich chemical properties due to the high reactivity of these ablated metal atoms, and a large number of products were observed.14,15 The M–oxygen system (M stands for a transition metal) contains lot of products: MO, MO2, MO−, MO2− and their dimers. Inspired by the previous work on spectroscopic studies of vanadium and niobium oxides, chemical bond analyses of VO2−, NbO2− and TaO2− have been explored.
Herein, we first report the photoelectron spectroscopic results of NbO2− using photoelectron velocity map imaging (PE-VMI). In the current study, the PE-VMI experiments performed on VO2−, NbO2− and TaO2− not only give relatively precise EAs and vibrational frequencies but also directly reveal the detached molecular orbital (MO) nature via the photoelectron angular distribution (PAD).24,25 The wealthy and accurate spectroscopic information reported in the following section will also benefit the benchmark of the performance of various kinds of theoretical methods. Theoretical calculations in the following discussion have confirmed the experimental results, and the chemical bonding nature of VO2−1/0, NbO2−1/0 and TaO2−1/0 clusters are further discussed by a series of methods.
Results and discussion
The PE-VMI and corresponding spectra of VO2−, NbO2− and TaO2− are shown in Fig. 1 and S1.† Each photoelectron spectrum exhibits a clear-cut vibrational structure. As shown in Table 1, the ADEs of VO2−, NbO2− and TaO2− are confirmed to be 2.209(8), 1.901(10) and 2.415(8) eV, respectively. The theoretically calculated values of VO2−, NbO2− and TaO2− are 2.112, 1.714 and 2.225 eV, respectively, at the level of B3LYP (the basis set of LANL2TZ for V, Nb and Ta, aug-cc-pVTZ for O) and 2.265, 1.926 and 2.443 eV, respectively, at the level of CCSD(T) (the basis set of LANL2TZ for V, Nb and Ta, aug-cc-pVTZ for O). Due to the scarce discussion on the chemical bond nature of VO2−1/0, NbO2−1/0 and TaO2−1/0 previously, their chemical bond properties are systematically analyzed in this study.
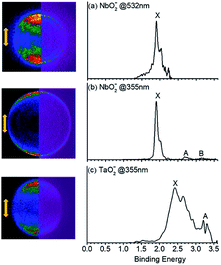 |
| | Fig. 1 Photoelectron images (left columns) and spectra (right columns) for (a), (b) NbO2− and (c) TaO2− obtained at 532 nm and 355 nm, respectively. The left side shows the raw photoelectron image (left) and the reconstructed one (right) after inverse Abel transformation. Laser polarization is vertical in the plane of the page. | |
Table 1 Experimental and theoretical ADEs for VO2−, NbO2− and TaO2− and comparision with the calculated values including ZPVEs (unit: eV)
| Species |
Expt.a |
Calc. |
βf |
| This work |
Reference |
B3LYP |
CCSD(T) |
| Xb |
X |
X |
X |
| Numbers in the parentheses are experimental uncertainties in the last digit. X stands for the ground state of all species. Ref. 15. Ref. 21. Ref. 23. The nature of β in the all species for the ground-state. |
| VO2−/VO2 |
2.029(8) |
2.030c/1.836d |
2.112 |
2.265 |
1.51 |
| NbO2−/NbO2 |
1.901(10) |
|
1.714 |
1.926 |
1.57 |
| TaO2−/TaO2 |
2.415(8) |
2.400e |
2.225 |
2.443 |
1.56 |
As shown in Fig. 2, the vibrational frequency and geometric optimization calculations are performed for VO2−1/0, NbO2−1/0 and TaO2−1/0 at the level of B3LYP (the basis set of LANL2TZ for V, Nb and Ta, aug-cc-pVTZ for O). On comparing the results from calculations, the structural variation in the M–O (M = V, Nb and Ta) bond length and O–M–O bond angle are subtle. The results show that the M–O bond length calculated at the level of B3LYP increases in the range 0.01–0.03 Å for the anion species. The atomic net charges, M–O bond orders and natural-localized molecular orbitals (NLMO) in MO2− (M = V, Nb and Ta) are summarized in Tables 2 and S1.†
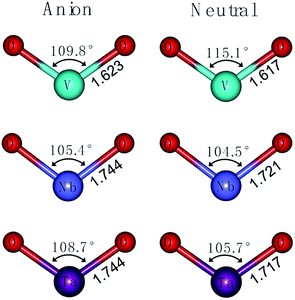 |
| | Fig. 2 Optimized structures of VO2−1/0, NbO2−1/0 and TaO2−1/0 at the level of B3LYP (the basis set of LANL2TZ for V, Nb and Ta, aug-cc-pVTZ for O). | |
Table 2 The NPA charges and M–O bond orders in MO2− (M = V, Nb and Ta) at the level of B3LYP (the basis set of LANL2TZ for V, Nb and Ta, aug-cc-pVTZ for O)
| Charge population |
| Species |
NPA(M) |
NPA(O) |
| VO2− |
0.46 |
−0.73 |
| NbO2− |
0.63 |
−0.82 |
| TaO2− |
1.04 |
−1.02 |
| Bond order |
| Species |
Bond |
Wiberg |
Mayer |
NAO |
| VO2− |
V–O |
1.900 |
1.198 |
1.067 |
| NbO2− |
Nb–O |
1.835 |
1.215 |
1.053 |
| TaO2− |
Ta–O |
1.807 |
0.798 |
1.075 |
Franck–Condon (FC) simulations were performed to assist us in the spectral assignments using the PESCAL program.42 Herein, we used Gaussian 09 to generate normal mode vectors in mass-weighted cartesian displacement coordinates and the Chen method for the Franck–Condon factors. As shown in Fig. 3, the photoelectron spectra for NbO2− and TaO2− were compared with the ground state of the corresponding FC simulations at 532 nm and 355 nm, respectively. The simulated vibrational spectra for anions were obtained at ∼280 K. There are many dense features in the high binding energy, which results in low resolution and poor signal-to-noise ratio peaks. As listed in Table 3, the calculated vibrational frequencies for VO2−1/0, NbO2−1/0 and TaO2−1/0 using the B3LYP levels were compared with the experimental ones. The vibrational frequencies of the ground-state of neutral VO2, NbO2 and TaO2 were extracted to be 952 (20), 984 (40) and 985 (20) cm−1, respectively, which can be assigned to the stretching modes of V–O, Nb–O and Ta–O bonds.
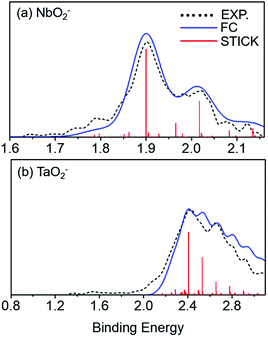 |
| | Fig. 3 Photoelectron spectrum for (a) NbO2− and (b) TaO2− obtained at 532 nm and 355 nm, respectively. Franck–Condon (FC) simulation for the photodetachment of NbO2− and TaO2−. Black curves stand for the experimental data, blue curves for the FC simulated results, and red sticks for the simulated vibronic transitions. | |
Table 3 Calculated vibrational frequencies for VO2−1/0, NbO2−1/0 and TaO2−1/0 using the B3LYP (the basis set of LANL2TZ for V, Nb and Ta, aug-cc-pVTZ for O) level compared to experimental observations (cm−1). Numbers in the parentheses are experimental uncertainties in the last digit
| Species |
States |
Expt. frequency |
Calc. frequency |
| B3LYP |
| Ref. 12. Ref. 20. |
| VO2− |
2Π |
|
962 |
| VO2 |
1Σ |
952(20)/970a |
989 |
| NbO2− |
2Π |
|
915 |
| NbO2 |
1Σ |
984(40) |
951 |
| TaO2− |
2Π |
|
903 |
| TaO2 |
1Σ |
985(20)/968b |
963 |
The corresponding valent MOs of VO2−, NbO2− and TaO2− are shown in Fig. 4. As listed in Table 4, the highest occupied molecular orbitals (HOMOs) have a dominant orbital component in VO2− {90% V (s + d) + 8% O (s)}, NbO2− {95% Nb (s + d) + 2% O (s)} and TaO2− {95% Ta (s + d) + 2% O (s)}. This indicates that the contributions of the V, Nb and Ta atomic orbitals are quite small for the M–O (M = V, Nb and Ta) covalent bond formation. It is found that the three highest occupied molecular orbitals clearly reveal the shape of atomic orbitals for VO2−, NbO2− and TaO2−. For the PAD, anisotropy parameter β (ranging from −1 to 2) could also exhibit a qualitative fingerprint into the photo-detachment process from a specific molecular orbital. The nature of β in VO2−1/0, NbO2−1/0 and TaO2−1/0 for the ground-state appears as a positive value (β ∼ 1.51 for VO2−, β = ∼1.57 for NbO2− and β ∼ 1.56 for TaO2−). The hypothetical β-waves are partitioned among the atomic orbital coefficients (cs2; cp2; cd2; …), constituting a specific molecular orbital, i.e.  . A particular atomic orbital coefficient is concluded upon satisfying the normalization condition (cs2 + cp2 + cd2 = 1). As an example of this method, the VO2 molecular orbital is constructed of cs2 = 0.78, cp2 = 0.02 and cd2 = 0.20 atomic orbital coefficients. Enumerating the four most possible combination results for the hypothetical β-waves
| |
 | (1) |
| |
 | (2) |
| |
 | (3) |
| |
 | (4) |
(1) and
(4) correspond to pure transitions for both orbital coefficients (
cp2,
cd2); whereas
(2) and
(3) can be thought of as cross-terms. In the same way, we can also enumerate four most possible combinations of NbO
2 and TaO
2 molecular orbitals for hypothetical
β-waves and obtain the value of the anisotropy parameter (NbO
2 for
β: 1.86, 1.81, 1.83 and 1.78; TaO
2 for
β: 1.87, 1.83, 1.84 and 1.79). In addition, NBOs in MO
2− (M = V, Nb and Ta) are displayed in Fig. S2.
†
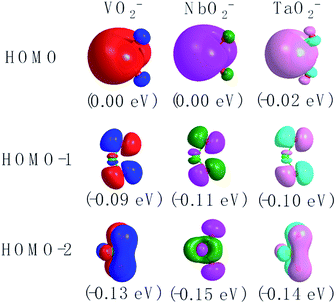 |
| | Fig. 4 The contour plots of the valent MOs of the ground state of VO2−, NbO2− and TaO2− calculated at the level of B3LYP (the basis set of LANL2TZ for V, Nb and Ta, aug-cc-pVTZ for O) (isovalue = 0.02 a.u.). | |
Table 4 Calculated HOMO compositions at the level of B3LYP (the basis set of LANL2TZ for V, Nb and Ta, aug-cc-pVTZ for O) of VO2−, NbO2− and TaO2−
| HOMO |
MO energy level (eV) |
MO pop. analysis: % M character |
| X = V or Nb |
O |
| VO2− |
0.004 |
70(s) + 2(p) + 20(d) |
8(s) |
| NbO2− |
0.001 |
86(s) + 3(p) + 9(d) |
2(s) |
| TaO2− |
−0.014 |
87(s) + 3(p) + 8(d) |
2(s) |
In order to acquire more insights into the chemical bonding of VO2−, NbO2− and TaO2−, we employed the natural resonance theory (NRT), which was calculated at the B3LYP (the basis set of LANL2TZ for V, Nb and Ta, aug-cc-pVTZ for O) level. NRT is a calculated method based on quantum chemical calculations. The classical concept of valence bonds was used to describe molecules that have significant resonance structures. Table 5 displays the detailed ionic and covalent electrovalent contributions for VO2−, NbO2− and TaO2−. The ionic electrovalent contributions to the M–O (M = V, Nb and Ta) bond are 66.88%, 62.55% and 62.12%, respectively; demonstrating that the strong M–O (M = V, Nb and Ta) bond order mainly comes from the ionic interaction.
Table 5 Summary of the natural resonance theory (NRT) and covalent and ionic electrovalent contributions of the optimized structures of VO2−, NbO2− and TaO2− species at the B3LYP (the basis set of LANL2TZ for V, Nb and Ta, aug-cc-pVTZ for O) level
| |
T(NRT)a |
NRT bond order |
Covalent |
Ionic |
| Total NRT bond order is the sum of covalent (c) plus ionic (i) bond order. |
| VO2− |
1.0343 |
0.3426c + 0.6916i |
33.12% |
66.88% |
| NbO2− |
1.0544 |
0.3949c + 0.6594i |
37.45% |
62.55% |
| TaO2− |
2.1024 |
0.7964c + 1.3060i |
37.88% |
62.12% |
The ESP at a point in space refers to the work required to move a unit positive charge from an infinite distance to that point. Around the molecule, the ESP at a point is defined in terms of the net electrostatic interaction energy by the total charge distribution (electron + nuclei) of a molecule. An electron density isosurface mapped onto ESP represents the size, shape, charge density and site of the chemical reactivity of a molecule. It also reflects the partial charges distributed on every atom in a molecule. As displayed in Fig. 5, the ESP maps for VO2−1/0, NbO2−1/0 and TaO2−1/0 display qualitative visualization of relative charge distribution. The color scope of ESP maps only figures of the relative charge distribution of a given molecule, and the potential increases in the following order: red < yellow < green < blue. As expected, the area around V, Nb and Ta atoms possesses positive ESP, and the zone around the O atom possesses negative ESP. The ELF can provide an accurate description of the electron delocalization in molecules. As displayed in Fig. 6, the values of 0.50 and 1.00 a.u. correspond to the fully delocalized and fully localized electrons, respectively, while the value of 0.00 a.u. is on behalf of the very low charge density. The ELF results of VO2−1/0, NbO2−1/0 and TaO2−1/0 show that the M–O (M = V, Nb and Ta) bond is mainly ionic in nature, in line with the ESP and NPA results.
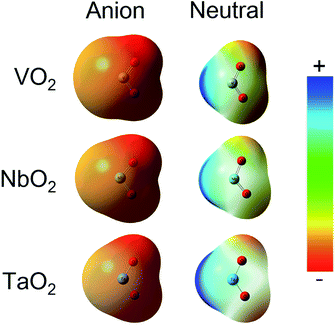 |
| | Fig. 5 Electrostatic potential (ESP) map for VO2−1/0, NbO2−1/0 and TaO2−1/0 molecules at the B3LYP (the basis set of LANL2TZ for V, Nb and Ta, aug-cc-pVTZ for O) level (isovalue = 0.001 a.u.). Surface potential ranges of anions are −17.37 kcal mol−1 (red) to 17.37 kcal mol−1 (blue) and neutral are −0.75 kcal mol−1 (red) to 0.75 kcal mol−1 (blue). | |
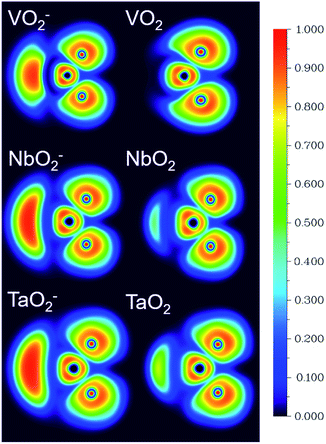 |
| | Fig. 6 The electron localization function (ELF) isosurfaces for VO2−1/0, NbO2−1/0 and TaO2−1/0 species at the B3LYP (the basis set of LANL2TZ for V, Nb and Ta, aug-cc-pVTZ for O) level (unit: a.u.). | |
Experimental and theoretical methods
The photoelectron velocity map imaging apparatus has been published in detail previously.26 The VO2, NbO2 and TaO2 anions were produced under the pulsed laser (532 nm wavelength, ∼10 mJ per pulse) vaporization of the respective pure metal targets at a repetition rate of 10 Hz. The target was scorched by the pulsed laser in front of a supersonic beam of a combination gas (99% He and 1% O2), and the pressure of the gas was adjusted about 0.1–0.5 MPa to flow into the vacuum by a pulsed valve. The anions were rapidly cooled and guided to the McLaren–Wiley time of a flight mass spectrometer (TOFMS).27 Then, a laser beam (532 nm) was made to interact with the selected anions, and electrons were emitted. The detached photoelectrons were extracted and mapped onto the phosphor screen and recorded by a charge-coupled device (CCD) camera. Each photo was accumulated with 10![[thin space (1/6-em)]](https://www.rsc.org/images/entities/char_2009.gif) 000 to 50
000 to 50![[thin space (1/6-em)]](https://www.rsc.org/images/entities/char_2009.gif) 000 laser shots at a repetition rate of 10 Hz. The original 3D distribution was reconstructed using the Basis Set Expansion (BASEX) inverse Abel transform method,28 and the photoelectron spectrum was acquired. The photoelectron kinetic energy spectra were calibrated by the known spectrum of atomic anions (such as Au). The resolution of the photoelectron spectrometer was about 50 meV at the electron kinetic energy of 1 eV. Another advantage of photoelectron imaging is its capability of measuring the PADs associated with each vibronic transition. The related fitting formula and physical meaning of β can be found in the previous studies.29,30
000 laser shots at a repetition rate of 10 Hz. The original 3D distribution was reconstructed using the Basis Set Expansion (BASEX) inverse Abel transform method,28 and the photoelectron spectrum was acquired. The photoelectron kinetic energy spectra were calibrated by the known spectrum of atomic anions (such as Au). The resolution of the photoelectron spectrometer was about 50 meV at the electron kinetic energy of 1 eV. Another advantage of photoelectron imaging is its capability of measuring the PADs associated with each vibronic transition. The related fitting formula and physical meaning of β can be found in the previous studies.29,30
Theoretical calculations were performed using the Gaussian 09 suite of program.31 VO2−1/0, NbO2−1/0 and TaO2−1/0 were calculated using the B3LYP hybrid functional, which consists of the Becke's three-parameter exchange functional (B3) and Lee–Yang–Parr correlation functional (LYP),32,33 and the LANL2TZ (triple-zeta)34,35 basis set were used for the vanadium, niobium and tantalum atoms, while the aug-cc-pVTZ36–38 basis set was used for the oxygen atom. Through vibrational analysis, it could be verified whether the optimized structure was a true local minimum or not, and the theoretical frequency was obtained. The harmonic vibration frequency was calculated at the same theoretical level to obtain zero-point vibrational energy (ZPVE). All the energies of the optimized structures were re-evaluated at the level of CCSD(T) (coupled-cluster singles and doubles plus perturbative triples),39 including ZPVE corrections. Vertical detachment energy (VDE) was calculated from the difference between the energy of an optimized anion structure and the corresponding neutral energy of the anion geometry, whereas electron affinity (EA) was calculated from the energy difference between an optimized structure of anions and neutrals. Natural population analysis (NPA),40 natural bond orbital (NBO),40 natural resonance theory (NRT), electron localization function (ELF)41 and electrostatic potential (ESP) analyses were completed to further investigate the chemical bonding features of VO2−, NbO2− and TaO2− at the level of B3LYP (the basis set of LANL2TZ for V, Nb and Ta, aug-cc-pVTZ for O).
Conclusions
In this work, we have reported experimental and theoretical studies on VO2−, NbO2− and TaO2− clusters. The adiabatic electron affinities of VO2, NbO2 and TaO2 were determined to be 2.029(8), 1.901(10) and 2.415(8) eV, respectively. The theoretically calculated values of VO2−, NbO2− and TaO2− are 2.112, 1.714 and 2.225 eV at the level of B3LYP and 2.265, 1.926 and 2.443 eV at the level of CCSD(T), respectively. The vibrational frequencies of the ground-state of neutral VO2, NbO2 and TaO2 were extracted to be 952 (20), 984 (40) and 985 (20) cm−1, which could be assigned to the stretching modes of V–O, Nb–O and Ta–O bonds, respectively. The positive anisotropic parameter β observed in PADs for these cases mainly results from the s- and d-orbital electron emission from the HOMOs of VO2−, NbO2− and TaO2−. Theoretical calculations have confirmed the experimental results and analyzed the chemical-bonding nature of VO2−1/0, NbO2−1/0 and TaO2−1/0 clusters by a series of methods (NPA, NBO, NRT, ELF and ESP). The results suggest that the strong V–O, Nb–O and Ta–O bond orders mainly come from the ionic interactions.
Conflicts of interest
There are no conflicts of interest to declare.
Acknowledgements
This work is supported by the National Science Foundation of China (grant no. 21873003, 91961107 and 21473193); Postdoctoral Science Foundation of China (No. 2018M642561); Anhui Natural Science Foundation (No. 1908085QA17).
References
- B. M. Weckhuysen and D. E. Keller, Catal. Today, 2003, 78, 25, DOI:10.1016/S0920-5861(02)00323-1.
- Y. H. Tao, B. Singh, V. Jindal, Z. C. Tang and P. P. Pescarmona, Green Chem., 2019, 21, 5852, 10.1039/c9gc02623a.
- A. M. Pasqualeti, E. Padgett, D. Y. Kuo, D. A. Muller, F. H. B. Lima and J. Suntivich, J. Electrochem. Soc., 2017, 164, F645, DOI:10.1149/2.1361706jes.
- K. Wang, X. Zhang, Z. H. Ren, X. L. Zhang, J. J. Hu, M. X. Gao, H. G. Pan and Y. F. Liu, Energy Storage Materials, 2019, 23, 79, DOI:10.1016/j.ensm.2019.05.029.
- A. M. Love, M. C. Cendejas, M. P. Hanrahan, S. L. Carnahan, P. Uchupalanun, A. J. Rossini and I. Hermans, Chem.–Eur. J., 2019, 25, 1, DOI:10.1002/chem.201904260.
- T. O. Dembaremba, R. D. Westhuizen, W. Welthagen, E. Ferg, A. S. Ogunlaja and Z. R. Tshentu, Energy Fuels, 2019, 33, 7595, DOI:10.1021/acs.energyfuels.9b01579.
- A. Goodrow, A. T. Bell and M. H. Gordon, J. Phys. Chem. C, 2009, 113, 19361, DOI:10.1021/jp906603r.
- J. B. Kim, M. L. Weichman and D. M. Neumark, J. Chem. Phys., 2014, 140, 034307, DOI:10.1063/1.4861667.
- S. Feyel, D. Schröder, X. Rozanska, J. Sauer and H. Schwarz, Angew. Chem., Int. Ed., 2006, 45, 4677, DOI:10.1002/anie.200600045.
- K. A. Zemski, D. R. Justes and A. W. Castleman, J. Phys. Chem. B, 2002, 106, 6136, DOI:10.1021/jp0142334.
- M. Theingi, K. T. Tun and N. N. Aung, SciMed. J., 2019, 1, 151, DOI:10.28991/SciMedJ-2019-0103-5.
- G. A. M. Metwally, M. Mahdy and A. H. A. El-Raheem, Civ. Eng. J., 2020, 6, 1443, DOI:10.28991/cej-2020-03091559.
- A. M. Abdelaal, E. M. Attalla and W. M. Elshemey, SciMed. J., 2020, 2, 8, DOI:10.28991/SciMedJ-2020-0201-2.
- H. J. Zhai and L. S. Wang, J. Chem. Phys., 2002, 117, 7882, DOI:10.1063/1.1510441.
- H. B. Wu and L. S. Wang, J. Chem. Phys., 1998, 108, 5310, DOI:10.1063/1.475966.
- H. J. Zhai, J. Döbler, J. Sauer and L. S. Wang, J. Am. Chem. Soc., 2007, 129, 13270, DOI:10.1021/ja0750874.
- S. M. E. Green, S. Alex, N. L. Fleischer, E. L. Millam, T. P. Marcy and D. G. Leopold, J. Chem. Phys., 2001, 114, 2653, DOI:10.1063/1.1333003.
- J. M. Dyke, A. M. Ellis, M. Feher, A. Morris, A. J. Paul and J. C. H. Stevens, J. Chem. Soc., Faraday Trans., 1987, 83, 1555, 10.1039/F29878301555.
- J. E. Mann, S. E. Waller, D. W. Rothgeb and C. C. Jarrold, J. Chem. Phys., 2011, 135, 104317, DOI:10.1063/1.3634011.
- W. J. Chen, H. J. Zhai, Y. F. Zhang, X. Huang and L. S. Wang, J. Phys. Chem. A, 2010, 114, 5958, DOI:10.1021/jp102439v.
- J. B. Kim, M. L. Weichman and D. M. Neumark, J. Chem. Phys., 2014, 140, 034307, DOI:10.1063/1.4861667.
- M. F. Zhou and L. Andrews, J. Phys. Chem. A, 1998, 102, 8251, DOI:10.1021/jp982212c.
- W. J. Zheng, X. Li, S. Eustis and K. Bowen, Chem. Phys. Lett., 2008, 460, 68, DOI:10.1016/j.cplett.2008.06.016.
- C. N. Yang, Phys. Rev., 1948, 74, 764, DOI:10.1103/PhysRev.74.764.
- J. Cooper and R. N. Zare, J. Chem. Phys., 1968, 48, 942, DOI:10.1063/1.1668742.
- Z. B. Qin, X. Wu and Z. C. Tang, Rev. Sci. Instrum., 2013, 84, 066108, DOI:10.1063/1.4811739.
- W. C. Wiley and H. Mclaren, Rev. Sci. Instrum., 1955, 26, 1150, DOI:10.1063/1.1715212.
- V. Dribinski, A. Ossadtchi, V. A. Mandelshtam and H. Reisler, Rev. Sci. Instrum., 2002, 73, 2634, DOI:10.1063/1.1482156.
- C. X. Jiao, Z. B. Qin, R. Cong, X. F. Zheng, Z. F. Cui, H. Xie and Z. C. Tang, J. Chem. Phys., 2018, 149, 224302, DOI:10.1063/1.5067006.
- Z. B. Qin, H. Wang, Y. D. Ren, X. F. Zheng, Z. F. Cui and Z. C. Tang, Spectrochim. Acta, Part A, 2018, 188, 85, DOI:10.1016/j.saa.2017.06.039.
- M. J. Frisch, G. W. Trucks, H. B. Schlegel, et al., Gaussian 09, Revision D.01, 2009 Search PubMed.
- A. D. Becke, J. Chem. Phys., 1993, 98, 5648, DOI:10.1063/1.464913.
- C. Lee, W. T. Yang and R. G. Parr, Phys. Rev. B: Condens. Matter Mater. Phys., 1988, 37, 785, DOI:10.1103/PhysRevB.37.785.
- P. J. Hay and W. R. Wadt, J. Chem. Phys., 1985, 82, 299, DOI:10.1063/1.448975.
- L. E. Roy, P. J. Hay and R. L. Martin, J. Chem. Theory Comput., 2008, 4, 1029, DOI:10.1021/ct8000409.
- K. A. Peterson and C. Puzzarini, Theor. Chem. Acc., 2005, 114, 283, DOI:10.1007/s00214-005-0681-9.
- R. A. Kendall, T. H. Dunning and R. J. Harrison, J. Chem. Phys., 1992, 96, 6796, DOI:10.1063/1.462569.
- D. E. Woon and T. H. Dunning, J. Chem. Phys., 1993, 98, 1358, DOI:10.1063/1.464303.
- G. E. Scuseria, C. L. Janssen and H. F. Schaefer, J. Chem. Phys., 1988, 89, 7382, DOI:10.1063/1.455269.
- A. E. Reed, L. A. Curtiss and F. Weinhold, Chem. Rev., 1988, 88, 899, DOI:10.1021/cr00088a005.
- T. Lu and F. W. Chen, J. Comput. Chem., 2012, 33, 580, DOI:10.1002/jcc.22885.
- K. M. Ervin, T. M. Ramond, G. E. Davico, R. L. Schwartz, S. M. Casey and W. C. Lineberger, J. Phys. Chem. A, 2001, 105, 10822, DOI:10.1021/jp011779h.
Footnotes |
| † Electronic supplementary information (ESI) available: Table S1, Fig. S1 and S2. See DOI: 10.1039/d0ra07583c |
| ‡ Jiangle Zhang and Shanjun Chen contributed equally to this work. |
|
| This journal is © The Royal Society of Chemistry 2020 |
Click here to see how this site uses Cookies. View our privacy policy here.  Open Access Article
 *b,
Xingtai Qiua,
Jingxiong Yua,
Yuwan Chena and
Zichao Tang*a

 . A particular atomic orbital coefficient is concluded upon satisfying the normalization condition (cs2 + cp2 + cd2 = 1). As an example of this method, the VO2 molecular orbital is constructed of cs2 = 0.78, cp2 = 0.02 and cd2 = 0.20 atomic orbital coefficients. Enumerating the four most possible combination results for the hypothetical β-waves


![[thin space (1/6-em)]](https://www.rsc.org/images/entities/char_2009.gif) 000 to 50
000 to 50![[thin space (1/6-em)]](https://www.rsc.org/images/entities/char_2009.gif) 000 laser shots at a repetition rate of 10 Hz. The original 3D distribution was reconstructed using the Basis Set Expansion (BASEX) inverse Abel transform method,28 and the photoelectron spectrum was acquired. The photoelectron kinetic energy spectra were calibrated by the known spectrum of atomic anions (such as Au). The resolution of the photoelectron spectrometer was about 50 meV at the electron kinetic energy of 1 eV. Another advantage of photoelectron imaging is its capability of measuring the PADs associated with each vibronic transition. The related fitting formula and physical meaning of β can be found in the previous studies.29,30
000 laser shots at a repetition rate of 10 Hz. The original 3D distribution was reconstructed using the Basis Set Expansion (BASEX) inverse Abel transform method,28 and the photoelectron spectrum was acquired. The photoelectron kinetic energy spectra were calibrated by the known spectrum of atomic anions (such as Au). The resolution of the photoelectron spectrometer was about 50 meV at the electron kinetic energy of 1 eV. Another advantage of photoelectron imaging is its capability of measuring the PADs associated with each vibronic transition. The related fitting formula and physical meaning of β can be found in the previous studies.29,30


