 Open Access Article
Development of an efficient CVD technique to prepare TiO2/porous–carbon nanocomposites for high rate lithium-ion capacitors
Shinichiroh Iwamura *a,
Shota Motohashib and
Shin R. Mukai
 a
a
aHokkaido University, Faculty of Engineering, N13W8, Kita-ku, Sapporo 060-6828, Japan. E-mail: iwamura@eng.hokudai.ac.jp
bGraduate School of Chemical Sciences and Engineering, Hokkaido University, N13W8, Kita-ku, Sapporo 060-6828, Japan
First published on 16th October 2020
Abstract
Titanium dioxide is a promising electrode material for lithium-ion capacitors. When using TiO2 as an electrode material, it is necessary to combine it with carbon at the nanometer level to improve its low electrical conductivity and low reactivity with Li+. However, preparation methods of reported TiO2/porous–carbon nanocomposites are generally not cost-effective, and their productivities are low. In this study, the vacuum liquid-pulse chemical vapor deposition (VLP-CVD) technique was developed to easily prepare TiO2/porous–carbon nanocomposites, where TiO2 nanoparticles with a diameter of ∼4 nm could be homogeneously deposited inside the pores of meso- or macroporous carbons. Because the deposited TiO2 nanoparticles had access to effective electrically conductive paths formed by the porous–carbon substrate, they showed a high discharge capacity of ∼200 mA h g−1-TiO2 (based on TiO2 weight). In particular, the composite prepared from macroporous carbon showed an extremely high rate performance, where 50% of the discharge capacity was retained at a current density of 15![[thin space (1/6-em)]](https://www.rsc.org/images/entities/char_2009.gif) 000 mA g−1 when compared to that measured at 50 mA g−1. In addition, the composite also showed very high cyclability, where 80% of the discharge capacity was retained at the 10
000 mA g−1 when compared to that measured at 50 mA g−1. In addition, the composite also showed very high cyclability, where 80% of the discharge capacity was retained at the 10![[thin space (1/6-em)]](https://www.rsc.org/images/entities/char_2009.gif) 000th cycle. Because the VLP-CVD technique can be performed using simple apparatus and commercially available starting materials, it can be expected to boost industrial production of TiO2/porous–carbon for lithium-ion capacitors.
000th cycle. Because the VLP-CVD technique can be performed using simple apparatus and commercially available starting materials, it can be expected to boost industrial production of TiO2/porous–carbon for lithium-ion capacitors.
1 Introduction
Lithium-ion capacitors (LICs) are attracting much attention for their potential roles in various future applications because they can achieve an energy density like lithium-ion batteries as well as a power density like electrical double-layer capacitors. LICs are generally constructed from a porous–carbon cathode and a graphitic-carbon anode. Their energy density can be increased to values higher than that of supercapacitors because the graphitic-carbon anode can electrochemically react with Li+ and therefore has a larger electron-storage capacity than the porous–carbon cathodes used in supercapacitors. On the other hand, the charge and discharge potential of graphitic carbon is close to the potential for metal-lithium deposition and electrolyte decomposition.1 It is therefore difficult to repeatedly use graphitic carbon at high rates like supercapacitors. In order to develop LICs which show higher rate and better cycling performances, stable anode materials are required.Titanium dioxide (TiO2) is one of the candidate materials for the anode of LICs. When TiO2 is used as an anode, metal Li deposition and electrolyte decomposition hardly occur because it reacts with Li+ at a potential of ∼1.5 V vs. Li/Li+.2–5 While its Li-storage capacity and operating potential are respectively lower and higher than those of a graphite anode, its Li-storage capacity is sufficiently large for a supercapacitor electrode. However, its low electrical conductivity and low reactivity with Li+ hamper the use of TiO2 as an electrode material. Combining TiO2 with a carbon material at the nanometer level is an effective approach to solve these problems.2
Composites of TiO2 and carbon have frequently been reported as electrode materials, and some of them, such as TiO2/carbon nanotubes composites,6–11 TiO2/reduced graphene composites,7,12–18 macroporous TiO2/carbon composites,19 TiO2 nanocrystals/carbon cloth composites,20 and TiO2/porous carbon composites,21 show high anode performances. Producing these materials generally requires expensive precursors and/or processes with low productivity. For their industrial production, preparation methods with a high productivity must be developed. Our group has recently reported that efficient production of TiO2/C nanocomposites can be achieved by using the liquid pulse injection technique.22 In this process, highly concentrated Ti and carbon sources are simultaneously introduced into a tubular reactor, and carbon-coated TiO2 nanoparticles with TiO2 contents above 90% can be obtained. While the resulting nanocomposite shows a high discharge capacity, it is difficult to improve its rate performance because the lower limit of its particle size is ∼20 nm. In order to produce a TiO2/C nanocomposite as an anode material for LICs, the particle size of TiO2 must be further decreased, even at the expense of TiO2 content, because the rate performance of an LIC is more important than its capacity.
To prepare composites which include TiO2 nanoparticles with an extremely small diameter, an effective method is to homogeneously deposit TiO2 nanoparticles with an extremely small diameter on a carbon substrate using chemical vapor deposition (CVD). Various CVD techniques have been reported for the deposition of TiO2 nanolayers or nanoparticles. Generally, these techniques can only be used to deposit TiO2 on plate substrates23–25 or on the outer surface of powder samples.26,27 Atomic layer deposition, which is a type of CVD technique, can be used for TiO2 deposition on some nanocarbon substrates. However, this technique requires multiple operation steps and can be applied for TiO2 deposition only on substrates with a large outer surface, such as graphenes7,17,18 and CNTs.7,11 In contrast, simple CVD techniques applicable to various carbon substrates, including porous carbons, can be regarded as highly productive and widely usable techniques if the carbon substrate only needs to be placed in the reactor and the precursor gas is only required to be simply fed to the reactor chamber. For example, using an organic vapor or silane gas as the precursor, carbon nanolayers28–30 or Si nanoparticles,31,32 respectively, can be homogeneously deposited on a porous substrate. As in the cases of deposition of carbon and Si, TiO2 nanolayers or nanoparticles can also be deposited on porous carbon substrates through the thermal decomposition of a vaporized Ti source. Needless to say, material cost can also be largely reduced if commercially available inexpensive porous carbons can be used as the substrate. However, it is difficult to homogeneously deposit a sufficient amount of TiO2 inside the nanostructure of porous carbons because the vapor pressure of most Ti sources is usually too low at low temperatures and the reactivity of them is too high at high temperatures.
For homogeneous deposition inside nanostructures of porous substrates, the pressure-pulse CVD (or chemical vapor impregnation) technique has been developed.33–37 In this technique, the initial source vapor is momentarily injected into an evacuated and heated reactor that holds the substrate. The injected vapor then diffuses into the nanostructure of the substrate, and nanolayers or nanoparticles can be homogeneously deposited. Even when this technique is employed, it is difficult to deposit a sufficient amount of TiO2 because of the low vapor pressure of Ti sources. In this study, a new CVD technique, vacuum liquid pulse (VLP) CVD technique, was developed, where Ti sources were injected as liquid pulses into a reactor maintained under vacuum. A highly concentrated Ti source vapor can be momentarily generated around the evacuated and heated porous carbon substrate, which allows the vapor to homogeneously diffuse into the substrate. To evaluate the potential of this technique as a practical production process for nanocomposites, the differences between the VLP-CVD technique and conventional continuous CVD techniques were investigated, and the effects of the porous structure of the carbon substrate were examined. Based on the structural analysis of the obtained TiO2/porous–carbon nanocomposites and evaluation of the performance of the nanocomposites as electrodes, the mechanism of TiO2 introduction and potential applications of the nanocomposites are discussed.
2 Experimental
2.1 Sample preparation
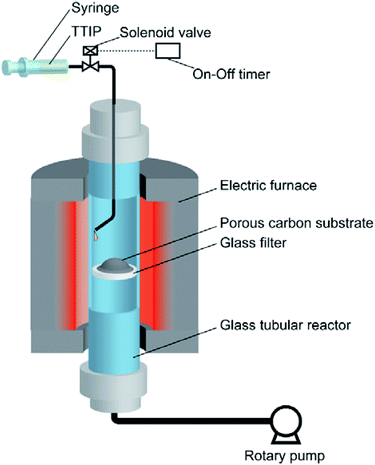
To prepare TiO2/porous–carbon nanocomposites using the VLP-CVD technique, an experimental apparatus was assembled as shown in Fig. 1. A glass tubular reactor (inner diameter: 13 mm; length: 600 mm) equipped with a glass filter at its center was placed in an electric furnace (ARF-30K, Asahi Rika). A syringe filled with a liquid Ti source was connected to the top of the reactor through a solenoid valve. At the bottom of the reactor, a rotary pump (GLD-051, Ulvac) was connected through a cold trap. Titanium tetraisopropoxide (TTIP; 99.9%, Wako Pure Chemical Ind.) was used as the Ti source. Commercially available porous carbons with different pore structures were used as the porous carbon substrate: A-BAC (C(2), average pore diameter: 2 nm, Kureha Co.); Cnovel MH (C(4), average pore diameter: 4 nm, Toyo Tanso Co.); Cnovel MJ(4)030 (C(30), average pore diameter: 30 nm, Toyo Tanso Co.); Cnovel MJ(4)150 (C(150), average pore diameter: 150 nm, Toyo Tanso Co.).After 200 mg of the porous carbon substrate was placed on the glass filter, the reactor was set into the electric furnace, connected with the top and bottom caps, and heated to 180 °C under vacuum. At this temperature, the solenoid valve was opened for 0.1 s by using an on-off timer to draw TTIP into the reactor, and this injection was repeated 100 times at intervals of 1 min. In this condition, 50 μL of TTIP was injected into the reactor as a liquid pulse for every injection. The injected TTIP was rapidly heated and vaporized. The resulting highly concentrated TTIP vapor can smoothly penetrate into the evacuated porous carbon substrate. Through this process, TiO2 nanoparticles were deposited on/in the porous carbon substrate by thermal decomposition of TTIP. The obtained sample was then heat-treated at 700 °C for 1 h under a N2 flow (100 mL min−1), using another tubular reactor to complete the decomposition reaction and increase the crystallinity of TiO2. The samples obtained using different porous carbon substrates are hereafter denoted by TiO2 followed by the abbreviation of the porous carbon, e.g., TiO2/C(4), TiO2/C(30), TiO2/C(150).
For comparison, TiO2 was also deposited on/in C(150) using a conventional continuous CVD technique: TTIP was continuously introduced into the reactor at a rate of 100 μL min−1 for 100 min along with a N2 flow (100 mL min−1, continuous-flow CVD) or under vacuum (continuous-vacuum CVD). The obtained samples were also heat-treated at 700 °C for 1 h.
2.2 Characterization
For the comparison of different TiO2/C nanocomposites, all samples were used after heat-treatment at 700 °C for 1 h. The nanostructure of the samples was observed using a transmission electron microscope (TEM; JEM2100, JEOL) and a field-emission scanning electron microscope (SEM; JEM7500F, JEOL). The crystal structure of the samples was analyzed using a X-ray diffractometer (XRD; Ultima IV, Rigaku) operated at 30 kV and 40 mA using a Si non-reflective sample holder. The TiO2 content of each sample was calculated from the weight change which occurred between 100 and 800 °C when the samples were heat treated under an air flow in a thermogravimeter (TG) (DTG-50H, Shimadzu). The porous properties of the samples were evaluated through N2 adsorption experiments using an autoadsorber (BELSORP mini, Microtrac Bel Co.) after pretreatment at 250 °C for 6 h under a N2 flow of 100 mL min−1. From the obtained isotherms, the specific surface area (SBET) of each sample was calculated using the Brunauer–Emmett–Teller (BET) method. Micropore volumes (Vmicro) were calculated using the Dubinin–Radushkevich (DR) method. Using Vmicro and total pore volumes calculated at relative pressures of P/P0 = 0.96 (V0.96) and 0.99 (V0.99), mesopore volumes (Vmeso = V0.96 − Vmicro) and macropore volumes (Vmacro = V0.99 − V0.96) were then obtained.2.3 Electrochemical measurements
The samples were mixed with carbon black (CB; Denka Black, Denka Co.) and polyvinylidene fluoride (PVDF; KF polymer #1120, Kureha Co.) at a weight ratio of sample![[thin space (1/6-em)]](https://www.rsc.org/images/entities/char_2009.gif) :
:![[thin space (1/6-em)]](https://www.rsc.org/images/entities/char_2009.gif) CB
CB![[thin space (1/6-em)]](https://www.rsc.org/images/entities/char_2009.gif) :
:![[thin space (1/6-em)]](https://www.rsc.org/images/entities/char_2009.gif) PVDF = 8
PVDF = 8![[thin space (1/6-em)]](https://www.rsc.org/images/entities/char_2009.gif) :
:![[thin space (1/6-em)]](https://www.rsc.org/images/entities/char_2009.gif) 1
1![[thin space (1/6-em)]](https://www.rsc.org/images/entities/char_2009.gif) :
:![[thin space (1/6-em)]](https://www.rsc.org/images/entities/char_2009.gif) 1, using N-methyl-2-pyrrolidone (99.9%, Wako Pure Chemical Ind.) as the solvent. The obtained slurries were coated on copper foils. After drying, the foils were cut into disks with a diameter of 16 mm where ca. 2 mg of the sample was loaded. Three electrode cells (Toyo System Co.) were assembled using the obtained disks as the working electrode, lithium foil (Honjo Metal Co.) as the counter and reference electrodes, and 1 M LiPF6 in an ethylene carbonate and diethyl carbonate (EC–DEC) mixture (EC
1, using N-methyl-2-pyrrolidone (99.9%, Wako Pure Chemical Ind.) as the solvent. The obtained slurries were coated on copper foils. After drying, the foils were cut into disks with a diameter of 16 mm where ca. 2 mg of the sample was loaded. Three electrode cells (Toyo System Co.) were assembled using the obtained disks as the working electrode, lithium foil (Honjo Metal Co.) as the counter and reference electrodes, and 1 M LiPF6 in an ethylene carbonate and diethyl carbonate (EC–DEC) mixture (EC![[thin space (1/6-em)]](https://www.rsc.org/images/entities/char_2009.gif) :
:![[thin space (1/6-em)]](https://www.rsc.org/images/entities/char_2009.gif) DEC = 1
DEC = 1![[thin space (1/6-em)]](https://www.rsc.org/images/entities/char_2009.gif) :
:![[thin space (1/6-em)]](https://www.rsc.org/images/entities/char_2009.gif) 1, Kishida Chemical Co.) as the electrolyte. The cells were galvanostatically charged and discharged between 1.0 and 2.5 V vs. Li/Li+ using a charge/discharge apparatus (charge/discharge system HJ1001SD8, Hokuto Denko Co.). Note that the current densities were calculated based on the total weight of the composite samples.
1, Kishida Chemical Co.) as the electrolyte. The cells were galvanostatically charged and discharged between 1.0 and 2.5 V vs. Li/Li+ using a charge/discharge apparatus (charge/discharge system HJ1001SD8, Hokuto Denko Co.). Note that the current densities were calculated based on the total weight of the composite samples.
3 Results and discussion
3.1 Effect of the CVD technique used for synthesis
To investigate the effect of the type of CVD technique used for sample synthesis, the nanostructure of the samples after CVD were analyzed. Among porous carbons, C(150) was selected as the substrate for this investigation because the homogeneous deposition of TiO2 is expected more than cases using other carbons owing to their pore size. TG analysis shows that the TiO2 content of samples prepared through each CVD technique was nearly the same and was around 40 wt%. Fig. 2 shows SEM and TEM images of C(150) and the composites prepared from it. The SEM images do not show any differences between the samples prior to and after CVD, indicating that each CVD technique allowed the deposition of TiO2 inside the C(150) substrate. To investigate their inner structure, the samples were observed by a TEM (Fig. 2e–h). The TiO2 nanoparticles deposited by continuous-flow CVD (Fig. 2f) and continuous-vacuum CVD (Fig. 2g) were not uniform, and their particle size varied according to the position of observation. Fig. 2f and g, which are TEM images showing the near edge region of representative sample particles, show that most of the TiO2 particles in this region were around 20 nm in size. In contrast, regardless of the position of observation, the TiO2 nanoparticles deposited by the VLP-CVD technique were uniform, with a small diameter of ∼4 nm.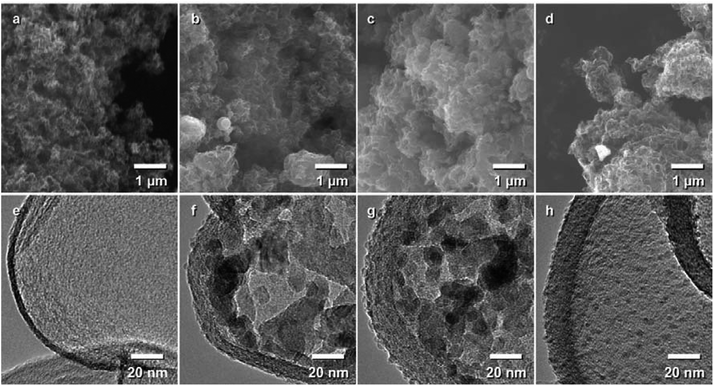 | ||
| Fig. 2 (a–d) SEM and (e–h) TEM images of C(150) samples. (a and e) C(150) prior to CVD; C(150) after (b and f) continuous-flow CVD, (c and g) continuous-vacuum CVD, and (d and h) VLP-CVD. | ||
Fig. 3 shows the XRD patterns of C(150) prior to and after CVD. In the patterns of the samples prepared by continuous CVD, sharp anatase peaks along with rutile peaks can be seen. For electrode applications, anatase TiO2 is generally preferred over than rutile TiO2.1,2 On the other hand, only broad anatase peaks appear in the XRD pattern of the sample prepared by VLP-CVD. Using the Scherrer equation, the crystallite size of TiO2 in the samples prepared by VLP-CVD was calculated to be 4.0 nm. This size is similar to the particle size obtained through TEM observation, indicating that the particles shown in the TEM image have the typical size of the particles in the sample. These results confirm that small TiO2 nanoparticles can be homogeneously deposited within the pores of a porous carbon by VLP-CVD. In contrast, the crystallite size of the samples prepared by continuous-flow CVD and continuous-vacuum CVD were 150 and 140 nm, respectively, which are considerably higher than the particle sizes observed by TEM. This is because TiO2 particles larger than those observed by TEM are deposited near the outer surface of the porous carbon particles when continuous-flow CVD or continuous-vacuum CVD is used. In addition, these results suggest that the homogeneous deposition of small TiO2 nanoparticles by continuous-flow CVD or continuous-vacuum CVD is more difficult when porous carbons with smaller pores than that of C(150) are used as the substrate.
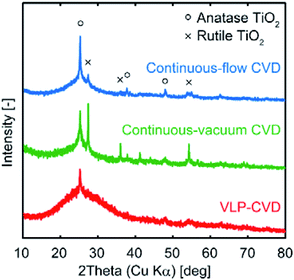 | ||
| Fig. 3 XRD patterns of TiO2/C nanocomposites prepared from C(150) using continuous-flow CVD, continuous-vacuum CVD, and VLP-CVD. | ||
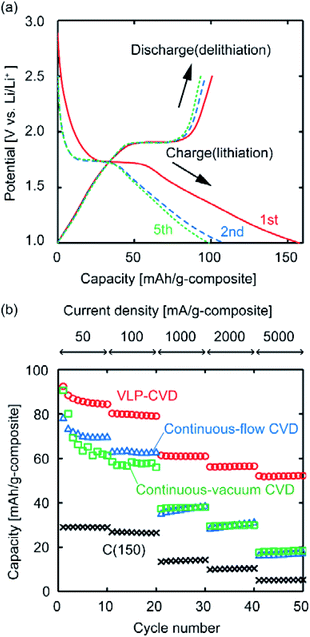
To investigate how the state of the deposited TiO2 affects the performance of the composites when used as anodes, electrochemical measurements were conducted. Fig. 4a shows charge–discharge curves of the C(150) sample after VLP-CVD. It can be confirmed that the charge and discharge curves have plateaus at around 1.7 V vs. Li/Li+ and 1.9 V vs. Li/Li+, respectively, indicating that TiO2 electrochemically reacts with Li+.1–3,38 As the discharge capacity is significantly lower than the charge capacity in the 1st cycle, the 1st cycle coulombic efficiency of this composite is not high. Since pre-doping of Li is necessary to utilize this sample as a LIC anode, this problem can be easily avoided by modifying pre-doping conditions. The charge and discharge capacities at the 2nd and 5th cycles indicate high coulombic efficiency and small capacity fading, suggesting that the sample could be steadily charged and discharged. The obtained capacity is too small for a LIB but sufficient for a LIC. Fig. 4b shows the discharge capacities of C(150) samples prepared by different CVD techniques measured at various current densities. While the discharge capacity of C(150) measured at a low current density was ∼30 mA h g−1, the discharge capacities of all samples after CVD largely increased, indicating that the Li-storage capacity of TiO2 could be utilized. However, the discharge capacities of the sample obtained by VLP-CVD at low current densities were ∼10 mA h g−1 higher than those of samples prepared by continuous CVD. This difference further increased with increasing current density. At a current density of 5000 mA g−1, the discharge capacities of the samples prepared by VLP-CVD and continuous CVD were 50 and 20 mA h g−1, respectively. These results indicate that the large TiO2 nanoparticles deposited by continuous CVD can be charged/discharged at low current densities but many of them cannot be done at high current densities. In contrast, the small TiO2 nanoparticles deposited by VLP-CVD can be charged/discharged even at high current densities because they had a large surface area that was in contact with the electrolyte, and also that they were effectively connected to the conductive network formed by the substrate carbon.
3.2 Effect of the porous structure of the carbon substrate
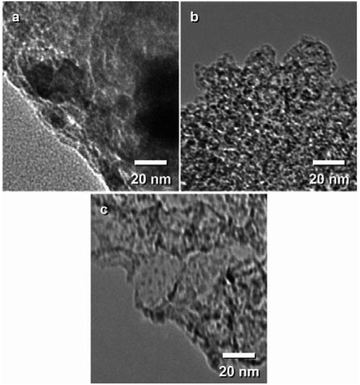
Since it was confirmed that the VLP-CVD technique is superior to other CVD techniques for TiO2 deposition on/in porous carbons, the effects of the porous structure of the carbon substrate were investigated using samples synthesized using this technique. The TiO2 content of samples prepared using various porous–carbon substrates by VLP-CVD is shown in Table 1. The TiO2 content increased with increasing pore size of the porous–carbon substrate. In particular, TiO2/C(30) and TiO2/C(150), both of which had very large pores, had almost the same TiO2 content, indicating that TTIP vapor smoothly diffused into the large pores of the carbon substrate, resulting in a large amount of TiO2 deposition within their pores. TiO2 deposited in the samples were observed by TEM. Fig. 5a shows a TEM image of TiO2/C(2), indicating TiO2 nanoparticles with a diameter of around 20 nm deposited on C(2). Because the pore size of C(2) is much smaller than the particle size, the TiO2 nanoparticles were probably deposited on the outer surface of C(2) particles. Fig. 5b and c show TEM images of TiO2/C(4) and TiO2/C(30), respectively. From these images, it can be found that TiO2 nanoparticles with a diameter of several nm were homogeneously deposited in C(4) and C(30). Because their particle size was smaller than the pore size of C(4) and C(30), they suggest that TTIP vapor was smoothly penetrated and TiO2 nanoparticles were deposited in the pores.| SBET [m2 g−1-carbon] | Vmicro [cm3 g−1-carbon] | Vmeso [cm3 g−1-carbon] | Vmacro [cm3 g−1-carbon] | xTiO2 [wt%] | VTiO2 [cm3 g−1-carbon] | |
|---|---|---|---|---|---|---|
| C(2) | 1326 | 0.58 | 0 | 0 | — | — |
| TiO2/C(2) | 1010 | 0.43 | 0.01 | 0.03 | 25 | 0.09 |
| C(4) | 1600 | 0.80 | 1.08 | 0.12 | — | — |
| TiO2/C(4) | 1080 | 0.59 | 0.59 | 0.12 | 34 | 0.13 |
| C(30) | 844 | 0.45 | 1.75 | 0.36 | — | — |
| TiO2/C(30) | 727 | 0.39 | 1.24 | 0.32 | 41 | 0.18 |
| C(150) | 345 | 0.18 | 0.42 | 0.62 | — | — |
| TiO2/C(150) | 244 | 0.13 | 0.28 | 0.43 | 39 | 0.16 |
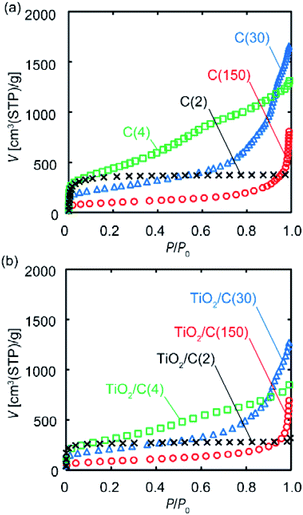
To investigate the porous structure of the samples prior to and after VLP-CVD, their N2 adsorption experiments were conducted. Fig. 6 shows the N2 adsorption isotherms of these samples; the calculated SBET and pore volumes are summarized in Table 1. For the C(2), C(4), and C(30) samples, the overall shape of their isotherms prior to and after TiO2 deposition is essentially the same, while the volume of adsorbed N2 decreased with the increase in the amount of TiO2 deposition. SBET also decreased with the increase in the amount of TiO2 deposition, suggesting that deposition took place in the pores, possibly blocking them. For the C(2) samples, the decrease in Vmicro was similar to the volume of the deposited TiO2. Considering the result of TEM observation, this result indicates that some of TiO2 particles were deposited inside the micropores of C(2), and the others were deposited on the outer surface and plugged the entrance of the micropores. The volume of TiO2 deposited on C(4) was smaller than those of the decrease in Vmicro and Vmeso. This result suggests that TiO2 particles plugged the entrance of the micropores and mesopores. In contrast, the relationship between the amount of TiO2 deposition and the decreases in the pore volumes of C(30) and C(150) samples cannot be found. This is probably because TiO2 nanoparticles were mainly deposited in the macropores or large mesopores of the substrates, and the deposited TiO2 blocked the entrance of micropores and small mesopores.
Fig. 7 summarizes the results of charge–discharge tests of these samples. The capacities of the carbon substrates were not large because Li+ cannot intercalate into the graphene sheets of the porous carbons in the potential range of the charge–discharge tests (Fig. 7a). The capacity of all the porous–carbon substrates used in this work originated from the formation of electric double layers on the surfaces of their pores. Nevertheless, discharge capacities of C(2), which had the largest SBET among the substrates, were very small, suggesting that the diffusivity of the electrolyte in the small pores of C(2) was too small to enable the utilization of the entire surface of the pores. From the discharge capacities of the samples after TiO2 deposition, shown in Fig. 7b, TiO2/C(4), TiO2/C(30) and TiO2/C(150) were estimated to have discharge capacities of ∼90 mA h g−1 at low current densities, confirming that the Li-storage ability of TiO2 in the samples was utilized. To determine whether the ability of TiO2 for Li storage was used effectively, discharge capacities originating from TiO2 (CTiO2 [mA h g−1]) were calculated from the TiO2 content (xTiO2 [wt%]) in the composites and the discharge capacities of the composite (Ccomposite [mA h g−1]) and the carbon substrate (Ccarbon [mA h g−1]) using the following equation:
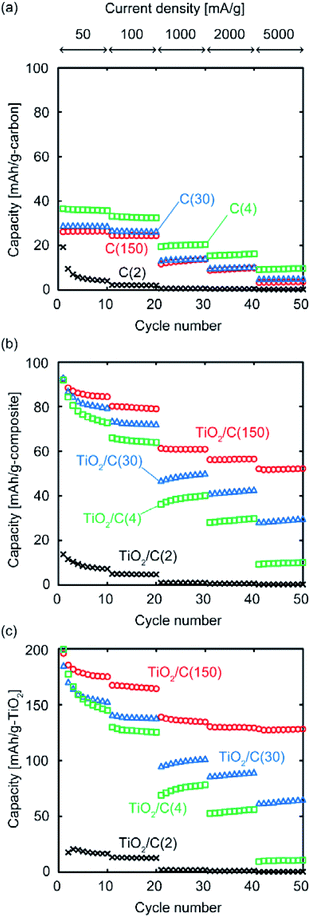 | ||
| Fig. 7 Discharge capacities of (a) porous carbon substrates, (b) TiO2/porous–carbon nanocomposites prepared by VLP-CVD, and (c) TiO2 nanoparticles in the composites. | ||
Fig. 7c shows the CTiO2 values calculated using this equation. At low current densities, discharge capacities of 150–200 mA h g−1 were obtained from TiO2 residing in TiO2/C(4), TiO2/C(30), and TiO2/C(150). Considering that the practical capacity of anatase TiO2 is generally ∼200 mA h g−1,2,3 the storage ability of TiO2 in these samples was efficiently utilized probably because of the effective conductive paths provided by their porous–carbon substrate. In contrast, the CTiO2 value of TiO2/C(2) was much lower than that of other composite samples, indicating that the aggregated TiO2 particles deposited on the outer surface of C(2) do not have sufficient electrically conductive path and surface area contacting with the electrolyte, and hardly contributed to Li storage.
For the three samples in which TiO2 effectively contributed to Li storage, capacities varied when the current density was increased. The discharge capacities of TiO2/C(4) and TiO2/C(30) decreased with the increase in current density, reaching 10 and 30 mA h g−1, respectively, at 5000 mA g−1. While the discharge capacity of TiO2/C(150) also decreased with the increase in current density, a discharge capacity of 50 mA h g−1 could still be maintained at a very high current density of 5000 mA h g−1. While TiO2 nanoparticles in TiO2/C(4) and TiO2/C(30) are homogeneously distributed similarly to those in TiO2/C(150), the pore sizes of their porous carbon substrates are significantly different. Thus, this high rate performance is attributed not only to the effective electrically conductive paths in the composites, but also to the high diffusibility of the electrolyte solution in their large pores of C(150).
3.3 Mechanism of TiO2 deposition during the VLP-CVD process
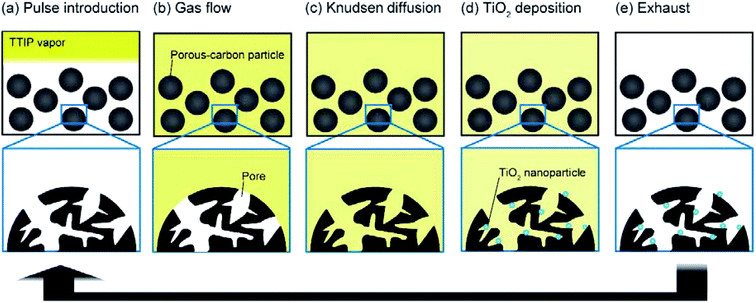
Based on the above results, the mechanism of TiO2 deposition during the VLP-CVD process can be verified. The TTIP injected into the reactor as liquid pulses first makes contact with the heated reactor wall and momentarily vaporizes as heat transfer between liquids and solids rapidly proceeds (Fig. 8a). As the porous–carbon substrates were in the form of particles having sizes of several tens of micrometers, the densely generated TTIP vapor can easily penetrate into the evacuated voids formed between the particles as a fluid flow (Fig. 8b). Since the pore sizes of the porous–carbon substrates are in the range of 2–150 nm, the vapor mainly diffuses within the pores as a Knudsen flow. Thus, the time required for TTIP molecules to diffuse from the surface to the center of the particles can be estimated from experimental conditions such as particle size, pore size, and the concentration of TTIP at the entrance of its pores. In the case of VLP-CVD, TTIP can instantaneously reach the outer surface of the substrate particles, so the concentration of TTIP at the entrance of the pores of the substrate can be rapidly increased. This allows the smooth introduction of TTIP into the pores of the substrate. As the results presented in Section 3.2 suggest, when the pores of the substrate are sufficiently large, TTIP can diffuse to the center of the substrate particle before it is thermally decomposed, resulting in the deposition of small TiO2 particles throughout the substrate particles. In the case of continuous-flow CVD, TTIP is provided to the reactor in a diluted state, and a certain amount of time is required for it to reach the voids formed between the substrate particles. Therefore when it reaches the entrance of the pores, it has already been heated to some extent, so it tends to be easily decomposed near the outer surface of the substrate particles. Such deposited TiO2 also acts as a core for particle growth, so the particles can easily grow to sizes up to a few tens of nanometers, as shown in Fig. 2f. As similarly large TiO2 particles were found in the TEM images of samples obtained by continuous-vacuum CVD, it can be concluded that the high TTIP concentration at the pore inlets of the substrate particles, which is attainable through pulsed-liquid introduction, was extremely effective for rapid introduction of TTIP into the pores. Furthermore, the continuously evacuated environment during the VLP-CVD process also effectively prevented deposition of TiO2 on the outer surface of the porous–carbon substrates (Fig. 8e).3.4 Anode performance of TiO2/C(150)
Among the TiO2/porous–carbon composites prepared in this study, TiO2/C(150) showed the highest electrode performance. Using this sample, its potential as an anode was evaluated in more detail. Fig. 9 shows the results of a rate performance test continued up to a current density of 15![[thin space (1/6-em)]](https://www.rsc.org/images/entities/char_2009.gif) 000 mA g−1, and a cycling test repeated 10
000 mA g−1, and a cycling test repeated 10![[thin space (1/6-em)]](https://www.rsc.org/images/entities/char_2009.gif) 000 times. Fig. 9a shows that almost half of the discharge capacity at low current densities can be maintained even at 15
000 times. Fig. 9a shows that almost half of the discharge capacity at low current densities can be maintained even at 15![[thin space (1/6-em)]](https://www.rsc.org/images/entities/char_2009.gif) 000 mA g−1. While a series of TiO2-based materials with such high rate performance was previously reported, the preparation of these nanocomposites generally requires methods with low productivity, expensive starting materials, or both.6–19 Although TiO2/C(150) was prepared from commercially-available materials through the VLP-CVD technique, which only involved simple operations in a tubular reactor, it showed a rate performance that was similar to those of the reported materials. In addition, TiO2/C(150) exhibited an extremely high cyclability as a chemically reactive electrode, where 80% of its initial capacity could be maintained at the 10
000 mA g−1. While a series of TiO2-based materials with such high rate performance was previously reported, the preparation of these nanocomposites generally requires methods with low productivity, expensive starting materials, or both.6–19 Although TiO2/C(150) was prepared from commercially-available materials through the VLP-CVD technique, which only involved simple operations in a tubular reactor, it showed a rate performance that was similar to those of the reported materials. In addition, TiO2/C(150) exhibited an extremely high cyclability as a chemically reactive electrode, where 80% of its initial capacity could be maintained at the 10![[thin space (1/6-em)]](https://www.rsc.org/images/entities/char_2009.gif) 000th cycle (Fig. 9b). Based on the rate and cycling performance of TiO2/C(150), it is expected that the VLP-CVD technique can used for efficient industrial production of TiO2-based electrode materials for LICs.
000th cycle (Fig. 9b). Based on the rate and cycling performance of TiO2/C(150), it is expected that the VLP-CVD technique can used for efficient industrial production of TiO2-based electrode materials for LICs.
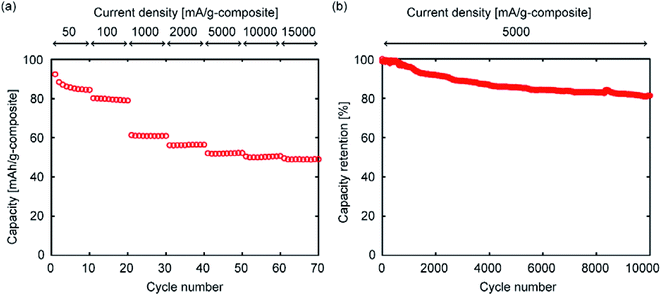 | ||
| Fig. 9 Discharge capacities of TiO2/C(150) measured by (a) rate-performance evaluation and (b) cycling test. | ||
4 Conclusions
In this study, the vacuum liquid-pulse chemical vapor deposition (VLP-CVD) technique was developed to easily deposit small TiO2 nanoparticles inside porous substrates. When the substrates were porous–carbons with meso- or macropores, TiO2 nanoparticles with a diameter around 5 nm were homogeneously deposited inside pores and effective electrically conductive paths could be supplied to the TiO2 nanoparticles. Because of these conductive paths, the Li+-storage capacity of the TiO2 contained in the composites could be efficiently utilized. When the porous–carbon substrate had large macropores, the obtained composite showed an extremely high rate performance as well as high cyclability. It was difficult to industrially produce TiO2 nanocomposites with such high electrode performance because their preparation generally requires processes with low productivity or expensive starting materials, or both. However, the VLP-CVD technique can be performed using a simple apparatus and commercially available starting materials, and it is regarded as a low-cost process that can be easily modified for production on an industrial scale. If adopted by manufacturers, this technique is expected to promote the development of LICs equipped with TiO2 anodes.Conflicts of interest
There are no conflicts to declare.Acknowledgements
The authors wish to thank the members of staff at the Laboratory of TEM observation, Joint-use facilities at Hokkaido University supported by “Nanotechnology Platform” Program of the Ministry of Education, Culture, Sports, Science and Technology (MEXT), Japan. This study was financially supported in part by JSPS KAKENHI (Grant Number 16K18283 and 18K04820).References
- T. Xu, W. Wang, M. L. Gordin, D. Wang and D. Choi, JOM, 2010, 62, 24–30 CrossRef CAS.
- X. Su, Q. Wu, X. Zhan, J. Wu, S. Wei and Z. Guo, J. Mater. Sci., 2012, 47, 2519–2534 CrossRef CAS.
- C. Jiang and J. Zhang, J. Mater. Sci. Technol., 2013, 29, 97–122 CrossRef CAS.
- Z. Chen, I. Belharouak, Y.-K. Sun and K. Amine, Adv. Funct. Mater., 2013, 23, 959–969 CrossRef CAS.
- V. Aravindan, J. Gnanaraj, Y.-S. Lee and S. Madhavi, Chem. Rev., 2014, 114, 11619–11635 CrossRef CAS.
- M. N. Hyder, B. M. Gallant, N. J. Shah, Y. Shao-Horn and P. T. Hammond, Nano Lett., 2013, 13, 4610–4619 CrossRef CAS.
- X. Sun, M. Xie, J. J. Travis, G. Wang, H. Sun, J. Lian and S. M. George, J. Phys. Chem. C, 2013, 117, 22497–22508 CrossRef CAS.
- K. Naoi, T. Kurita, M. Abe, T. Furuhashi, Y. Abe, K. Okazaki, J. Miyamoto, E. Iwama, S. Aoyagi, W. Naoi and P. Simon, Adv. Mater., 2016, 28, 6751–6757 CrossRef CAS.
- G. Tang, L. Cao, P. Xiao, Y. Zhang and H. Liu, J. Power Sources, 2017, 355, 1–7 CrossRef CAS.
- L. F. Que, F. D. Yu, Z. B. Wang and D. M. Gu, Small, 2018, 14, 1704508 CrossRef.
- M. Xie, X. Sun, C. Zhou, A. S. Cavanagh, H. Sun, T. Hu, G. Wang, J. Lian and S. M. George, J. Electrochem. Soc., 2015, 162, A974–A981 CrossRef CAS.
- H. Kim, M. Y. Cho, M. H. Kim, K. Y. Park, H. Gwon, Y. Lee, K. C. Roh and K. Kang, Adv. Energy Mater., 2013, 3, 1500–1506 CrossRef CAS.
- C. T. Hsieh, Y. C. Chen, Y. F. Chen, M. M. Huq, P. Y. Chen and B. S. Jang, J. Power Sources, 2014, 269, 526–533 CrossRef CAS.
- H. K. Kim, D. Mhamane, M. S. Kim, H. K. Roh, V. Aravindan, S. Madhavi, K. C. Roh and K. B. Kim, J. Power Sources, 2016, 327, 171–177 CrossRef CAS.
- F. X. Wang, C. Wang, Y. J. Zhao, Z. C. Liu, Z. Chang, L. J. Fu, Y. S. Zhu, Y. P. Wu and D. Y. Zhao, Small, 2016, 12, 6207–6213 CrossRef CAS.
- Y. Zhao, H. Zhang, A. Liu, Y. Jiao, J. J. Shim and S. Zhang, Electrochim. Acta, 2017, 258, 343–352 CrossRef CAS.
- C. Ban, M. Xie, X. Sun, J. J. Travis, G. Wang, H. Sun, A. C. Dillon, J. Lian and S. M. George, Nanotechnology, 2013, 24, 424002 CrossRef.
- X. Sun, M. Xie, G. Wang, H. Sun, A. S. Cavanagh, J. J. Travis, S. M. George and J. Lian, J. Electrochem. Soc., 2012, 159, A364–A369 CrossRef CAS.
- G. Lui, G. Li, X. Wang, G. Jiang, E. Lin, M. Fowler, A. Yu and Z. Chen, Nano Energy, 2016, 24, 72–77 CrossRef CAS.
- R. Tjandra, G. Li, X. Wang, J. Yan, M. Li and A. Yu, RSC Adv., 2016, 6, 35479–35485 RSC.
- C. Yang, J. L. Lan, W. X. Liu, Y. Liu, Y. H. Yu and X. P. Yang, ACS Appl. Mater. Interfaces, 2017, 9, 18710–18719 CrossRef CAS.
- S. Iwamura, K. Fujita, R. Iwashiro and S. R. Mukai, Mater. Today Commun., 2018, 14, 15–21 CrossRef CAS.
- A. Mills, N. Elliott, I. P. Parkin, S. A. O'Neill and R. J. Clark, J. Photochem. Photobiol., A, 2002, 151, 171–179 CrossRef CAS.
- K. S. Yeung and Y. W. Lam, Thin Solid Films, 1983, 109, 169–178 CrossRef CAS.
- S. K. Pradhan, P. J. Reucroft, F. Yang and A. Dozier, J. Cryst. Growth, 2003, 256, 83–88 CrossRef CAS.
- Z. Ding, X. Hu, P. L. Yue, G. Q. Lu and P. F. Greenfield, Catal. Today, 2001, 68, 173–182 CrossRef.
- H. Yoshitake, T. Sugihara and T. Tatsumi, Chem. Mater., 2002, 14, 1023–1029 CrossRef CAS.
- T. Kyotani, T. Nagai, S. Inoue and A. Tomita, Chem. Mater., 1997, 9, 609–615 CrossRef CAS.
- T. Kyotani, L. F. Tsai and A. Tomita, Chem. Mater., 1996, 8, 2109–2113 CrossRef CAS.
- H. Nishihara, T. Simura, S. Kobayashi, K. Nomura, R. Berenguer, M. Ito, M. Uchimura, H. Iden, K. Arihara, A. Ohma, Y. Hayasaka and T. Kyotani, Adv. Funct. Mater., 2016, 26, 6418–6427 CrossRef CAS.
- A. Esmanski and G. A. Ozin, Adv. Funct. Mater., 2009, 19, 1999–2010 CrossRef CAS.
- A. Magasinski, P. Dixon, B. Hertzberg, A. Kvit, J. Ayala and G. Yushin, Nat. Mater., 2010, 9, 353–358 CrossRef CAS.
- H. J. Jeong, H. D. Park, J. D. Lee and J. O. Park, Carbon, 1996, 34, 417–421 CrossRef CAS.
- Y. Ohzawa, M. Mitani, T. Suzuki, V. Gupta and T. Nakajima, J. Power Sources, 2003, 122, 153–161 CrossRef CAS.
- Y. Ohzawa, Y. Yamanaka, K. Naga and T. Nakajima, J. Power Sources, 2005, 146, 125–128 CrossRef CAS.
- S. Iwamura, H. Nishihara and T. Kyotani, J. Power Sources, 2013, 222, 400–409 CrossRef CAS.
- K. Nueangnoraj, H. Nishihara, K. Imai, H. Itoi, T. Ishii, M. Kiguchi, Y. Sato, M. Terauchi and T. Kyotani, Carbon, 2013, 62, 455–464 CrossRef CAS.
- Z. Weng, H. Guo, X. Liu, S. Wu, K. W. K. Yeung and P. K. Chu, RSC Adv., 2013, 3, 24758–24775 RSC.
| This journal is © The Royal Society of Chemistry 2020 |

