 Open Access Article
Optical and dielectric characteristics of polyethylene oxide/sodium alginate-modified gold nanocomposites
M. O. Farea *ab,
A. M. Abdelghanycd and
A. H. Orabyb
aPhysics Department, Faculty of Science, Ibb University, Yemen
bPhysics Department, Faculty of Science, Mansoura University, Egypt. E-mail: mhd.omar1984@gmail.com; Tel: +201150676870
cSpectroscopy Department, Physics Division, National Research Center, 33 ElBehouth St., Dokki, 12311, Cairo, Egypt
dBasic Science Department, Horus University, International Coastal Rd, New Damietta, Kafr Saad, Damietta Governorate, Egypt
First published on 12th October 2020
Abstract
Films of polyethylene oxide and sodium alginate polymer blend (50/50 wt%) embedded with different quantities of Au nanoparticles with size 3–32 nm were made using the casting process. The nanocomposite films were examined by XRD analysis, FT-IR spectroscopy, TEM, UV/vis spectroscopy, and AC conductivity and dielectric parameter measurements. The XRD spectra revealed the amorphous nature of the prepared films (PEO/SA–Au NPs). From the Fourier transform infrared spectra it can be seem that the intensity of the FT-IR bands decreased which depicted the existence of the interaction between (PEO/SA) virgin polymer and gold nanoparticles. The TEM micrographs showed a cubic-structure for Au NPs with an average size of 15–20 nm. The optical properties of the polymer composite were examined by ultraviolet-visible techniques. In a direct transition the optical energy gap (Eg) of the prepared films is decreased from 4.73 to 2.92 eV and in an indirect transition decreased from 2.95 to 1.50 eV. The dielectric and electrical spectra of the obtained films were examined via dielectric broad-band spectroscopy. The electrical and dielectric measurements are appropriate for the use of the polymer nanocomposite films in the fabrication of electroactive materials.
1 Introduction
Blending polymer products is the latest technique for optimizing different polymer matrices and is a valuable method for producing substances with an extensive diversity of characteristics.1 Polymer characteristics may be improved by combining two or more polymers and/or adding organic/inorganic fillers for use in various applications.2 The melt blending and solvent casting routes are the most common ways for the manufacturing of polymer blends or composites.3Polyethylene oxide (PEO) can be considered as a semi-crystalline polymer with both amorphous and crystalline phases.4 PEO can be distinguished through its high thermal and chemical stability, high viscosity, and non-ionic, heat formative, good water solubility properties.5,6 PEO can also be identified through its flocculent thickening sustained-release lubrication that disperses fibers and retains water. Polyethylene oxide is a simple copolymer matrix that has enteric contacts. To manufacture new polymeric material, the virgin polymer is one of the strongest strategies for producing a new sample with excellent properties that a polymer can not achieve.7
Sodium alginate is a natural polymer, biodegradable, nontoxic, hydrophilicity, biocompatibility, soluble in water, anionic, and low cost. Because of their amorphous nature, SA has been added to PEO to produce the polymer blend which helps to increase the amorphous phases inside PEO. With increasing sodium alginate, the phase separation in the studied samples would also be decreased. Sodium alginate (SA) can interact with polyethylene oxide (PEO) by hydrogen bonding resulting from the existence of hydroxyl groups.8 Because of these previous properties, SA would be used for multiple purposes such as the production of paper, medicinal products, food packaging and electrical equipment.9–12
The formation of metal nanoparticles in the polymeric chain considers a common method for creating a new metal–polymer nanocomposite. The properties of these materials can be changed compared with those of pure polymer.13,14 The incorporation of nanocomposite metal structures into the polymeric chain considers the easiest way to yield advantage of these novel physical characteristics. The incorporated metal nanoparticles into polymer blend are useful for different technological applications, particularly as advanced functional materials (e.g. shielding materials, high energy radiation, optical limiters, microwave absorbers, polarizer's, hydrogen storage systems, sensors, etc.).15
Presented work aims to improve the dielectric and electrical properties of polyethylene oxide and sodium alginate (50/50 wt%) virgin polymer with the incorporation of different concentrations of gold nanoparticles, where there are no studies on the influence of gold nanoparticles on the PEO/SA polymer blend. In addition, the structural and optical characteristics of the obtained thin films are analyzed via XRD, FT-IR and UV/vis spectroscopy. Synthesized materials are suggested to be a good candidate in the diversity of optical claims.
2 Experimental
2.1. Materials
Virgin polyethylene oxide of molecular weight 40![[thin space (1/6-em)]](https://www.rsc.org/images/entities/char_2009.gif) 000 g mol−1 was acquired from ACROS, USA, New Jersey. Sodium alginate of molecular weight Mw ≈ 350
000 g mol−1 was acquired from ACROS, USA, New Jersey. Sodium alginate of molecular weight Mw ≈ 350![[thin space (1/6-em)]](https://www.rsc.org/images/entities/char_2009.gif) 000 g mol−1 supplied by LANXESS Co. The leaf of Chenopodium murale was collected from the Damietta Governorate, Egypt by the end of 2018. Tetrachloroauric acid (HAuCl4·3H2O, 99.7% G.R. for examination) was purchased from Merck, Germany. The DDW solvent (Double Distilled Water) attained from an Organic Chemical Laboratory, was used to solve the polymeric compounds.
000 g mol−1 supplied by LANXESS Co. The leaf of Chenopodium murale was collected from the Damietta Governorate, Egypt by the end of 2018. Tetrachloroauric acid (HAuCl4·3H2O, 99.7% G.R. for examination) was purchased from Merck, Germany. The DDW solvent (Double Distilled Water) attained from an Organic Chemical Laboratory, was used to solve the polymeric compounds.
2.2. Synthesis of gold nanoparticles
Gold nanoparticles were synthesized using Chenopodium murale leaf extract previously discussed.16,17 To ensure reproducibility of the preparation method triplicate samples were prepared at the same condition of temperature and pH values, while average result were recorded which may be result in wide range of particle sizes from 3–32 nm and various shapes.2.3. Preparation of PEO/SA–Au NPs samples
The nanocomposite of (PEO/SA/Au NP's) thin films were synthesized via an ordinary casting route. Polyethylene oxide and sodium alginate were dissolved individually in double distilled water at RT until a homogeneous solution was gained for PEO and SA. Equal amounts of PEO/SA (50/50 wt%) was added to each other and stirred for 8 hours at RT to get a highly homogeneous virgin polymer. Various amount of gold nanoparticles (0.04, 0.08, 0.16, 0.24, 0.32 wt%) was casting to the polymer blend PEO/SA. The obtained solution was poured into polypropylene Petri dishes and dried in the stove for 72 hours at 45 °C so much so the common solvent was evaporated gradually. Then the synthesized thin films were stored in an evacuated desiccators till used to avoid any moisture absorption. The thickness of the nanocomposites thin film was ranging approximately 0.07 nm to 0.09 mm.2.4. Measurements
The structure of the samples was investigated by XRD analysis (PANalyticals X'Pert system, operate at 30 kV, copper Kα, USA) with Bragg's angle range 2θ (3–70°). The functional groups of the prepared samples were performed via FT-IR spectroscopy (Nicolet iS10, USA) with a spectrum range from 4000–400 cm−1. Ultraviolet-visible spectroscopy (V'570 UV-vis NIRS JASCO, Japan) was utilized to investigate the optical properties of the nanocomposite samples with the wavelength range from 190 nm to 1000 nm. The size, shape and the distribution of gold nanoparticles were measured by TEM (JEOL/JEM/1011, Japan). The electrical and dielectric parameters of the obtained samples were analyzed by the dielectric broad-band spectroscopy (Novocontrol's Turnkey, Concepts 40-System) at room temperature in the frequency ranging from (0.1–20) MHz. The values of complex impedance (Z′′), capacitance C and resistance R depend on frequency were performed in parallel circuit operation for the analyzed of the dielectric and electrical spectrum of the nanocomposites films.3 Results and discussion
3.1. XRD
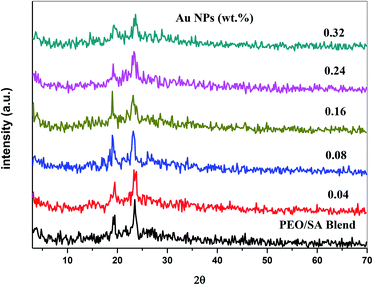
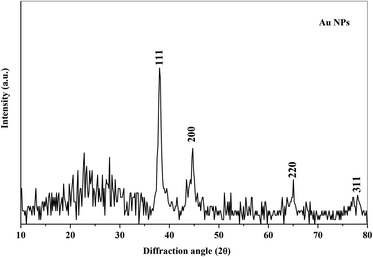
X-ray diffraction technique has been used to analyze the structure of the polymer nanocomposite films. Fig. 1 shows the XRD spectra of the PEO/SA polymer blend and its nanocomposite films. The polymer blend spectrum displays two sharp peaks at about 19° and 23° which depicts the semicrystalline nature of the polymer blend.2 From the X-ray diffraction spectra of PEO/SA/Au NPs, the intensities of the two intrinsic peaks are randomly decreased and the content of amorphous phases was improved as clearly at the two last samples (0.24 and 0.32 Au NPs). This reduction indicates that the degree of crystallinity of polyethylene oxide and sodium alginate is disturbed due to the coordination interactions between the gold nanoparticles and PEO/SA polymer blend as will be illustrated in the FTIR results.Fig. 2 depicts the XRD spectra of the gold nanoparticles. The pattern of Au NPs shows diffraction peaks at 38°, 44°, 65° and 77° that refer to [111], [200], [220] and [311] reflections,18 which depicts the face center cubic (FCC) of the Au structure (JCPDs file number 4-0754).16 As in Fig. 2, there's no detectable peak observable refer to Au NPs for prepared films, which implies the complete dispersion of gold nanoparticles within the virgin polymer PEO/SA.
These results indicate the existence of gold nanoparticles inside the structure of the virgin polymer and indicate that the electrostatic interaction of this nanofiller with the polymer blend (SA/PEO) matrix disturbs its crystalline areas.
3.2. FT-IR analysis
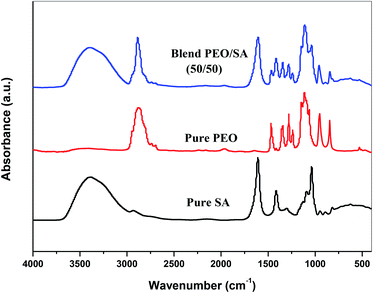
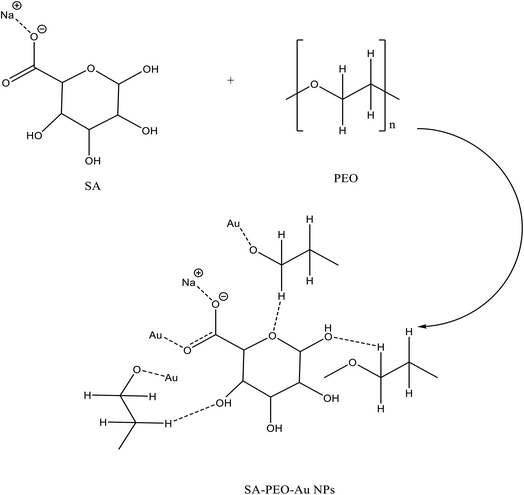
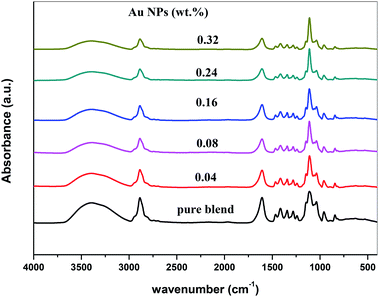
The FTIR technique has been used to investigate the interaction and complexation between gold nanoparticles and virgin polymer (PEO/SA). Fig. 3 displays the FTIR absorption spectrum of pure SA, pure PEO and PEO/SA virgin polymer. The functional groups of the virgin polymer are listed in Table 1. This table displays the existence of (COO−) and (CH–OCH2) of SA (sodium alginate) and (C–O–C) of polyethylene oxide which indicates the interactions between the SA and PEO within the creation of hydrogen bond as displayed in Scheme 1.| Wavenumber cm−1 | Assignment |
|---|---|
| 3397 | Stretching vibration of OH |
| 2886 | Asymmetric stretching of C–H |
| 1608 | Asymmetric & symmetric of C![[double bond, length as m-dash]](https://www.rsc.org/images/entities/char_e001.gif) O O |
| 1418 | CH2 scissoring |
| 1279 | CH2 symmetric twisting |
| 1112 | C–O–C stretching |
| 1039 | CH–O–CH2 stretching |
| 951 | Out-of-plane rings C–H bending |
| 842 | C–C stretching vibrations |
Fig. 4 represents the FTIR spectra of SA (sodium alginate) and PEO (polyethylene oxide) filled with different quantities of Au nanoparticles. From the spectrum of PEO/SA/Au NPs films, the absorbance for almost bands is slightly decreased and its broadness is increased (especially the hydroxyl groups at 3397 cm−1) as a result of the interactions of gold nanoparticles with this peak by creating coordination interaction with the ether group C–O–C of polyethylene oxide19 and ether oxygen (–COO) of sodium alginate.
Subsequently, the ability of prepared samples to absorb H2O increased with increment Au NPs. The variance in the absorbance for OH group, C–O–C, COO− and CH2 group shows this interaction. These clarifications suggest the interaction and complexation between the PEO/SA polymer matrix functional groups and gold nanoparticles.
3.3. Transmission electron microscopy (TEM)
The study of the transmission electron microscope was used to evaluate both size and shape of the studied synthesized nanoparticles. Fig. 5 displays the TEM micrographs for Au NPs and their corresponding size distribution histograms. The size of Au NPs is ranging from 3 to 32 nm that means the Au particles have a nanosize scale which will be confirmed by UV/vis spectroscopy. Also, Fig. 5 depicts that Au NPs have different shapes, such as cubic, hexagonal, spherical, and irregular shapes.17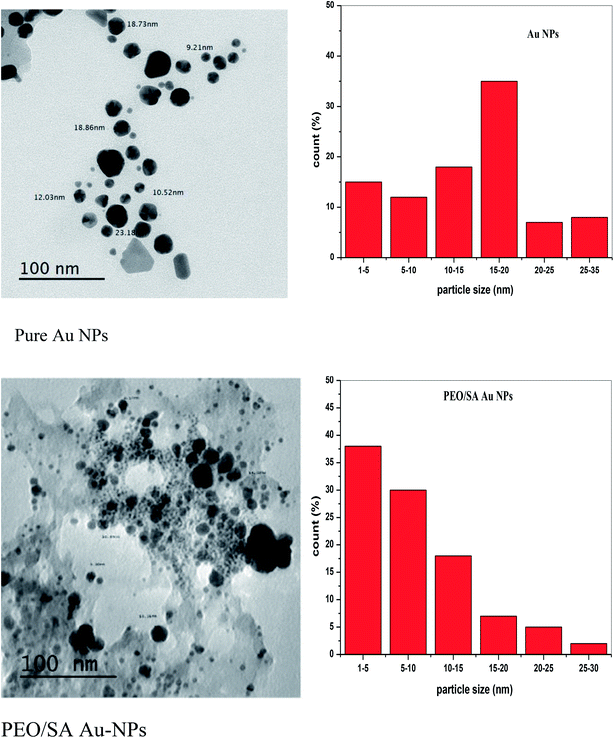 | ||
| Fig. 5 The transmission electron microscope micrograph and the histograms of Au NPs and PEO/SA–Au NPs. | ||
3.4. UV/vis spectroscopy
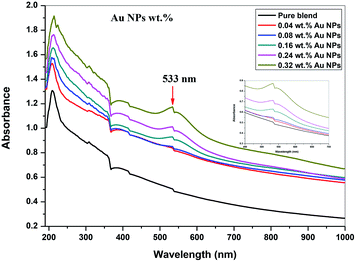
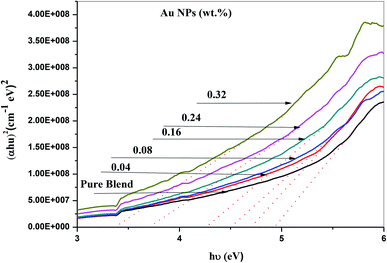
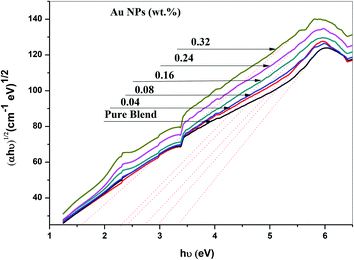
The ultraviolet-visible absorption spectrum for PEO/SA–Au NPs nanocomposite films is displayed in Fig. 6. At 208 nm, the PEO/SA polymer blend displays a peak which is referred to n → π* transition.20 Fig. 6, displays an absorption edge that is somewhat moved to longer wavelength (red shift) as a result of the gold nanoparticles incorporation which causes a variation in the Eg values due to the variation of the degree of crystallinity as in the X-ray diffraction spectra.12,20–22 The spectrum of PEO/SA doped with gold nanoparticles revealed a prominent peak at about 533 nm. Such a peak can be attributed to the presence of gold nanoparticles and is refer to the surface plasmon resonance (SPR) of gold in the nano-scale16 that can be identified through appearance of pinkish-red color in the prepared thin films. So, the appearance of a 533 nm peak approves the gold nanoparticles' presence inside the PEO/SA virgin polymer. Moreover, the absorbance for the doped films is increment compared with PEO/SA polymer blend, so the filled samples can absorb light with a wide range of wavelengths up to the visible area.The following equation can be used to assess the energy gap (Eg) of the nanocomposite films:23
| (αhν) = C(hν − Eg)r for hν > Eg | (1) |
| α(ν) = 2.303(A/T) | (2) |
| Samples | Edg (eV) | Eing (eV) |
|---|---|---|
| PEO/SA blend | 4.82 | 3.41 |
| 0.04 wt% Au NPs | 4.75 | 2.95 |
| 0.08 wt% Au NPs | 4.51 | 2.75 |
| 0.16 wt% Au NPs | 4.35 | 2.45 |
| 0.24 wt% Au NPs | 3.75 | 2.35 |
| 0.32 wt% Au NPs | 3.42 | 1.55 |
3.5. AC conductivity
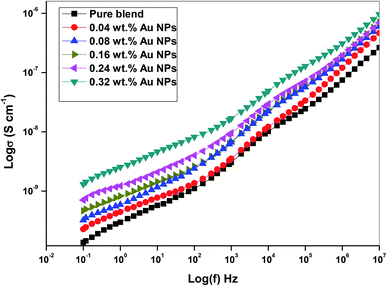
The conductivity of polyethylene oxide and sodium alginate virgin polymer filled with gold nanoparticles with the frequency ranging from (0.1–20 × 106) Hz were determined by the following relation.27| σ = 1/ρ | (3) |
| σ(ω) = σdc + Aωs | (4) |
| Samples | σdc (Ω−1 cm−1) | τm (s) | (s) |
|---|---|---|---|
| PEO/SA blend | 1.1 × 10¹⁰ | 1.1 × 10⁻⁴ | 0.75 |
| 0.04 wt% Au NPs | 1.88 × 10¹⁰ | 1.3 × 10⁻⁴ | 0.64 |
| 0.08 wt% Au NPs | 2.87 × 10¹⁰ | 6.3 × 10⁻⁵ | 0.45 |
| 0.16 wt% Au NPs | 4.1 × 10¹⁰ | 3.9 × 10⁻⁵ | 0.36 |
| 0.24 wt% Au NPs | 6.5 × 10¹⁰ | 3.8 × 10⁻⁵ | 0.27 |
| 0.32 wt% Au NPs | 1.1 × 10⁻⁹ | 1.87 × 10⁻⁵ | 0.14 |
3.6. Dielectric properties
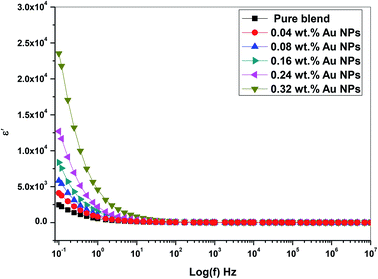
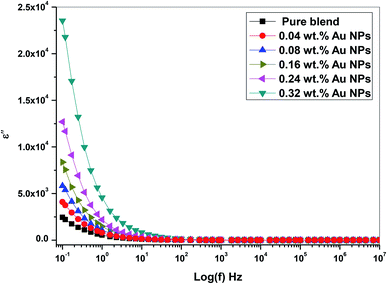
The values of ε′ (dielectric constant) and ε′′ (dielectric loss) can be determined by the next relation:18| ε′ = Ct/εoA | (5) |
ε′′ = ε′![[thin space (1/6-em)]](https://www.rsc.org/images/entities/char_2009.gif) tan tan![[thin space (1/6-em)]](https://www.rsc.org/images/entities/char_2009.gif) δ δ
| (6) |
Fig. 10 depicts the frequency dependence of dielectric constant for the prepared films at room temperature. The dielectric constant values reduce with incremental frequency, resulting in the dipole no longer being able to rotate properly and easily, such that its oscillation begins to lie after this field.31 Besides, no relaxation peaks was observed pointing to a non-Debye response as the electric field directional change.
Fig. 11 shows the frequency dependence of ε′′ (dielectric loss) for all prepared PEO/SA/Au NPs films at ambient room temperature. From Fig. 11, the dielectric loss was found to be reduced as a function of frequency increase since the movement of ions considered as the main foundation of nanocomposite dielectric loss at a lower frequencies. Consequently, the high dielectric loss value at lower frequency values designates the influence of ion jumping and the loss of ion movement conduction, and also the loss of ion polarization.32 Although, the ion vibrations act at a higher frequency as the main source of ε′′ (dielectric loss) and therefore decrease the dielectric loss.
From Fig. 10 and 11, the values of ε′ (dielectric constant) and ε′′ (dielectric loss) for the filled films are higher those that of the (PEO/SA) polymer matrix due to the moderately high dielectric constant value of gold nanoparticles33,34 as compared with polyethylene oxide. This increment suggests that the electrostatic interactions between the polyethylene oxide/sodium alginate functional groups and gold nanoparticles cause an increase of effective parallel ordering of dipoles, consequently, the dielectric polarization of doped samples has thus improved. Supplementary, the high values of ε′′ of the doped films represent the rise of energy loss per cycle. Furthermore, the ε′′ in these nanocomposite films is due to the impeded dipolar reorientation and the impact of the space charges on the internal AC conduction loss.
3.7. Impedance analysis
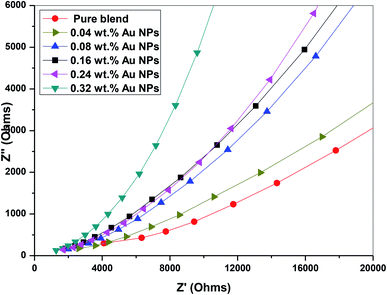
We used impedance spectroscopy to distinguish the effect of electrode polarization (EP) and the bulk material properties, which is illustrated by the presence of two distinct arcs in the complex impedance spectrum of imaginary part impedance (Z′′) vs. real part of impedance (Z′).35 The electrode polarization phenomena occur due to the creation of the electric double layer (EDL) capacitance through the free charges that accumulate between the electrode surface and the dielectric materials at the interface.The complex impedance of the nanocomposite samples can be defined by the following relation
| Z*(ω) = Z′ − jZ′′ | (7) |
Fig. 12 depicts that the imaginary part versus the real part of the impedance spectra of PEO/SA–Au NPs nanocomposite has only one arc, which is attributed to the properties of bulk materials. The single arc spectra of the prepared samples in the frequency range 0.1 Hz to 20 MHz confirm that the nanocomposite PEO/SA–Au NPs have good electrical contact with nickel-plated cobalt electrodes and no electrical double-layer capacitance is created. Moreover, the large Z′ values of the complex impedance compared with Z′′ approve an extremely capacitive behavior of the prepared samples.36
3.8. Complex electric modulus
The complex electric modulus M* for the prepared samples can be determined by the following equation:37| M* = 1/ε* = M′ + jM′′ | (8) |
| M* = ε′/(ε′2 + ε′′2) + jε′′/(ε′2 + ε′′2) | (9) |
Fig. 13 depicts the plot M′ against log(f) for all prepared films (PEO/SA/Au NPs). It is clear that, at the low frequency, the values of M′ close to zero for all prepared films38 while at high values of (f), the values of M′ increases for all nanocomposites films and reaches an optimum value at high frequency. These observations may be due to the lack of restoring of forces for the carrier of charges under the action of the motivated field applied. These behaviors of M′ values have been found in many polymer nanocomposites.39–41
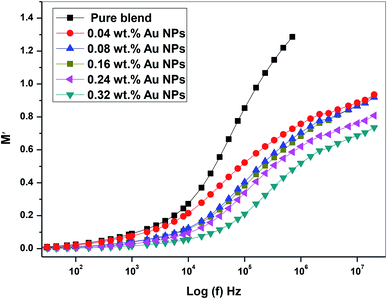 | ||
| Fig. 13 The plot of the real part of the dielectric modulus (M′) vs. log(f) of PEO/SA–Au NPs nanocomposite. | ||
Fig. 14 provides the spectra of M′′ (the imaginary component of the electric modulus) as a function of (f) Hz at various concentrations of gold nanoparticles. The peak observed in M′′ represents the relaxation of the conductivity of the mobile ions and is related to the dynamics of the translation ions. The peak moves toward high frequency and the peak intensity reduce with increasing gold nanoparticles. These results indicate that the relaxation mechanism has a polarity. Expansion at the peak indicates that τm spreads with variable time constants; as a result, the non-Debye individual of relaxation in the prepared films is observed. Furthermore, the shift of the modulus relaxation peak assumes that the interaction of dopant nanoparticulates that reduces the interfacial strength of the polymeric matrix and assists the segmental dynamics of the matrix in nanocomposite films. The above results confirm the practical changes in the structural properties mentioned in the FTIR and X-ray diffraction analysis of all doped films.
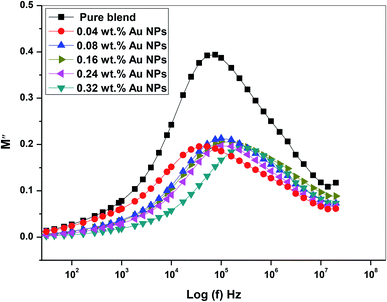 | ||
| Fig. 14 The plot of the imaginary part (M′′) of the dielectric modulus vs. log(f) of PEO/SA–Au NPs nanocomposite. | ||
Relaxation time for ion charge carriers may be evaluated by the following relationship:
| τm = 1/ωm | (10) |
The relaxation time values according to the optimum values of M′′ (imaginary part of the electric modulus) are determined and registered in Table 3. This represents that the existence of Au nanoparticles within the PEO/SA virgin polymer accelerates the matrix segmental dynamic. Moreover, the result of the relaxation time (τm) indicates that the potential barrier to transport charges is very low.
Argand et al. plot M′′ vs. M′ (the actual versus the imaginary part of the dielectric module) to illustrate the relaxation process nature for the PEO/SA/Au NPs nanocomposite films. Fig. 15 shows a semicircular trend for all examined films which depicts that the relaxation process is the Debye model, single relaxation time, in the investigated films. All dipoles must be identical in this model. Consequently, Debye relaxation is the dielectric response of ideal dipole relaxation to the alternating electrical field.18 Furthermore, the size of those peaks decreases with increasing gold nanoparticles displaying its semiconducting behavior.
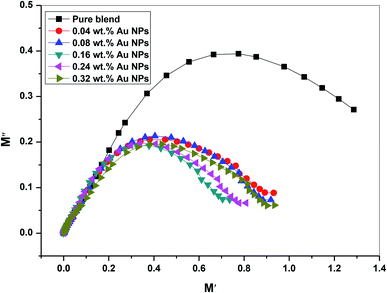 | ||
| Fig. 15 The plot of imaginary part (M′′) versus real part (M′) of dielectric modulus of PEO/SA–Au NPs nanocomposite. | ||
4 Conclusion
Gold nanoparticles were prepared from the Chenopodium murale extract by the green synthesis method. PEO/SA virgin polymer filled with Au NPs has been efficiently prepared using a casting process. The XRD diffraction analysis indicated that the degree of crystallinity of PEO/SA virgin polymers varies with the addition of Au NPs. The FTIR spectra verified the interaction between PEO/SA and gold nanoparticles, and the PEO/SA virgin polymer acts as a passivation agent for the dispersion of gold NPs. The image of the transmission electron microscope and its histogram approved the formation of Au with average size (15–20) nm. The values of (Eg) for all prepared films were decreased with increasing nanofiller. The values of AC conductivity and complex permittivity were increased with incorporated gold nanoparticles on the PEO/SA chain. According to the values of the exponential factor (s), the charge transport by hopping mechanism (CBH). The imaginary part (M′′) of the dielectric module spectrum for filled films displays the relaxation peaks correlated with segmental dynamics of polymeric matrices. The value of the relaxation time (τm) of the doped films decreased, indicating the suitability of these nanocomposite films as multitude network host of solid electrolyte suitable for energy storage devices. The frequency and concentrations of gold nanoparticles-depending on electrical characteristics-meaning that these prepared nanofilms can be used as tunable flexible-type nanodielectric in the manufacture of new era microelectronics.Conflicts of interest
The authors declare that they have no conflict of interest.References
- A. Abdelghany, A. Oraby and M. Farea, Influence of green synthesized gold nanoparticles on the structural, optical, electrical and dielectric properties of (PVP/SA) blend, Phys. B, 2019, 162–173 CrossRef CAS.
- M. Meikhail, et al., Spectroscopic studies of PVA/PEO hydrogel filled with cesium chloride, Res. J. Pharm., Biol. Chem. Sci., 2014, 5, 976–983 CAS.
- A. Bhattacharya, J. W. Rawlins and P. Ray, Polymer Grafting and Crosslinking, John Wiley & Sons, 2008 Search PubMed.
- J. Jang and D. K. Lee, Plasticizer effect on the melting and crystallization behavior of polyvinyl alcohol, Polymer, 2003, 44(26), 8139–8146 CrossRef CAS.
- S. Angot, D. Taton and Y. Gnanou, Amphiphilic stars and dendrimer-like architectures based on poly (ethylene oxide) and polystyrene, Macromolecules, 2000, 33(15), 5418–5426 CrossRef CAS.
- M. A. Hillmyer and F. S. Bates, Synthesis and characterization of model polyalkane− poly (ethylene oxide) block copolymers, Macromolecules, 1996, 29(22), 6994–7002 CrossRef CAS.
- A. Hezma, et al., Change spectroscopic, thermal and mechanical studies of PU/PVC blends, Phys. B, 2016, 495, 4–10 CrossRef CAS.
- E. K. Solak and O. Şanlı, Use of sodium alginate-poly (vinyl pyrrolidone) membranes for pervaporation separation of acetone/water mixtures, Sep. Sci. Technol., 2010, 45(10), 1354–1362 CrossRef CAS.
- S. El-Sayed, et al., DSC, TGA and dielectric properties of carboxymethyl cellulose/polyvinyl alcohol blends, Phys. B, 2011, 406(21), 4068–4076 CrossRef CAS.
- C. G. Lopez, et al., Structure of sodium carboxymethyl cellulose aqueous solutions: a SANS and rheology study, J. Polym. Sci., Part B: Polym. Phys., 2015, 53(7), 492–501 CrossRef CAS.
- M. El-Bana, et al., Preparation and characterization of PbO/carboxymethyl cellulose/polyvinylpyrrolidone nanocomposite films, Polym. Compos., 2017, 3712–3725 Search PubMed.
- N. H. El Fewaty, A. El Sayed and R. Hafez, Synthesis, structural and optical properties of tin oxide nanoparticles and its CMC/PEG–PVA nanocomposite films, Polym. Sci., Ser. A, 2016, 58(6), 1004–1016 CrossRef CAS.
- K. J. Klabunde, Free atoms, clusters, and nanoscale particles, Academic Press, 1994 Search PubMed.
- W. Heffels, et al., Polymers and metals; nanocomposites and complex salts with metallic chain structure, Recent Res. Dev. Macromol. Res., 1999, 2, 143–156 Search PubMed.
- P. Mahajan, et al., Green synthesized (Ocimum sanctum and Allium sativum) Ag-doped cobalt ferrite nanoparticles for antibacterial application, Vacuum, 2019, 389–397 CrossRef CAS.
- A. Abdelghany, et al., Effect of gamma-irradiation on biosynthesized gold nanoparticles using Chenopodium murale leaf extract, J. Saudi Chem. Soc., 2017, 21(5), 528–537 CrossRef CAS.
- A. Abdelghany, A. Oraby and G. Asnag, Structural, thermal and electrical studies of polyethylene oxide/starch blend containing green synthesized gold nanoparticles, J. Mol. Struct., 2019, 1180, 15–25 CrossRef CAS.
- M. Morsi, A. Rajeh and A. Al-Muntaser, Reinforcement of the optical, thermal and electrical properties of PEO based on MWCNTs/Au hybrid fillers: nanodielectric materials for organoelectronic devices, Composites, Part B, 2019, 106957 CrossRef CAS.
- M. Morsi and A. Abdelghany, UV-irradiation assisted control of the structural, optical and thermal properties of PEO/PVP blended gold nanoparticles, Mater. Chem. Phys., 2017, 201, 100–112 CrossRef CAS.
- A. Abdelghany, et al., Effect of gamma-irradiation on (PEO/PVP)/Au nanocomposite: materials for electrochemical and optical applications, Mater. Des., 2016, 97, 532–543 CrossRef CAS.
- K. Sivaiah, et al., Structural and optical properties of Li+: PVP & Ag+: PVP polymer films, Mater. Sci. Appl., 2011, 2(11), 1688 CAS.
- K. K. Kumar, et al., Investigations on the effect of complexation of NaF salt with polymer blend (PEO/PVP) electrolytes on ionic conductivity and optical energy band gaps, Phys. B, 2011, 406(9), 1706–1712 CrossRef.
- E. Davis and N. Mott, Conduction in non-crystalline systems V. Conductivity, optical absorption and photoconductivity in amorphous semiconductors, Philos. Mag., 1970, 22(179), 0903–0922 CrossRef CAS.
- E. Abdelrazek, et al., Structural, optical, thermal and electrical studies on PVA/PVP blends filled with lithium bromide, Curr. Appl. Phys., 2010, 10(2), 607–613 CrossRef.
- A. Abdelghany, E. Abdelrazek and D. Rashad, Impact of in situ preparation of CdS filled PVP nano-composite, Spectrochim. Acta, Part A, 2014, 130, 302–308 CrossRef CAS.
- E. M. Abdelrazek, et al., Structural, optical, morphological and thermal properties of PEO/PVP blend containing different concentrations of biosynthesized Au nanoparticles, J. Mater. Res. Technol., 2018, 7(4), 419–431 CrossRef CAS.
- M. Meikhail, et al., Electrical conduction mechanism and dielectric characterization of MnTPPCl thin films, Phys. B, 2018, 539, 1–7 CrossRef CAS.
- S. Ramesh and M. Chai, Conductivity, dielectric behavior and FTIR studies of high molecular weight poly (vinylchloride)–lithium triflate polymer electrolytes, Mater. Sci. Eng., B, 2007, 139(2–3), 240–245 CrossRef CAS.
- B. Jinisha, et al., Development of a novel type of solid polymer electrolyte for solid state lithium battery applications based on lithium enriched poly (ethylene oxide)(PEO)/poly (vinyl pyrrolidone)(PVP) blend polymer, Electrochim. Acta, 2017, 235, 210–222 CrossRef CAS.
- K. Anilkumar, et al., Poly (ethylene oxide)(PEO)–Poly (vinyl pyrrolidone)(PVP) blend polymer based solid electrolyte membranes for developing solid state magnesium ion cells, Eur. Polym. J., 2017, 89, 249–262 CrossRef CAS.
- M. Anantharaman, et al., Dielectric properties of rubber ferrite composites containing mixed ferrites, J. Phys. D: Appl. Phys., 1999, 32(15), 1801 CrossRef CAS.
- S. A. Mansour, I. Yahia and G. Sakr, Electrical conductivity and dielectric relaxation behavior of fluorescein sodium salt (FSS), Solid State Commun., 2010, 150(29–30), 1386–1391 CrossRef CAS.
- S. Mahendia, et al., Optical and structural properties of poly (vinyl alcohol) films embedded with citrate-stabilized gold nanoparticles, J. Phys. D: Appl. Phys., 2011, 44(20), 205105 CrossRef.
- P. Stoller, V. Jacobsen and V. Sandoghdar, Measurement of the complex dielectric constant of a single gold nanoparticle, Opt. Lett., 2006, 31(16), 2474–2476 CrossRef CAS.
- R. Sengwa and S. Choudhary, Investigation of correlation between dielectric parameters and nanostructures in aqueous solution grown poly (vinyl alcohol)-montmorillonite clay nanocomposites by dielectric relaxation spectroscopy, eXPRESS Polym. Lett., 2010, 4, 9 CrossRef.
- R. Sengwa, S. Sankhla and S. Choudhary, Dielectric characterization of solution intercalation and melt intercalation poly (vinyl alcohol)-poly (vinyl pyrrolidone) blend-montmorillonite clay nanocomposite films, Indian J. Pure Appl. Phys., 2010, 7 Search PubMed.
- M. Morsi, S. A. El-Khodary and A. Rajeh, Enhancement of the optical, thermal and electrical properties of PEO/PAM: Li polymer electrolyte films doped with Ag nanoparticles, Phys. B, 2018, 539, 88–96 CrossRef CAS.
- M. Prabu and S. Selvasekarapandian, Dielectric and modulus studies of LiNiPO4, Mater. Chem. Phys., 2012, 134(1), 366–370 CrossRef CAS.
- I. Elashmawi, et al., Modification and development of electrical and magnetic properties of PVA/PEO incorporated with MnCl2, Phys. B, 2014, 434, 57–63 CrossRef CAS.
- S. Choudhary, Structural and dielectric properties of (PEO–PMMA)–SnO2 nanocomposites, Compos. Commun., 2017, 5, 54–63 CrossRef.
- S. Choudhary and R. Sengwa, Morphological, structural, dielectric and electrical properties of PEO–ZnO nanodielectric films, J. Polym. Res., 2017, 24(3), 54 CrossRef.
| This journal is © The Royal Society of Chemistry 2020 |

