 Open Access Article
Influence of micro/nanobubbles on clogging in drip irrigation systems
Hao Li ab,
Hong Li*a,
Qibiao Han*b,
Xiuqiao Huangb,
Yue Jianga,
Hao Sunb and
Hui Lib
aResearch Center of Fluid Machinery Engineering and Technology, Jiangsu University, Zhenjiang, 212013, China
bInstitute of Farmland Irrigation, Chinese Academy of Agricultural Sciences, Xinxiang, 453002, China
First published on 23rd October 2020
Abstract
Drip emitter clogging is closely related to the presence of particulate matter, nutrients, organic matter and microorganisms in irrigation water and severely restricts the performance, service life and popularization of drip irrigation systems. Micro/nanobubbles can effectively remove suspended particles in water, limit microbial activity, and significantly increase the concentration of dissolved oxygen in water to promote crop growth. However, the effects of micro/nanobubbles on drip emitter clogging remain to be studied. Thus, taking micro/nanoaerated drip irrigation as the research object, five different types of emitters were selected, and the clogging characteristics of the different types of emitters under micro/nanoaerated conditions were studied by performing an emitter clogging test. The influence of emitter clogging on the uniformity of the irrigation provided by the micro/nanoaerated drip system was explored. The results showed that emitter clogs developed gradually and that the clogging developed slowly at the early stage of irrigation. When a slight clogging occurred, the emitter clogged rapidly, resulting in severe or even complete clogging. The cylindrical emitters had the worst anti-clogging performance among the tested emitters, while the emitters with no pressure compensation function and high rated flows had the better performance. Micro/nanoaeration had a significant effect on emitter clogging and increased the normal working times of the E1, E2, E3, E4 and E5 emitters by 38%, 20%, 30%, 28% and 130%, respectively. In addition, micro/nanoaeration reduced the sensitivity of the Christiansen uniformity coefficient (Cu) and the statistical uniformity coefficient (Us) in the drip system to the discharge ratio variation (Dra) and enhanced the stability of the uniformity coefficients of the drip system. Therefore, micro/nanoaeration can help to inhibit clog development in emitters, extend the service life of emitters, and maintain good uniformity in drip irrigation systems. The results of this paper provide a theoretical reference for revealing the clogging mechanisms of micro/nanoaerated drip irrigation emitters and provide theoretical support for the efficient operation of micro/nanoaerated drip irrigation systems.
1. Introduction
Drip irrigation technology is one of the irrigation methods that has the most significant water-saving effect and the most widely integrated applications worldwide. It plays an important role in ensuring the sustainable use of water resources and the sustainable development of agriculture due to its precision, efficiency, low energy usage, and water usage reductions. In aerated drip irrigation systems, the oxygen or oxygen media are transferred precisely to the crop root region through the drip irrigation pipe network. This technique aims to optimize the ecological conditions for the crop, enhancing the synergistic effects of water, soil, fertilizer, and air on crop growth. Research has shown that aerated drip irrigation effectively reduces the soil mechanical strength and improves soil permeability,1–3 alleviates hypoxia in soil irrigation,4 ensures a good growth environment for roots, maintains the normal crop metabolism, and improves the water and nutrient utilization rate in order to save water and increase production.5–10 Especially in heavy clay environments, aerated drip irrigation can significantly improve soil hypoxia, crop yield and quality, and the profitability of crop production.11 In addition, aerated drip irrigation technology can also create a suitable soil water and gas environment for microbial reproduction, increase the number of soil nitrifying bacteria and improve soil enzyme activity.12–15 Therefore, aerated drip irrigation simultaneously applies water and oxygen to crops and increases the economic benefits of crop production; this method has obvious technical advantages and good application prospects.In addition to their unique size, longevity and low buoyancy,16 the outstanding high gas solubility and the ability to generate free radicals of micro-nanobubbles have led to their widespread application in biological, environmental, medical, agricultural and other fields.17,18 The successful integration of micro-nano bubble technology and drip irrigation technology has brought new opportunities for the formation of eco-friendly agricultural nanotechnology that will contribute to the sustainable development of agriculture.19 In summary, the studies of micro/nanoaerated drip irrigation have been only focus on improving crop yield and quality,13 promoting crop seed germination, and reducing environmental damage in the process of fertilizer production and use to date.20 Few studies have focused on the influence of micro/nanobubbles on the process of drip irrigation system clogging; these studies are still at the initial stage. However, in the actual crop production process, emitter clogging seriously restricts the performance, service life, and popularization of drip irrigation systems. Thus, solving the problem of the emitter clogging is crucial for improving the safe operation of drip irrigation systems.21–23 Studies have shown that solid particles, chemical precipitation, and microbial activities and their metabolites in irrigation water are the main causes of emitter clogging problems.24–26 However, micro/nanobubbles are characterized by superstability, a high mass transfer rate, and strong oxidation,27,28 which means that they can effectively remove suspended particles in the water, limit microbial activity in irrigation pipelines, further purify irrigation water, and significantly increase the dissolved oxygen content in irrigation water to promote crop growth.13 In summary, the study of the emitter clogging process and the evaluation of the influence of micro/nanobubbles on the anti-clogging performance of the drip irrigation emitter will be helpful in further understanding the mechanism by which aerated irrigation influences the performance of drip irrigation systems, which is of great importance for the application and promotion of aerated drip irrigation technology.
To assess the process of clogging formation and development in micro/nanoaerated drip irrigation emitters and evaluate the effect of micro/nanobubble technology on the performance of the drip irrigation system in this study, different drip irrigation emitters were selected as the research objects. The objective of the present study was to study the influence of micro/nanoaeration on the clogging of different irrigation emitters by monitoring the dynamic changes in the average flowrate ratio (Dra); to evaluate the influence of micro/nanobubbles and emitter types on emitter clogging; and to analyze the response of the uniformity of the drip irrigation system to the degree of emitter clogging. The results of this study showed that the application of micro/nanobubbles in aerated drip irrigation technology can reduce the clogging of drip irrigation emitters and increase the service life of drip irrigation systems.
2. Materials and methods
2.1 Emitter selection
To study the influence of aeration on the clogging of different emitters, five kinds of commonly used emitters that are on the market were selected as the research objects. The relationship between the flowrate and pressure and the coefficient of variation (Cv) of the emitters were determined before the tests (ISO:9261 (ref. 29)). The relationship between the flowrate and pressure of the emitter was expressed as follows:| qe = kpm |
The coefficient of variation (Cv, %) was calculated as follows:
![[q with combining macron]](https://www.rsc.org/images/entities/i_char_0071_0304.gif) is the mean flowrate of the sample.
is the mean flowrate of the sample.
The structural parameters and performance indexes of each emitter are shown in Table 1. Emitters 2 and 4 had good pressure compensation performance, and the flow pattern index of the other emitters was 0.46–0.48. According to the ASAE Standards,30 all five types of emitters are excellent.
| No. | Type of emitters | Rated flowrate (L h−1) | Emitter space (m) | Connection type | Compensation capabilities | k | m | Cv (%) |
|---|---|---|---|---|---|---|---|---|
| E1 | ARIES | 1.9 | 0.3 | Flat emitters | Non-pressure compensation | 0.693 | 0.46 | 3.25 |
| 16250 | ||||||||
| E2 | DRIPNET | 2.0 | 0.3 | Flat emitters | Pressure compensation | 1.969 | 0.01 | 3.16 |
| PC 16009 | ||||||||
| E3 | ARIES | 1.0 | 0.3 | Flat emitters | Non-pressure compensation | 0.347 | 0.48 | 1.74 |
| 16250 | ||||||||
| E4 | DRIPNET | 1.0 | 0.4 | Flat emitters | Pressure compensation | 1.003 | 0.01 | 3.13 |
| PC 16150 FL | ||||||||
| E5 | PC EXTRA | 2.0 | 0.5 | Cylindrical emitters | Non-pressure compensation | 0.218 | 0.46 | 2.20 |
| DDC1620050 |
2.2 Experimental setup
The test was carried out in the water-saving irrigation equipment quality testing center of the Ministry of Water Resources. Two test groups, the aeration group and the comparison group, were established. The test equipment is shown in Fig. 1. The experimental setup of the aeration test group was composed of the header and the test part. The header included two series water tanks (0.2 m3); a micro/nanobubble generator (Bubble diameter: 200 nm to 4 μm, bubble content: 84–90%, bubble rise speed 4–8 mm s−1); a frequency conversion pump with a rated flowrate of 3 m3 h−1, head of 50 m, and power of 1.5 kW; a filter (120 mesh); three valves; three pressure gauges (0.4% accuracy), etc. The testing setup consisted of three groups of five drip irrigation belts (E1–E5) with a length of 10 m and a spacing of 0.2 m. Under the drip irrigation belt, a sink with a certain slope was installed; the sink was connected to the water tank to collect the test medium passing through the emitter to the water tank. The test device in the comparison test group was consistent with that in the aeration group except that the micro/nanobubble generator was not installed at the header. To further eliminate the impacts of physical clogging, a circulating water supply system was used in this test. The test water source entered tank No. 2 after passing through the precipitate of tank No. 1 and then entered the test pipeline. The test water source was pressurized by the frequency conversion pump from the water tank and entered the drip irrigation test pipe network after passing through the filter. Then it was collected by the sink under the drip irrigation belt after flowing out from the emitters and finally returned to the water tank, thus forming a circulating water supply. After repeated precipitation and filtration, the experimental water source reduced suspended particles and solid impurities in the water and reduced the possibility of physical clogging of the emitter. However, circulating water supplies can easily change test temperatures and microbial environments, increasing the risk of chemical and biological clogs.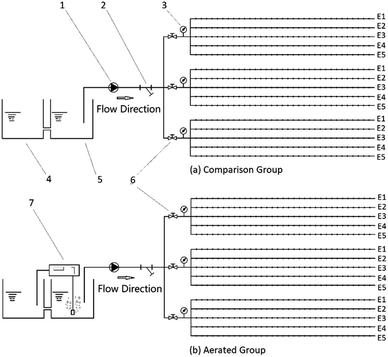 | ||
| Fig. 1 Schematic diagram of the test apparatus, (1) variable frequency pump (2) screen filter (3) precision pressure gauge (4) no. 1 tank (5) no. 2 tank (6) valve (7) micro/nanobubble generator. | ||
The experiment began on May 13, 2019, and ended on June 25, 2019, with a daily running time of 10 hours (8:00–18:00) and a total running time of 430 hours. During the test, to make up for lost water caused by evaporation and water droplet splashes, the water tank was replenished with groundwater, and the filter was cleaned before the test every day. During the operation of the test device, the working pressure of the system was kept stable at 0.1 MPa, and the capillary tubes were not washed during the whole test.
The test water source was groundwater, and the water quality parameters are shown in Table 2.
| Total nitrogen, mg L−1 | Total phosphorus, mg L−1 | COD, mg L−1 | TDS, g L−1 | Ca, mg L−1 | Mg, mg L−1 | Fe, mg L−1 | Mn, mg L−1 | Bicarbonate, mg L−1 | Carbonate, mg L−1 | Na, mg L−1 | pH | Total salt content, S cm−1 | Sulfate, mg L−1 |
|---|---|---|---|---|---|---|---|---|---|---|---|---|---|
| 6.3 | 0.36 | <15 | 2.69 | 96.39 | 95.4 | 0.074 | 0.022 | 153.52 | 26.96 | 109.5 | 7.26 | 2.66 | 87.31 |
2.3 Emitter clogging monitoring
To monitor emitter clogging, the flowrate of each emitter was measured every 5 days from the start of the test. During the test, the system was run stably under the rated pressure for 30 minutes, and then rain gauges were placed directly below the measuring point every 5 seconds. After 12 minutes, the rain gauges were taken out in turn according to the placement sequence and time interval, and the water content in the rain gauge was measured by the gauge. To reduce the test error, each test was repeated 3 times.In the test, the average discharge ratio variation (Dra) was adopted to indicate the degree of clogging of the emitter:
The average flowrate ratio of the emitter (Dra) reflects the degree of the reduction in the average flowrate of the emitter. The lower Dra is, the greater the attenuation of the average flowrate of the emitter is and the more serious the clogging is. It is generally considered that when Dra ≤ 75%, the emitter is blocked to some extent.31 Therefore, the average flowrate ratio of an emitter with Dra ≤ 75% was considered the basis for a judgment that an emitter in the test was blocked. The different degrees of emitter clogging were classified according to the value of Dra. When Dra ≥ 95%, it was defined as unblocked; when 75% ≤ Dra < 95%, it was defined as a slight clogging; when 50% ≤ Dra < 75%, it was defined as a clogging; when 20% ≤ Dra < 50%, it was defined as a serious clogging; and when Dra < 20%, it was defined as a complete clogging.
2.4 System performance evaluation
The Christiansen uniformity coefficient (Cu) and statistical uniformity coefficient (Us) were used to evaluate the influence of emitter clogging on the performance of the drip irrigation system:(1) Christiansen uniformity coefficient (Cu)
![[x with combining macron]](https://www.rsc.org/images/entities/i_char_0078_0304.gif) is the sample mean, ml; and N is the number of measured points.
is the sample mean, ml; and N is the number of measured points.
(2) Statistical uniformity coefficient (Us)
| Us = 100% × (1 − s/x) |
3. Results
3.1 Variations in emitter clogging
Fig. 2 shows the variation in the average flowrate ratio (Dra) of each type of emitter in the aeration test group and the comparison test group with the test time; Fig. 3 shows the variation in the number of emitters with different degrees of clogging in each test group with the irrigation time. As shown in Fig. 2, the clogging processes for all types of emitters in the aeration test group and the comparison test group were similar. At the initial stage of the test, the Dra of all emitters was greater than 95%, no clogging occurred in the emitters, and the Dra curve was flat. When the Dra of the emitter was reduced to 95%, the emitter became slightly blocked, and the curve of the Dra began to fall sharply. The results showed that emitter clogging was a slow process at the beginning of the experiment. However, as the test progressed, the clogging quickly began to increase when the emitter was slightly blocked. That is, the Dra of the emitter in each test group gradually decreased with the progress of the test. It also means that the transition from unblocked to slightly blocked for each emitter was a slow process. When a slight clogging occurs, the emitter quickly became blocked, severely blocked, or even completely blocked.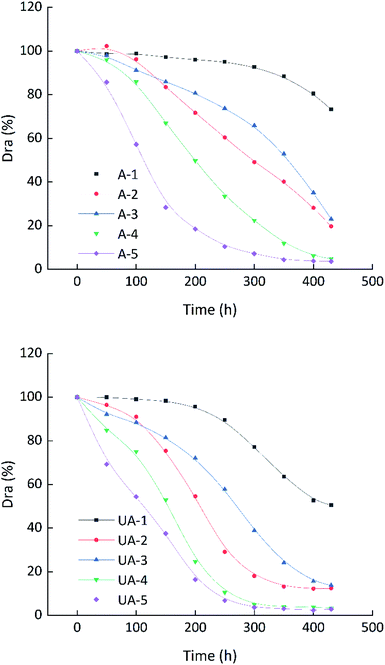 | ||
| Fig. 2 Temporal changes in the average Dra for the different emitter types and different operation modes. | ||
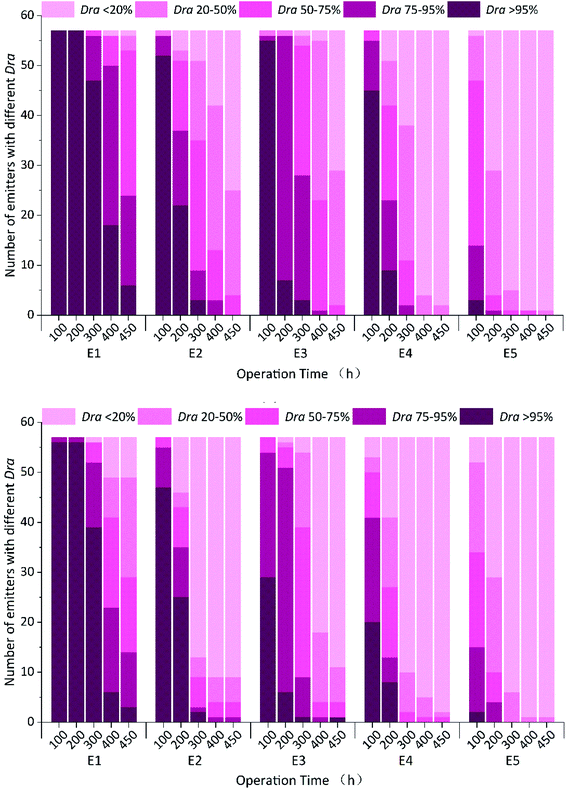 | ||
| Fig. 3 Histogram of the number of emitters with different clogging degrees over the irrigation time. | ||
In each test group, the clogging degree of the different types of emitters varied greatly under the same conditions. Among them, the most obvious difference is between the cylindrical emitter E5 and the other embedded patch emitters (E1 to E4). Fig. 2 shows that the Dra curve of emitter E5 dropped significantly. Accordingly, Fig. 3 shows that the number of blocked E5 emitters was the largest compared with that of the other emitters (E1 to E4) in the same period. At 200 hours of the test, the number of unblocked emitters for emitter E5 was 0, which indicated that the E5 emitters became blocked the fastest and much faster than the other emitters. For the E1 and E2 emitters, Table 1 shows that the rated flowrate and variation coefficient were similar between them, though E1 was a pressure-compensated emitter and E2 was not a pressure-compensated emitter. Fig. 2 shows that the Dra curve of emitter E1 was gentler, and the time to blockage of emitter E1 was also later than that of emitter E2 in Fig. 3. At the same time, significantly more E1 emitters than E2 emitters showed serious blocking in the same period. The results showed that the E1 emitter blocking process was relatively slow and that its anti-blocking performance was better. Similarly, the E3 emitter blocking resistance was better than that of the E4 emitters. Therefore, among the emitters tested, the emitters with the pressure-compensation function had better anti-blocking performance than those without the pressure-compensation function. Comparing emitters E1 and E3, without the pressure-compensation function, and emitters E2 and E4, with the same pressure-compensation function, Table 1 shows that the rated flowrates of emitters E1 and E2 were 2 times those of emitters E3 and E4, respectively. However, in Fig. 2, the Dra curves of emitters E1 and E2 dropped more slowly than those of emitters E3 and E4. As seen in Fig. 3, compared with emitters E1 and E2, the number of unblocked emitters for emitters E3 and E4 was significantly lower than that for emitters E1 and E2 in the same period, and the number of emitters E1 and E2 with the same degree of clogging was higher than that for emitters E1 and E2. In other words, among emitters with the same compensation function, the higher the flowrate was, the better the anti-blocking performance. Comparing Fig. 2(a) and (b) clearly shows that the decline speed of the Dra curve of the emitters in the comparison test group was significantly higher than that of the emitters in the aeration test group. Comparing Fig. 3(a) and (b), the aeration treatment emitter significantly increased the number of emitters of the same type that were not blocked at the beginning of the test, and the number of emitters with each degree of clogging in the aeration test group was lower than that in the comparison test group during the same period. Therefore, the micro/nanobubble aeration treatment can effectively alleviate emitter clogging.
3.2 Regression analysis of the emitter clogging influencing factors
To quantitatively analyze the statistical relationships between the average flowrate ratio of the emitter (Dra) and the aeration treatment (AT), emitter type (ET), drip head rated flowrate (RF), and test duration (T), multiple linear regression analysis was conducted on relevant factors in the data analysis software SPSS 22.0. In the regression analysis, the non-quantitative independent variables were quantified, where the AI value was set to 0 for the unaerated test group and 1 for the aerated test group, and the ET was set to 0 for the flat emitters (non-pressure compensation), 1 for the flat emitters (pressure compensation), and 2 for the cylindrical emitters, and the other independent variables were according to the actual situation. A regression equation was obtained as follows:| Dra = 1252.325 + 10.033AT + 18.864RF − 27.119ET − 9.493T, (R2 = 0.877, P < 0.001) |
The regression analysis coefficients are shown in Table 3. In the T-test of regression coefficients of the various influencing factors, such as aeration treatment (AT), emitter type (ET), rated flowrate (RF) and test duration (T), the significance of their T-values was P = 0.000 < 0.001, indicating that the above influencing factors all had very significant impacts on the change in Dra. Therefore, the results of multiple linear regression analysis showed that the aeration treatment, emitter type, rated flowrate and test duration had significant influences on emitter clogging. In the multiple linear regression analysis, the greater the absolute value of the standardized coefficient was, the greater the influence of the corresponding independent variable on the dependent variable. Therefore, the above influencing factors were ranked from most to least influential in terms of the degree of influence on emitter clogging as follows: test duration, emitter type, emitter rated flowrate, and aeration treatment. Among the above factors, the aeration treatment had the least influence on emitter clogging, but the results of the T test showed that the aeration treatment had a very significant effect on emitter clogging. Therefore, the aeration treatment had an important influence on drip irrigation emitter clogging under certain emitter and irrigation source conditions.
| Parameters | Unstandardized coefficients | Standardized coefficients | t | Sig. | |
|---|---|---|---|---|---|
| B | Standard error | Beta | |||
| Constant | 122.325 | 5.563 | — | 21.989 | 0.000 |
| AT | 10.033 | 2.599 | 0.139 | 3.861 | 0.000 |
| ET | −27.119 | 1.837 | −0.562 | −14.759 | 0.000 |
| RF | 18.864 | 2.807 | 0.256 | 6.721 | 0.000 |
| T | −9.493 | 0.452 | −0.755 | −20.987 | 0.000 |
3.3 Effect of aeration on blocking time
To further study the influence of aeration on the blocking time of various emitters, bar charts of the blocking time (Dra = 75%) of each emitter in the aeration test group and the comparison test group were drawn according to Fig. 2, as shown in Fig. 4. There were obvious differences in the blocking times of the five different types of emitters under the same conditions. The blocking time of emitter E1 was the longest, and the blocking time of emitter E5 was the shortest. According to the blocking time, the emitters were ranked emitter E5 < emitter E4 < emitter E2 < emitter E3 < emitter E1.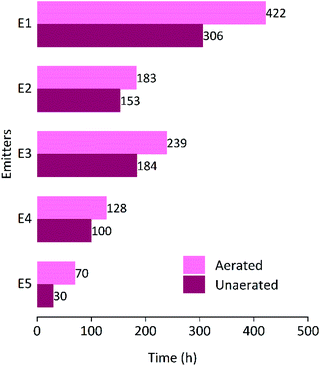 | ||
| Fig. 4 Working time of the different emitter types and different operation modes when the average discharge ratio variation is 75%. | ||
Aeration had a significant inhibitory effect on emitter clogging. For example, in the aeration test group and the comparison test group, the clogging times of emitter E1 were 422 hours and 306 hours, respectively, demonstrating that aeration increased the normal working time of emitter E1 by approximately 38%. Similarly, the normal working hours of emitters E2, E3 and E4 increased by 20%, 30%, and 28%, respectively. The normal operating hours of emitter E5 increased by 130%. This further proved that the aeration treatment had a positive effect on the anti-blocking performance of emitters, especially for cylindrical emitters, whose blocking time increased by 1.3 times. Among the different types of emitters, the clogging time of emitter E5 was significantly lower than that of other emitters under the same working conditions. In the comparison group, the clogging occurred after 30 hours of work. However, the blocking times of emitters E1, E2, E3, and E4 were 306, 153, 184, and 100 hours, which were 10.2, 5.1, 6.1, and 3.3 times that of emitter E5, respectively. In the aeration group, they were 4.4, 2.2, 2.6, and 1.4 times the that of cylindrical E5, respectively. The results indicate that aeration not only increased the anti-blocking performance of the emitter and increased the service life of the emitter but also reduced the differences in anti-blocking performance among the different emitters.
3.4 Effect of aeration on emitter clogging
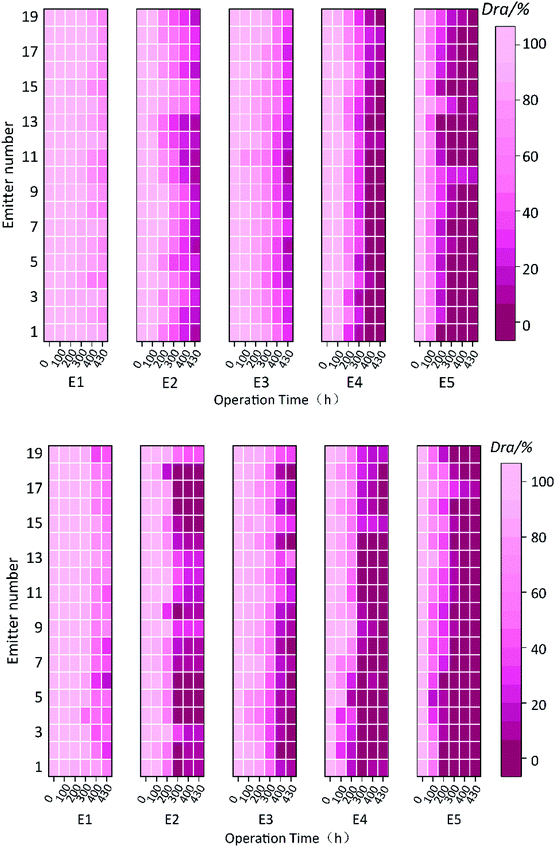
To describe the dynamic process of emitter clogging development, the dynamic changes in emitter clogging at different locations along the direction of the drip irrigation belt were studied, and dynamic change heat maps of the average flowrate ratios of the emitters at different locations were drawn as shown in Fig. 5. The abscissa represents the test running time, the ordinate represents the emitter at different positions along the direction of the drip irrigation belt, and different colors represent the Dra value of the emitter. As shown in Fig. 5, the number of blocked emitters increased continuously with the continuous progress of the test. The blocking time of emitters in the aeration test group was later than that in the comparison group, and the number of blocked emitters of the same type was also significantly lower than that in the comparison group. Comparing the locations of the blocked emitters in the drip irrigation zone at each time stage showed that the blocked emitters in the aeration test group were more evenly distributed in the drip irrigation zone. Along the direction of water flow, the drip irrigation belt was evenly divided into front, middle, and back sections according to the lateral length. In the comparison group, the blocking emitter first occurred in the front section of the drip irrigation belt, and the number of blocked emitters in the front section was greater than that at the end as the test went on. This result showed that the front end of the drip irrigation belt was more likely to become blocked in the conventional drip irrigation system.According to its lateral length, the drip irrigation belt was divided into front, middle, and back sections, and the percentage of blocked emitters was taken as the ratio of the number of blocked emitters in each section to the total number of emitters in that section. In the aeration test group and the comparison test group, the percentage of blocked emitters was distributed along the drip irrigation belt, as shown in Fig. 6. The influence of micro/nanoaeration on the change in the clogging degree of different types of emitters varied. The distribution of emitter clogging along the drip irrigation belt changed with the change in aeration treatment and irrigation time due to the different types of emitters. In the comparison group, the percentage of blocked emitters in the front and back sections was larger, while the percentage in the middle section was smaller, which further verified that the front drip irrigation segment is more likely to be blocked under normal conditions. In the aeration test group, only emitter E3 was first blocked in the middle drip irrigation section at the initial stage of clogging. Compared with that in the comparison group, the percentage of blocked emitters in the middle drip irrigation section in the aeration experimental group was almost higher than that in the front and back sections. The above results showed that micro/nanoaeration not only delayed emitter blocking times but also affected the spatial distribution of the emitter clogging, indicating that micro/nanoaeration had an important influence on the dynamic changes in emitter blocking degrees and made the blocking mechanism more complex.
 | ||
| Fig. 6 Percentage distribution of blocked emitters by drip irrigation section for the different emitter types and different operation modes. | ||
3.5 Effect of aeration on the uniformity coefficient
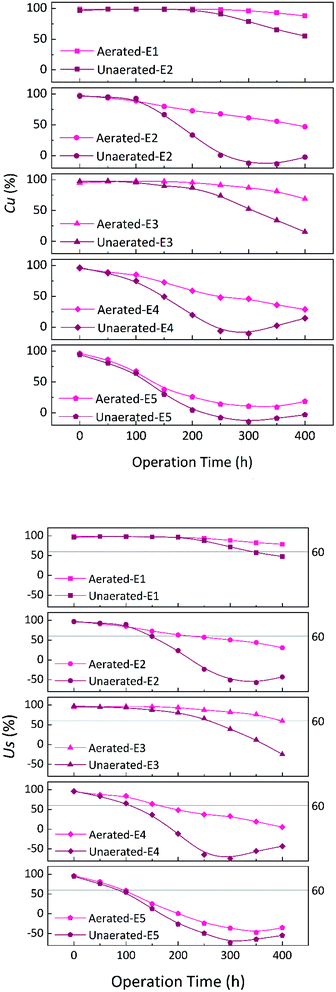
To study the influence of emitter clogging on system uniformity under micro/nanoaeration conditions, the Christiansen uniformity coefficient (Cu) and statistical uniformity coefficient (Us) with the change in operating time in the aeration test group and comparison test group were further analyzed, as shown in Fig. 7. The change processes of the Christiansen uniformity coefficient (Cu) and the statistical uniformity coefficient (Us) were similar to that of the average flowrate ratio (Dra). In both test groups, the uniformity coefficients (Cu and Us) of all types of emitters decreased with increasing test time. For the same type of emitter, the uniformity coefficient stability of the aerated test group was better. In the same test group, for different types of emitters, the change rates of the uniformity coefficient were different. For emitters of the same type, the higher the rated flowrate, the more stable the uniformity was (such as for emitters E1, E3 or E2, E4). For emitters with the same rated flowrate, the uniformity coefficient of the different types varied greatly; the uniformity coefficient of the columnar emitter E5 dropped most obviously, while the uniformity coefficients of emitters E1 and E3, without pressure compensation, were more stable.ASAE standard EP 458 (ref. 32) indicates that an evaluation system can be classified as excellent when Us was 80–90%. When Us is less than 60%, the evaluation system is considered unqualified. Therefore, Fig. 7(b) shows the test time of each emitter with its statistical uniformity coefficient (Us) in the aeration test group was significantly higher than that in the comparison test group. In particular, at the end of the experiment, the Us of drip irrigation with emitter E1 was still slightly less than 80% under aerated conditions, which proved that the system performance was still good. At this time, the Us of the comparison test group had decreased to nearly 40%, and the system performance was obviously unqualified, so it was no longer suitable for continuous use. This indicated that micro/nanoaeration was beneficial for maintaining good uniformity in drip irrigation systems and effectively extending the service life of drip irrigation systems.
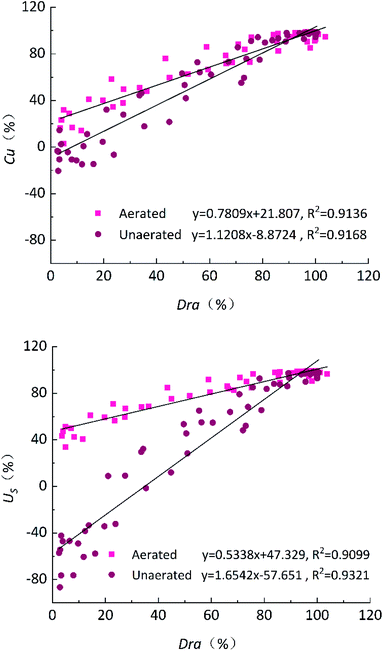
Fig. 8 shows the relationship of the Christiansen uniformity coefficient (Cu) and the statistical uniformity coefficient (Us) to the average flow ratio (Dra) in the drip irrigation system. Dra, Cu, and Us showed a positive linear relationship. When Dra was the same in the drip irrigation system, the influence of micro/nanoaeration on Cu and Us was obviously different. Overall, Cu and Us in the aeration test group were better than those in the comparison group. In particular, Cu and Us changed dramatically at a Dra of approximately 95%, and the positive effect of micro/nanoaeration on Cu and Us was more obvious with a decrease in Dra, indicating that micro/nanoaeration can reduce the sensitivity of Cu and Us to Dra in drip irrigation systems. At the same time, micro/nanoaeration can not only delay emitter clogging but also make emitter clogging more even. Thus, the problem of decreasing uniformity in drip irrigation systems caused by emitter clogging can be alleviated.
4. Discussion
Emitters are an important part of drip irrigation systems. The degree of clogging of an emitter seriously affects the performance and application benefits of drip irrigation systems. This experiment showed that the average flowrate of the drip irrigation system (Dra) and the Christiansen uniformity coefficient (Cu) are directly related to the system running time, i.e., dynamic changes in the early operation period of the system are not obvious, and Dra decreases sharply when a certain degree of clogging is reached. This phenomenon in our study results is consistent with the findings of Li and Feng.25,26 However, our study also found that drip irrigation with micro/nanoaeration can effectively alleviate emitter clogging and increase the service life of the drip irrigation system. This was because when the micro/nanobubbles entered the irrigation water, their high internal pressure caused the bubble wall to have high tension. The micro/nanobubbles are subjected to tension and release enormous amounts of energy when they burst, breaking up organic molecular chain structures, promoting the active oxidation degradation of pollutants in the water, and increasing the concentrations of dissolved oxygen and oxygen anions in the water, which has sterilization effects on water, purifying it and improving water quality. In addition, studies have shown that micro/nanobubbles have strong adsorption performance and can be adsorbed onto the surface of small impurities in irrigation water to help with their removal.26,28 Therefore, the micro/nanobubbles can effectively remove and prevent calcium, biofilm and sediments from sticking to the walls of emitter channels, thus relieving emitter clogging. Li Yunkai et al.33 also found that micro/nanobubbles could purify water quality and kill microorganisms, thus reducing emitter clogging. When the micro/nanobubbles adhere to a surface, the friction resistance produced by the flow process can be reduced.34,35 Therefore, if the micro/nanobubbles adhere to the water flow channel wall, it helps increase the water flow in the channel and reduces impurities and deposition in the water flow passage.27,36 The experimental results in this study showed that the service life of the emitter was significantly increased by aeration under the same working conditions. In addition, it was found that the irrigation uniformity of the aeration test group was better than that of the comparison test group under the same degree of clogging, which indicated that the micro/nanobubbles not only delayed emitter clogging but also made emitter clogging more uniform, thus increasing the service life of the system as a whole.In a consistent working environment, the flow passage structure is an important factor that affects emitter clogging. Studies have shown that the anti-blocking performance of different types of emitters varies. In this experiment, it was also found that the working hours to clogging for the same type of emitter were negatively correlated with the rated flowrate of the emitter. Emitters without pressure compensation had better anti-blocking performance than emitters with pressure compensation. This was because the rated flowrate decreased with decreasing size of the emitter structure. Under the same working conditions, a decrease in the size of the emitter structure can lead to an increase in the friction drag coefficient, easily causing irrigation water impurity deposition in the flow channel and increasing the chances of chemical precipitation and microbial activity, thereby increasing the risk of emitter clogging.37 The multiple stepwise regression analysis of the test results showed that the factors influencing emitter clogging were ranked from most to least influential in terms of the degree of influence as test duration, emitter type, emitter rated flowrate and aeration treatment. In summary, aeration treatment had positive effects on the anti-blocking performance of drip irrigation emitters and the uniformity of drip irrigation systems and could effectively extend the service life of drip irrigation systems.
The microbial community plays an important role in the emitter clogging process, especially for drip irrigation with reclaimed water. Studies have shown that biological control of emitter clogging is effective. This study adopted micro/nanoaerated drip irrigation, and micro/nanobubbles had important effects on the microbial environment of the irrigation water. Thus, it is necessary to study the influence of aeration on the microbial community, determine the mechanism by which aeration influences biological clogging, analyze the relationships between aeration, chemistry and biological clogging, and provide a new method for controlling emitter clogging.
5. Conclusions
The influence of aeration treatment and emitter types on the clogging of drip irrigation emitters was evaluated through experiments, and the conclusions were as follows:(1) The clogging development process for the different emitters was similar. At the beginning of the test, clogging developed slowly. As the test continued, emitter clogging increased rapidly when a slight clogging occurred, leading to clogging, serious clogging or even complete clogging. However, the anti-blocking performance of the different types of emitters varied; the anti-blocking performance of embedded patch emitters without a pressure compensation function was obviously better than that of embedded patch emitters with a pressure compensation function, and the anti-blocking performance of columnar emitters was the worst. For the same type of emitter, the anti-blocking performance of high-flow emitters was better than that of low-flow emitters.
(2) The results of multiple linear regression analysis of the impact factors, such as the average flow ratio of the emitter (Dra), aeration treatment (AT), emitter type (ET), rated flowrate (RF) and test duration (T), showed that the impacts of the aeration treatment, emitter type, rated flowrate and test duration on emitter clogging were extremely significant. The order of the influence from largest to smallest was test time, emitter type, emitter rated flowrate, and aeration treatment. However, the regression analysis of the T test showed that the effect of the aeration treatment on emitter clogging was very significant. Therefore, the aeration treatment had an important effect on emitter clogging under certain irrigation and irrigation water conditions.
(3) Under the same conditions, the blocking times of the different emitter types were significantly different, specifically, E5 < E4 < E2 < E3 < E1. Aeration can significantly inhibit emitter clogging, prolong the service life of the emitter, and reduce the differences between the anti-blocking performances of different emitters. The normal working times for the E1, E2, E3, E4, and E5 emitters increased by approximately 38%, 20%, 30%, 28%, and 130%, respectively. Among the different types of emitters, the blocking time for cylindrical emitters was obviously shorter than that for other emitters under the same working conditions. In the comparison group, the blocking times of emitters E1, E2, E3, and E4 were 10.2, 5.1, 6.1, and 3.3 times that of emitter E5, respectively. In the aerated group, their blocking times were 4.4, 2.2, 2.6, and 1.4 times that of the cylindrical emitter E5, respectively.
(4) Micro/nanoaeration is beneficial for maintaining uniformity in drip irrigation systems and effectively prolonging their service life. For the same type of emitter, micro/nanoaeration made the uniformity coefficient of the drip irrigation system more stable. Micro/nanoaeration can reduce the sensitivity of Cu and Us to Dra in drip irrigation systems. In particular, when Dra was less than 95% and slight emitter clogging occurred, the positive effects of micro/nanoaeration on the Cu and Us of the maintenance system were very clear.
Conflicts of interest
There are no conflicts to declare.References
- Y. Zhu, H. Cai, L. Song and H. Chen, Soil Sci. Soc. Am. J., 2019, 83, 1343–1355 CrossRef CAS.
- Y. Zhu, M. Dyck, H. Cai, L. Song and H. Chen, J. Integr. Agric., 2019, 18, 2854–2868 CrossRef.
- J. B. S. P. M. Dhungel, Adv. Hortic. Sci., 2012, 1, 3–16 Search PubMed.
- I. Ben-Noah and S. P. Friedman, Agric. Water Manag., 2016, 176, 222–233 CrossRef.
- H. Chen, H. Hou, X. Wang, Y. Zhu, Q. Saddique, Y. Wang and H. Cai, J. Integr. Agric., 2018, 17, 449–460 CrossRef CAS.
- Y. Du, W. Niu, X. Gu, Q. Zhang, B. Cui and Y. Zhao, Agric. Water Manag., 2018, 210, 158–164 CrossRef.
- L. Pendergast, S. P. Bhattarai and D. J. Midmore, Agric. Water Manag., 2019, 217, 38–46 CrossRef.
- Y. Liu, Y. Zhou, T. Wang, J. Pan, B. Zhou, T. Muhammad, C. Zhou and Y. Li, J. Cleaner Prod., 2019, 222, 835–843 CrossRef CAS.
- Y. Du, X. Gu, J. Wang and W. Niu, Sci. Total Environ., 2019, 668, 1156–1164 CrossRef CAS.
- S. P. Bhattarai, L. Pendergast and D. J. Midmore, Sci. Hortic., 2006, 108, 278–288 CrossRef.
- L. Pendergast, S. P. Bhattarai and D. J. Midmore, Crop Pasture Sci., 2013, 64, 1171 CrossRef CAS.
- Y. Wu, T. Lyu, B. Yue, E. Tonoli, E. A. M. Verderio, Y. Ma and G. Pan, J. Agric. Food Chem., 2019, 67, 10823–10831 CrossRef CAS.
- Y. Zhou, B. Zhou, F. Xu, T. Muhammad and Y. Li, Agric. Water Manag., 2019, 223, 105713 CrossRef.
- F. Zhao, J. Sun, Y. Jiang, D. Hu, X. Yang, M. Dong, K. Yu and S. Yu, Sci. Hortic., 2018, 236, 207–213 CrossRef CAS.
- Y. Li, W. Niu, J. Wang, L. Liu, M. Zhang and J. Xu, Soil Sci. Soc. Am. J., 2016, 80, 1208–1221 CrossRef CAS.
- H. Peng, G. R. Birkett and A. V. Nguyen, Adv. Colloid Interface Sci., 2015, 222, 573–580 CrossRef CAS.
- H. Zhang, T. Lyu, L. Bi, G. Tempero, D. P. Hamilton and G. Pan, Sci. Total Environ., 2018, 637–638, 550–560 CrossRef CAS.
- K. Ebina, K. Shi, M. Hirao, J. Hashimoto, Y. Kawato, S. Kaneshiro, T. Morimoto, K. Koizumi and H. Yoshikawa, PLoS One, 2013, 8, e65339 CrossRef CAS.
- T. Lyu, S. Wu, R. J. G. Mortimer and G. Pan, Environ. Sci. Technol., 2019, 53, 7175–7176 CrossRef CAS.
- A. K. A. Ahmed, X. Shi, L. Hua, L. Manzueta, W. Qing, T. Marhaba and W. Zhang, J. Agric. Food Chem., 2017, 66, 5117–5124 CrossRef.
- P. Song, Y. Li, B. Zhou, C. Zhou, Z. Zhang and J. Li, Agric. Water Manag., 2017, 184, 36–45 CrossRef.
- J. Feng, Y. Li, W. Wang and S. Xue, Irrig. Sci., 2018, 36, 37–47 CrossRef.
- S. Han, Y. Li, B. Zhou, Z. Liu, J. Feng and Y. Xiao, Agric. Water Manag., 2019, 212, 136–154 CrossRef.
- F. S. Nakayama and D. A. Bucks, Irrig. Sci., 1991, 12, 187–192 CrossRef.
- J. Li, L. Chen and Y. Li, Trans. ASABE, 2009, 52, 1203–1211 Search PubMed.
- J. Feng, Y. Li, Z. Liu, T. Muhammad and R. Wu, Irrig. Sci., 2019, 37, 105–122 CrossRef.
- A. Agarwal, W. J. Ng and Y. Liu, Chemosphere, 2011, 84, 1175–1180 CrossRef CAS.
- A. J. Atkinson, O. G. Apul, O. Schneider, S. Garcia-Segura and P. Westerhoff, Acc. Chem. Res., 2019, 52, 1196–1205 CAS.
- ISO 2004:9261, Agricultural irrigation equipment – Emitters andemitting pipe – Specifications and test methods, International Organization for Standardization, Geneva, Switzerland Search PubMed.
- ASAE Standards (2003) EP405.1, Design and installation of microirrigation systems, ASAE, St. Joseph, Mich Search PubMed.
- ISO 2003:TC 23/SC 18 N, Clogging test methods for emitters, International Organization for Standardization, Geneva, Switzerland Search PubMed.
- ASAE Standards, 1988:EP458, Field evaluation of microirrigation systems, ASAE, St. Joseph, Mich Search PubMed.
- L. Yunkai, S. Peng and Z. Bo, Trans. Chin. Soc. Agric. Eng., 2013, 29, 98–107 Search PubMed.
- X. Zhao, Z. Zong, Y. Jiang and Y. Pan, Journal of Hydrodynamics, 2019, 31, 900–910 CrossRef.
- T. Fan and O. I. Vinogradova, Phys. Rev. E: Stat., Nonlinear, Soft Matter Phys., 2005, 72, 66306 CrossRef.
- S. Broekman, O. Pohlmann, E. S. Beardwood and E. C. de Meulenaer, Ultrason. Sonochem., 2010, 17, 1041–1048 CrossRef CAS.
- W. Qingsong, L. Gang, L. Jie, S. Yusheng, D. Wenchu and H. Shuhuai, Comput. Electron. Agric., 2008, 63, 294–303 CrossRef.
| This journal is © The Royal Society of Chemistry 2020 |


