 Open Access Article
Multilayered composite-coated ionically crosslinked food-grade hydrogel beads generated from algal alginate for controlled and sustained release of bioactive compounds
Wing-Fu Lai *ab,
Eric Wonga and
Wing-Tak Wonga
aDepartment of Applied Biology and Chemical Technology, Hong Kong Polytechnic University, Hong Kong Special Administrative Region, China. E-mail: rori0610@graduate.hku.hk
bShenzhen Key Laboratory of Steroid Drug Discovery and Development, School of Life and Health Sciences, The Chinese University of Hong Kong (Shenzhen), Shenzhen 518172, China
First published on 16th December 2020
Abstract
Hydrogels have gained interest as sustained-release matrices partly because of their high biocompatibility and ease of preparation. Their wide application has, however, been limited by their poor mechanical strength and their lack of tunability in the performance of bioactive agent delivery. By using the lake substratum as a gel property modifier, in combination with the use of the surface coating approach and the ionic gelation technique, hydrogel beads are generated from algal alginate for controlled and sustained release of bioactive compounds. Both the acute and chronic toxicity of the beads are found to be negligible in 3T3 fibroblasts. The capacity of the beads in retaining the activity of the loaded agent is verified by the negligible change in the action of the loaded compound on foodborne bacteria (viz., Staphylococcus aureus and Escherichia coli). Along with the high flexibility provided by the adopted method in the choice of coating materials, our beads extend the limitations of conventional ionically crosslinked gel systems, and show high potential for applications in functional food development, nutraceutical delivery, and pharmaceutical formulation.
1. Introduction
Hydrogels are three-dimensional crosslinked networks of polymers. They swell considerably in an aqueous medium without undergoing dissolution at physiological temperature and pH, and gain wide applications as sustained bioactive agent release matrices.1 Among different types of hydrogels, those generated from algal alginate, which is a naturally occurring polysaccharide extracted and isolated from marine brown algae, have been widely adopted as carriers of bioactive agents,2 partly due to their high biocompatibility, low production cost, and simplicity of preparation.3 Despite this, the process of bioactive agent delivery mediated by most of these carriers is determined passively and predominately by the intrinsic carrier properties (including the swelling capacity, erosion behavior, and affinity with the loaded molecules). Tunability of the delivery performance is limited. In addition, very few energy dissipation mechanisms are available in alginate-based hydrogels to retard the process of crack propagation. Those gels easily break under low stress.4 The situation is compounded by the fact that crosslinking points in those gels are often irregularly distributed, with wide variations in the length of the polymer chain among crosslinking points.4 This leads to the failure of the stress experienced by the gels to be evenly distributed among polymer chains, rendering the gels susceptible to crack initiation.To overcome the technical limitations as mentioned above, this study has not only adopted the surface coating approach to manipulate the hydrogel surface so as to control the release of the loaded agent, but has also incorporated the substratum of food lake dyes into the surface coatings to further enhance the strength of the gel and the tunability of the delivery performance. Technically, food lake dyes are produced by reacting water soluble pigments with a substratum, such as aluminum oxide (Al2O3), which has low solubility in water or organic solvents.5 Some of the lake dyes permitted for use in food coloring include ponceau 4R aluminum lake, tartrazine aluminum lake, sunset yellow aluminum lake, erythrosine aluminum lake, brilliant blue aluminum lake, amaranth aluminum lake, new red aluminum lake, allura red aluminum lake, and indigotine aluminum lake.5 These dyes are commonly used to stain fatty foods or dry foods (e.g., chocolates, cream products, and cocoa products), in which the water content is not sufficient for the food to be stained effectively using conventional water-soluble colorants. Till now, Al2O3 is the only substratum approved for producing Food, Drug & Cosmetic (FD&C) lakes.6 By incorporating this substratum into gel coatings, not only have we achieved tunable performance in encapsulation and release of the bioactive agent, but due to the track record of food applications of the substratum, our beads show high potential for future use in functional food development, nutraceutical delivery, and pharmaceutical formulation.
2. Materials and methods
2.1 Materials
Minocycline hydrochloride (MH), tetracycline hydrochloride (TH), and calcium chloride (CaCl2) were purchased from Macklin Chemical Co., Ltd. (Shanghai, China). The sodium salt of algal alginate extracted from brown algae Sargassum cristaefolium was obtained from Sigma-Aldrich (St. Louis, MO, USA). Al2O3 was obtained from Acros Organics (New Jersey, USA). Dulbecco's Modified Eagle's Medium (DMEM; Gibco, Grand Island, USA), penicillin G-streptomycin sulfate (Life Technologies Corporation, Chicago, USA), and fetal bovine serum (FBS, Hangzhou Sijiqing Biological Engineering Materials Co., Hangzhou, China) were used as the cell culture medium. Trypsin–EDTA (0.25% trypsin–EDTA) was obtained from Invitrogen (Carlsbad, CA, USA).2.2 Preparation of hydrogel beads with composite coatings
6 g of the sodium salt of algal alginate was dissolved in 150 mL of distilled water. Droplets of the solution, in which an appropriate amount of Al2O3 was added, were crosslinked in a collection bath containing an aqueous solution (10% w/v) of CaCl2 for one hour at ambient conditions. The same approach was adopted to generate agent-loaded hydrogel beads. In this case, the model agent (MH or TH) was first dissolved in the solution of the sodium salt of algal alginate to reach a concentration of 0.2% (w/v) prior to undergoing gelation in the collection bath. The generated hydrogel beads were rinsed with distilled water, and were added to a coating solution, which was prepared by mixing a desired amount of Al2O3 with 100 mL of an aqueous solution (4% w/v) of the sodium salt of algal alginate. The algal alginate solutions containing 0% (w/v), 2% (w/v), 4% (w/v) and 6% (w/v) of Al2O3 were designated as A0, A2, A4 and A6, respectively. Before gelation of the coating, an excessive amount of the coating solution on the surface of the beads was blown off by using a stream of dry air. Afterwards, the coating of the bead was crosslinked in a collection bath containing an aqueous solution (10% w/v) of CaCl2 for another one hour at ambient conditions. Ionically crosslinked A0, A2, A4 and A6 were designated as CA0, CA2, CA4 and CA6, respectively. CA0 beads coated with CA0, CA2, CA4 and CA6 were indicated as CA0(CA0), CA2(CA0), CA4(CA0), and CA6(CA0), respectively. Processes of rinsing, coating and crosslinking were repeated to coat CA4(CA0) beads with CA0, generating CA0/CA4(CA0).2.3 Fourier-transform infrared (FT-IR) spectroscopy
FT-IR spectroscopy was carried out using an FT-IR spectrometer (Spectrum 2000; PerkinElmer, Norwalk, CT, USA) at ambient conditions. The potassium bromide (KBr) disk technique was adopted for analysis. Spectra were obtained at a resolution of 2 cm−1, and reported as an average of 16 scans.2.4 Scanning electron microscopy (SEM)
Microstructures of the samples were imaged using a scanning electron microscope (JSM-6380; JEOL, Tokyo, Japan) operated at an accelerating voltage of 10 kV. Before SEM analysis, the samples were sputter-coated with gold.2.5 X-ray diffraction (XRD) analysis
XRD analysis was performed using a D8 Advance diffractometer (Bruker-AXS; Bruker, Karlsruhe, Germany) with Cu-Kα radiation (λ = 1.5406 Å). XRD data were collected at 40 kV and 40 mA. Diffraction patterns were obtained from 5–80°.2.6 Thermogravimetric analysis (TGA)
TGA curves were obtained using a Q50 TGA analyzer (TA Instruments, New Castle, Delaware, USA) equipped with platinum pans. The curves were collected in an inert atmosphere of nitrogen from 40 °C to 600 °C. The heating rate was set as 10 °C min−1 throughout analysis.2.7 Tensile test and rheological measurement
Tensile tests were carried out under strain control using an in situ bidirectional tension-compression testing system (IBTC-300; Tianjin Care Measure & Control Co., Ltd., Tianjin, China). All tests were performed at a rate of 0.1 mm s−1. The viscosity of A0 and A4 solutions were determined using a Brookfield DV-III Ultra programmable rheometer (Brookfield Engineering Laboratories Inc., Middleboro, MA, USA) with spindles (CP-40). Viscosity parameters were collected at different shear rates at ambient conditions, with the equilibration time at every shear rate being set as 15 s. Viscoelastic properties of CA0 and CA4 solutions were also examined in the frequency range of 1–100 rad s−1. The storage modulus (G′) and loss modulus (G′′) were determined.2.8 Cytotoxicity assay
3T3 mouse fibroblasts and HEK293 cells were cultured in DMEM supplemented with 10% FBS, 100 UI mL−1 penicillin, 100 μg mL−1 streptomycin, and 2 mM L-glutamine. 24 hours before the assay, cells were seeded in a 96-well plate at an initial density of 5000 cells per well, and were incubated under a humidified atmosphere of 5% CO2 at 37 °C. During the assay, the cell culture medium in each well was replaced with 100 μL of the cell culture medium containing different concentrations of a sample (either the sodium salt of algal alginate or Al2O3). After 5 hour incubation at 37 °C, the medium was replaced with the fresh cell culture medium. The CellTiter 96 AQueous non-radioactive cell proliferation assay (MTS assay; Promega Corp., Madison, WI, USA) was performed, according to the manufacturer's instructions, either immediately or after 24 hours of post-treatment incubation.2.9 Determination of the hemolytic activity
Female New Zealand White rabbits were purchased from Guangdong Medical Laboratory Animal Center (Guangzhou, China). During assay, blood was collected from the marginal ear vein into a heparin-containing tube, followed by centrifugation at 2000 × g for 10 minutes at 4 °C. All procedures were performed in accordance with the Guidelines for Care and Use of Laboratory Animals of the Hong Kong Polytechnic University and approved by the Animal Ethics Committee of that university. The collected erythrocytes were washed with PBS (pH = 7.4) until the supernatant was colorless. An appropriate amount of a sample (including algal alginate, Al2O3, or a lyophilized gel) was ground in PBS using mortar and pestle, and the solution obtained was filtered before use. Erythrocytes were added to the filtrate until a final concentration of 8% (v/v) was attained. After incubation at 37 °C for one hour, the mixture was centrifuged at 2000 × g for 15 minutes. The absorbance of the supernatant was recorded at 414 nm. The extent of hemolysis in PBS and 0.1% Triton X-100 was defined as 0% and 100%, respectively.2.10 Determination of the swelling and erosion behavior
0.05 g of a lyophilized gel containing a desired mass percentage of Al2O3 was immersed in 50 mL of simulated body fluid, which was prepared as previously described.7 At a pre-set time interval, the gel was retrieved by centrifugation for 5 min at a relative centrifugal force of 4000 × g, followed by the removal of the supernatant. The water absorption ratio (WAR) of the gel was calculated using the following formula:
 | (1) |
2.11 Determination of the bioactive agent encapsulation efficiency
MH and TH were used as model agents. Agent-loaded hydrogel beads were generated as described above. The CaCl2 solution was then collected from the collection bath. The concentration of unencapsulated MH was determined at 280 nm using a UV/Vis spectrophotometer (Varian, Inc., USA), and that of TH was determined at 360 nm as previously described.8 The encapsulation efficiency (EE) was calculated using the following equation:
 | (2) |
2.12 Evaluation of the release profile
After fabrication of agent-loaded hydrogel beads, 10 mL of simulated body fluid was added to the beads. At a pre-set time interval, 0.5 mL of the buffer solution was removed for testing, and was replaced with 0.5 mL of simulated body fluid. The amount of the loaded agent released from the beads was determined using a UV/Vis spectrophotometer (Varian, Inc., USA). The cumulative release of the loaded agent was calculated using the following formula:
 | (3) |
2.13 Antibacterial test
10 mL of a lyophilized MH-loaded gel was ground in PBS using mortar and pestle. After centrifugation, the supernatant was collected. The amount of MH in the supernatant was determined. The concentration of MH in the supernatants of different samples was diluted to 1% (w/v) by using PBS. 1 mL of the supernatant, of distilled water, or of a 1% (w/v) MH solution was added to filter paper which was cut into a shape of a column (diameter = 1.5 cm, height = 0.2 mm). Either Staphylococcus aureus or Escherichia coli was swabbed on an LB agar plate. After placing the filter paper in the plate and incubating the plate for 24 hours at 37 °C, photos were taken, and the zone of inhibition was measured to determine the growth of bacteria around the sample.3. Results and discussion
3.1 Fabrication of surface-coated alginate-based hydrogel beads
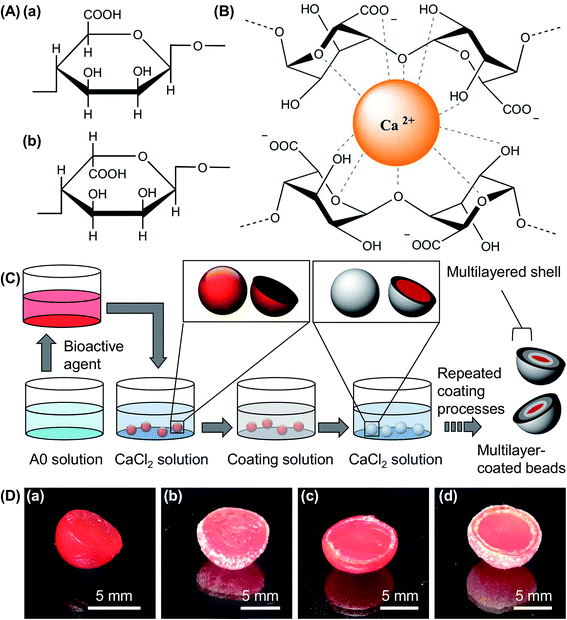
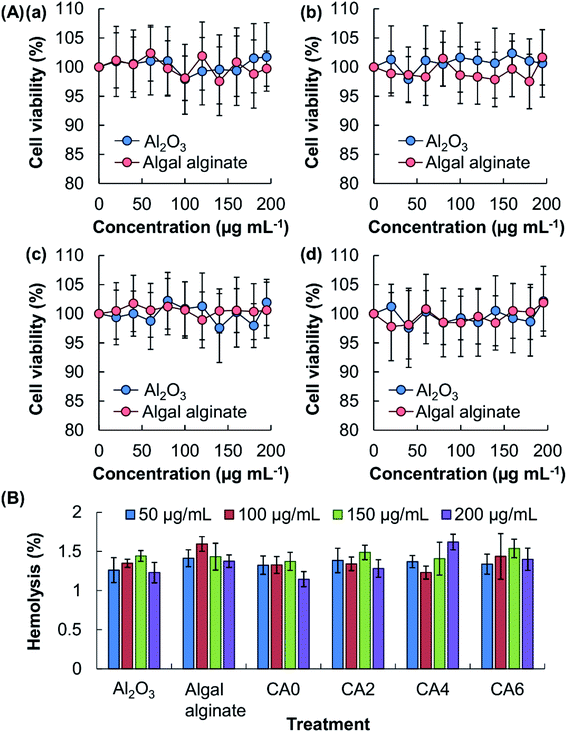
Algal alginate extracted from Sargassum cristaefolium is selected as a gel forming material partly because of its natural source and its high biocompatibility for biomedical and food applications. It comprises α-L-guluronic (G) and β-D-mannuronic (M) acid residues (Fig. 1A),9,10 with the M-blocks and G-blocks interspersed within regions of alternating structures.10,11 Upon an exchange of sodium ions from the G monomers of the sodium salt of algal alginate with divalent ions (e.g., Ca2+ ions),12 a characteristic “egg-box” structure is formed due to the stacking of the G blocks (Fig. 1B),13 leading to the formation of gel matrices for subsequent encapsulation and sustained release of bioactive agents.14 To enable precise tuning of the bioactive agent delivery performance, the hydrogel beads formed are further coated in this study with composite hydrogels (Fig. 1C and D). Because the coating process is mediated by ionic gelation, any materials that form gels ionically with divalent ions can be adopted. The choice of the coating material is, therefore, diverse, and is not affected by the chemical and physical properties of the core.To render the delivery performance tunable and to enhance the strength of the gel, Al2O3, which is the only substratum approved by the U.S. Food, Drug & Cosmetic Act for the production of food lake dyes,6 is adopted to manipulate the properties of the surface coatings. The lack of toxicity of this agent has previously been reported by Yang and co-workers,15 who observed that, after oral exposure of Al2O3, no change in the serum biochemical parameters or the balance of essential trace elements (including Fe, Cu and Zn) occurred in mice. To confirm the high safety profile of constituents of the beads, the toxicity of algal alginate and Al2O3 is examined in vitro by using the MTS assay (Fig. 2A). No apparent loss of cell viability, and hence no acute cytotoxicity, is noted after 5 hours of treatment of the cells with either algal alginate or Al2O3. To evaluate possible chronic cytotoxicity displayed by the bead constituents, the viability of the treated cells is assayed after 24 hour post-treatment incubation. No observable cytotoxicity is found in all concentrations tested. Along with the high biocompatibility of the beads constituents, as well as of the generated beads (CA0, CA2, CA4, and CA6), as revealed by the low hemolytic rates (<2%) (Fig. 2B), the beads demonstrate adequate safety for possible use in bioactive agent delivery.
3.2 Evaluation of gel structures and properties
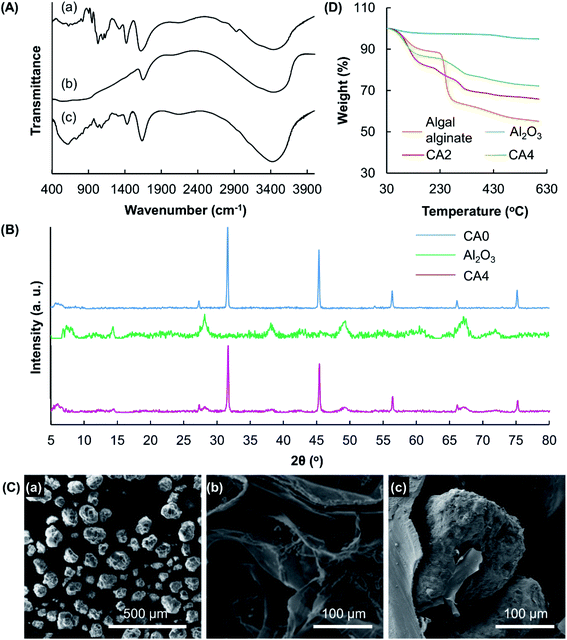
The structures of CA4 and its constituents (algal alginate and Al2O3) are characterized by FT-IR spectroscopy (Fig. 3A). In the FT-IR spectrum of algal alginate, the broad peak at 3412 cm−1 is attributed to the vibrations of the hydroxyl groups. Signals at 1605 and 1411 cm−1 are assigned to the asymmetric and symmetric stretching vibrations of the –COO groups, respectively.16 Characteristic peaks at 1086 cm−1 and 895 cm−1 are caused by the C–O stretching vibrations of the polysaccharide structure and by the vibrations of the Na–O bonds, respectively.17 In the spectrum of Al2O3, the signal at 459 cm−1 is attributed to the Al–O stretching vibrations.18 Multiple peaks appear in the wavenumber range of 500–900 cm−1. This suggests that the lake substratum adopted is in the crystalline form.19 All the characteristic peaks observed in the spectra of Al2O3 and algal alginate are observed in the spectrum of CA4. The XRD pattern of CA0 reveals the presence of crystals formed by CaCl2 inside the gel. Peaks in the spectrum of CA0 are found in the spectrum of CA4, in which peaks specific to Al2O3 are observed (Fig. 3B). This indicates that the crystallinity of the gel formed by algal alginate is not affected by the process of particle reinforcement. Along with SEM analysis which reveals the presence of Al2O3 in the gel matrix (Fig. 3C), the successful incorporation of Al2O3 into the gel system is confirmed.Changes in the thermal properties of the alginate-based gel upon the incorporation of Al2O3 are studied using TGA (Fig. 3D). A weight loss is found up to 110 °C in all samples tested. This weight loss is attributed to the presence of moisture in the samples. Owing to the rupture of the chains and fragments, one weight loss at 215–270 °C is observed in the TGA curve of algal alginate. This weight loss step is also found in the curves of CA2 and CA4. Al2O3 shows very high thermal stability, with only 5% of weight loss observed in total when the sample is heated to 600 °C. Such high thermal stability of Al2O3 explains the observation that the thermal stability of the gel increases with the mass percentage of Al2O3 present.
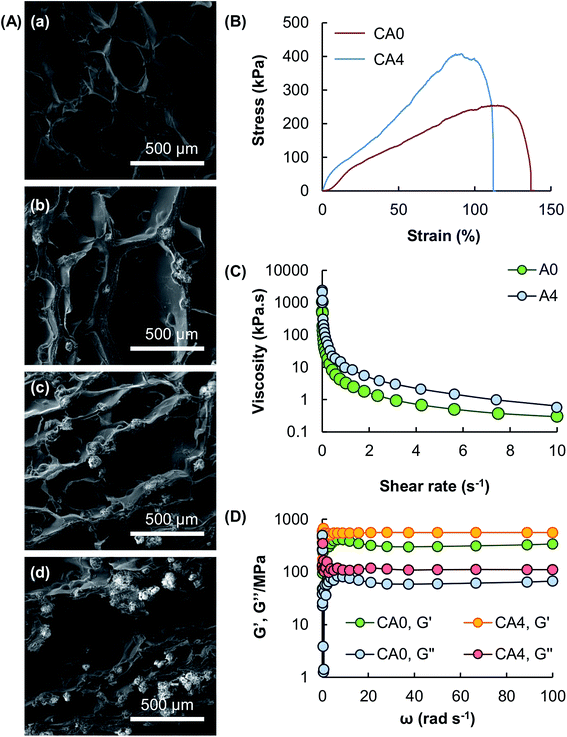
The microstructures of the hydrogel beads containing different mass percentages of Al2O3 are examined using SEM (Fig. 4A). Results show that the porous structure of the gel formed by algal alginate is retained after particle reinforcement. Mechanical tests show that all tested gels possess high stretchability under a tensile force in the magnitude of kilopascals (Fig. 4B). Due to load transfer from the matrix to the reinforcing particles, the tensile strength of the gel is increased, along with a decline in the fracture strain of the gel, upon the addition of Al2O3. This is because the presence of Al2O3 increases the brittleness and hence the ductility level of the gel. Apart from the tensile strength, the rheological properties of the gel are examined. The apparent viscosity of the algal alginate solutions, with or without the presence of Al2O3, is higher at a low shear rate than at a high shear rate (Fig. 4C). This reveals that both A0 and A4 display pseudoplastic behavior. Upon ionic gelation, the G′ values of both CA0 and CA4 are higher than their respective G′′ values (Fig. 4D), revealing that the elastic behavior of the gels predominates over the viscous behavior.
3.3 Effects of aluminum oxide on gel properties
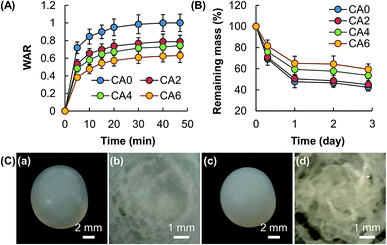
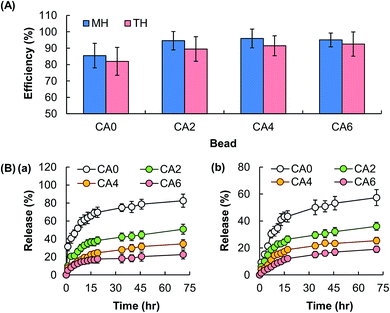
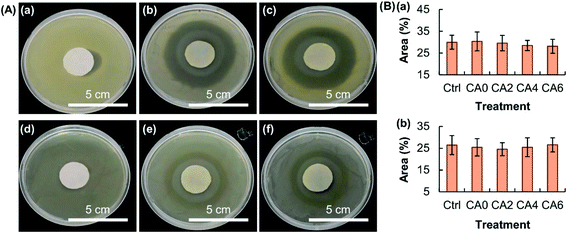
The swelling capacity of a gel is one of the factors determining the release sustainability because water in the gel matrix is a medium through which the molecules of the bioactive agent diffuse.20 As the swelling of a gel depends predominately on the amount of fluids the gel can take up upon hydration, in this study the WAR value, which is widely adopted by other studies as an indicator of the swelling capacity,20,21 is determined. Results reveal that the WAR value of the gel and the mass percentage of Al2O3 are negatively related (Fig. 5A). In addition to the swelling capacity, the release sustainability of a gel system is affected by the process of erosion, which is linked to material degradation caused by crosslink dissolution and bond cleavage.22 Similar to the case of swelling, susceptibility to erosion is negatively related to the amount of Al2O3 added (Fig. 5B). This is partly attributed to the higher mechanical strength of the gel with a higher mass percentage of Al2O3, leading to higher resistance to swelling and erosion. As shown in Fig. 5C, no significant change in the external appearance and size of the bead is observed after immersion in simulated body fluid for one day; however, a closer examination of the cross-section of the bead after lyophilization reveals a remarkable increase in porosity after one day of erosion. This suggests that the matrix of the hydrogel bead degrades evenly from the surface and the interior, and is a feature of bulk erosion.23The EE of the beads is found not to be affected by the process of particle reinforcement (Fig. 6A), though the release sustainability of the beads is positively related to the mass percentage of Al2O3 added (Fig. 6B). The latter is attributed to the increase in the mechanical strength of the gel upon an increase in the amount of Al2O3 present, resulting in a lower degree of swelling and a lower rate of erosion. The retention of the activity of the bioactive agent after the loading process is examined by using MH as a model. MH is a semisynthetic tetracycline derivative displaying broad-spectrum antibiotic activity against Gram-positive and Gram-negative bacteria. Upon loaded into CA0, CA2, CA4 and CA6, the capacity of loaded MH in inhibiting the growth of bacteria is examined by using Staphylococcus aureus (Gram-positive bacteria) and Escherichia coli (Gram-negative bacteria) as models. The area percentage of the zone of inhibition led by loaded MH is the same as that led by free MH (Fig. 7). This reveals that loading into the composite gel has little influence on the bioactive agent activity.
3.4 Tunability of surface-coated beads in bioactive agent delivery
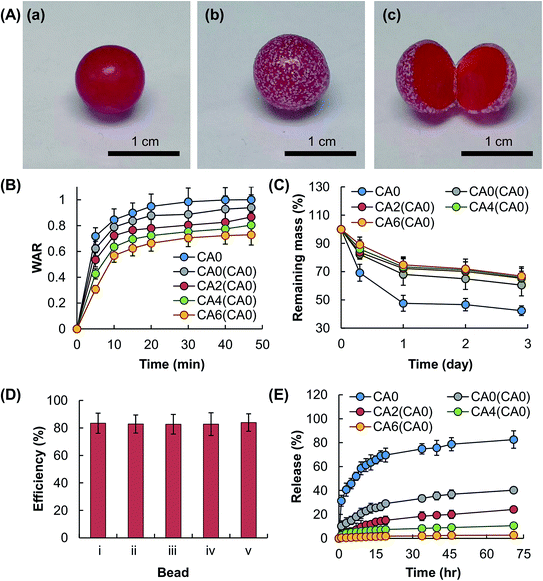
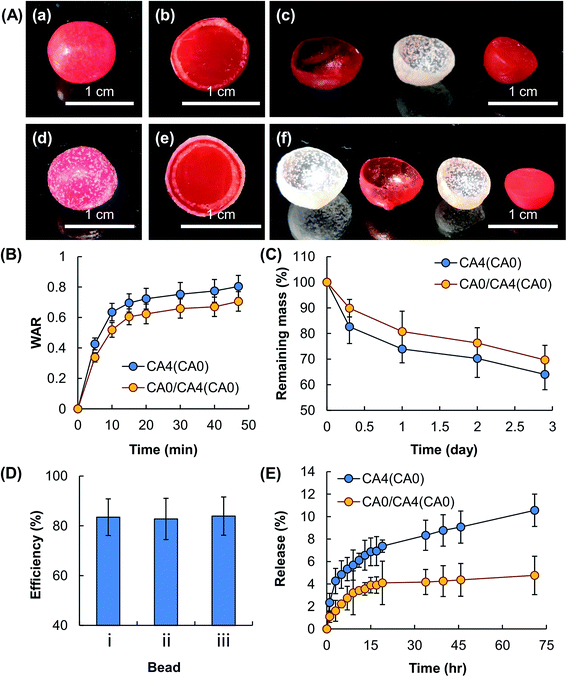
The tunability of the beads in bioactive agent delivery can be enhanced by using the surface coating approach. As illustrated in Fig. 8, the rate of release of the loaded agent from CA0 beads is retarded upon the incorporation of a composite coating, although no significance change in the EE is observed after the coating process. The effect on bioactive agent release sustainability is attributed partly to the inhibiting action of the coating on the overall swelling capacity and erosion susceptibility of the beads. Such action is enhanced as the concentration of Al2O3 present in the coating increases, leading to a reduction in the rate of diffusion of the molecules of the bioactive agent from the gel matrix. In addition, the presence of the coating per se increases the diffusion distance of the loaded molecules from the beads to the surrounding medium. This further enhances the release sustainability of the beads. Apart from manipulating the coating composition, the rate of bioactive agent release can be controlled by changing the number of coatings incorporated. This is demonstrated by Fig. 9, in which the swelling capacity, erosion susceptibility and finally the rate of bioactive agent release of CA4(CA0) are shown to be reduced by the presence of a surface coating consisting of CA0. Similar to the case of CA0 beads, incorporation of a coating on CA4(CA0) beads leads to negligible effects on the efficiency of the beads in bioactive agent encapsulation.Besides gel swelling and erosion, other factors (including interactions between the loaded compound and the gel, the size of the loaded molecules, and the aqueous solubility of the loaded compound) play a role in determining the overall rate of diffusion of the loaded molecules.24 This is partly demonstrated by the observation that, despite MH and TH are loaded into the beads having exactly the same composition; the overall rates of bioactive agent release are different (Fig. 6B). The properties of the molecules of the bioactive agent, unfortunately, can hardly been tuned in practice because this involves the manipulation of the structure of the agent per se. Changing them is often equivalent to changing the choice of the agent. Our results demonstrate that by manipulating the number and composition of the composite coating, the effects of factors related to the loaded agent on the ultimate rate of bioactive agent release can be tuned regardless of the fact that the properties of the molecules of the loaded bioactive agent per se have not been altered.
4. Conclusions
Surface coating is one of the extensively used strategies to manipulate and modify the performance of carriers for delivery of bioactive agents.25 By taking advantage of the accumulated knowledge of surface coating techniques, as well as the unique advantage of our coating strategy in which the coating process does not rely on interactions between the core and the coating agent, our method can be easily applied to any coating materials (ranging from chitosan to carboxymethyl cellulose) that can undergo ionic gelation without requiring much consideration of the chemical properties and surface charge of the core. In this study, the formation of droplets of the algal alginate solution relies solely on jet breakup caused by Rayleigh–Plateau instability, along partly with the high viscosity of the coating agent and the resulting thick coating layer, the size of the generated hydrogel beads is in the millimeter-size range and can hardly be further reduced to the micron scale. The current size range is enough for diverse applications ranging from oral delivery of bioactive agents to the formulation of sustained-release depots for cutaneous drug administration. If having micron-sized beads is required, other techniques (e.g., electrospray26 and microfluidic flow focusing27) will have to be applied so that the size of the hydrogel cores as well as that of the resulting coated beads can be further reduced. Changes in the size may, however, alter other properties (e.g., the diffusion distance of the loaded molecules, and the surface area-to-volume ratio of the bead), leading to changes in the ultimate performance of the coated beads in bioactive agent delivery. Further characterization of the performance will be needed to evaluate the impact of size reduction on delivery efficiency. Nevertheless, results in this study demonstrate the successful control of the overall swelling and erosion behavior, and hence the delivery performance, of the beads via incorporation of composite coatings. Our reported strategy enables manipulation of the rate of diffusion of the molecules of the loaded agent from the gel matrix for controlled and sustained release.Conflicts of interest
The authors report no conflicts of interest. The authors alone are responsible for the content and writing of this article.Acknowledgements
This work was supported by the Chinese University of Hong Kong (Shenzhen) [PF01001421, UF0200142, and UDF01001421], by Natural Science Foundation of Guangdong Province [2018A030310485], by Shenzhen Key Laboratory Project [ZDSYS20190902093417963], and by Research Grants Council of the Government of Hong Kong Special Administrative Region [C5012-15].References
- W. F. Lai and Z. D. He, J. Contr. Release, 2016, 243, 269–282 Search PubMed; W. F. Lai, C. Hu, G. Deng, K. H. Lui, X. Wang, T. H. Tsoi, S. Wang and W. T. Wong, Int. J. Pharm., 2019, 566, 101–110 Search PubMed.
- W. F. Lai, A. S. Susha and A. L. Rogach, ACS Appl. Mater. Interfaces, 2016, 8, 871–880 Search PubMed; W. F. Lai, R. Tang and W. T. Wong, Pharmaceutics, 2020, 12, 725 Search PubMed; W. F. Lai and H. C. Shum, Nanoscale, 2016, 8, 517–528 Search PubMed; K. Kanimozhi, S. KhaleelBasha, V. SuganthaKumari and K. Kaviyarasu, J. Nanosci. Nanotechnol., 2019, 19, 2493–2500 Search PubMed; C. N. Cheaburu-Yilmaz, C. E. Lupusoru and C. Vasile, Polymers, 2019, 11, 366 Search PubMed.
- P. Severino, C. F. da Silva, L. N. Andrade, D. de Lima Oliveira, J. Campos and E. B. Souto, Curr. Pharm. Des., 2019, 25, 1312–1334 Search PubMed; N. T. T. Uyen, Z. A. A. Hamid, N. X. T. Tram and N. Ahmad, Int. J. Biol. Macromol., 2019, 153, 1035–1046 Search PubMed; D. Jain and D. Bar-Shalom, Drug Dev. Ind. Pharm., 2014, 40, 1576–1584 Search PubMed.
- T. Huang, H. G. Xu, K. X. Jiao, L. P. Zhu, H. R. Brown and H. L. Wang, Adv. Mater., 2007, 19, 1622–1626 Search PubMed.
- H. Zhang, J. Y. Zhang, H. L. Wang, P. J. Luo and J. B. Zhang, Biomed. Environ. Sci., 2016, 29, 461–466 Search PubMed.
- M. G. Soni, S. M. White, W. G. Flamm and G. A. Burdock, Regul. Toxicol. Pharmacol., 2001, 33, 66–79 Search PubMed.
- D. S. Brauer, N. Karpukhina, M. D. O'Donnell, R. V. Law and R. G. Hill, Acta Biomater., 2010, 6, 3275–3282 Search PubMed.
- W. F. Lai and H. C. Shum, ACS Appl. Mater. Interfaces, 2015, 7, 10501–10510 Search PubMed.
- H. Rabille, T. A. Torode, B. Tesson, A. Le Bail, B. Billoud, E. Rolland, S. Le Panse, M. Jam and B. Charrier, Sci. Rep., 2019, 9, 12956 Search PubMed.
- B. A. Aderibigbe and B. Buyana, Pharmaceutics, 2018, 10, 42 Search PubMed.
- M. George and T. E. Abraham, J. Contr. Release, 2006, 114, 1–14 Search PubMed.
- J. P. Paques, E. van der Linden, C. J. M. van Rijn and L. M. C. Sagis, Adv. Colloid Interface Sci., 2014, 209, 163–171 Search PubMed.
- R. Poojari and R. Srivastava, Expet Opin. Drug Deliv., 2013, 10, 1061–1076 Search PubMed.
- C. N. Zhang, W. Wang, C. H. Wang, Q. Tian, W. Huang, Z. Yuan and X. S. Chen, Sci. China, Ser. B, 2009, 52, 1382–1387 Search PubMed.
- S. T. Yang, T. Wang, E. Dong, X. X. Chen, K. Xiang, J. H. Liu, Y. Liu and H. Wang, Toxicol. Res., 2012, 1, 69–74 Search PubMed.
- C. Sartori, D. S. Finch, B. Ralph and K. Gilding, Polymer, 1997, 38, 43–51 Search PubMed.
- K. Varaprasad, G. M. Raghavendra, T. Jayaramudu and J. Seo, Carbohydr. Polym., 2016, 135, 349–355 Search PubMed.
- L. Saravanan and S. Subramanian, J. Colloid Interface Sci., 2005, 284, 363–377 Search PubMed.
- V. S. Giri, R. Sarathi and S. R. Chakravarthy, Mater. Lett., 2004, 58, 1047–1050 Search PubMed.
- M. B. Mellott, K. Searcy and M. V. Pishko, Biomaterials, 2001, 22, 929–941 Search PubMed.
- J. W. Lee, S. Y. Kim, S. S. Kim, Y. M. Lee, K. H. Lee and S. J. Kim, J. Appl. Polym. Sci., 1999, 73, 113–120 Search PubMed.
- Z. P. Zhang and S. S. Feng, Biomaterials, 2006, 27, 262–270 Search PubMed.
- J. Fernandez, A. Larranaga, A. Etxeberria and J. R. Sarasua, Polym. Degrad. Stab., 2013, 98, 481–489 Search PubMed.
- H. Sjoberg, S. Persson and N. Caram-Lelham, J. Contr. Release, 1999, 59, 391–400 Search PubMed.
- R. Thenmozhi, M. S. Moorthy, J. Sivaguru, P. Manivasagan, S. Bharathiraja, Y. O. Oh and J. Oh, J. Nanosci. Nanotechnol., 2019, 19, 1951–1958 Search PubMed; V. Piazzini, E. Landucci, M. D'Ambrosio, L. Tiozzo Fasiolo, L. Cinci, G. Colombo, D. E. Pellegrini-Giampietro, A. R. Bilia, C. Luceri and M. C. Bergonzi, Int. J. Biol. Macromol., 2019, 129, 267–280 Search PubMed; M. Mohammed, H. Mansell, A. Shoker, K. M. Wasan and E. K. Wasan, Drug Dev. Ind. Pharm., 2019, 45, 76–87 Search PubMed.
- W. F. Lai, A. S. Susha, A. L. Rogach, G. A. Wang, W. J. Hu, M. J. Huang and W. T. Wong, RSC Adv., 2017, 7, 44482–44491 Search PubMed.
- W. F. Lai, Curr. Gene Ther., 2015, 15, 55–63 Search PubMed; R. Samanipour, Z. J. Wang, A. Ahmadi and K. Kim, J. Appl. Polym. Sci., 2016, 133, 43701 Search PubMed.
| This journal is © The Royal Society of Chemistry 2020 |

