 Open Access Article
Magnetically separable Zn1−xCo0.5xMg0.5xFe2O4 ferrites: stable and efficient sunlight-driven photocatalyst for environmental remediation
Kundan Jangama,
Kundan Patila,
Sagar Balgude *b,
Sunil Patangec and
Paresh More*a
aDepartment of Chemistry, K. E. T's, V. G. Vaze College, Maharashtra, India. E-mail: paresh.m34@gmail.com
bDepartment of Chemistry, D. Y. Patil University, Maharashtra, India. E-mail: sagarbalgude88@gmail.com
cDepartment of Physics, Shrikrishna Mahavidyalaya Gunjoti, Maharashtra, India
First published on 25th November 2020
Abstract
Nanomaterials have recently gained significant interest as they are believed to offer an outstanding prospect for use in environmental remediation. Among many possible candidates, due to their useful properties including magnetic nature, wide surface area, and high absorptivity, ferrite materials hold tremendous appeal, allowing them to be used for multifaceted applications. In the present study, using a sol–gel auto combustion process, a magnetically separable Zn1−xCo0.5xMg0.5xFe2O4 (x = 0.0, 0.25, 0.50, 0.75, 1.0) ferrite with superior photocatalytic activity for dye degradation was manufactured. Rietveld refinement and FTIR studies confirm that a single-phase cubic spinel system was built for all samples with crystallite sizes of 34–57 nm. VSM has determined the magnetic properties of the samples at room temperature. With the introduction of Mg2+ and Co2+ in the Zn ferrites, a transformation from the soft superparamagnetic activity to the hard ferromagnetic character was reported. Considering the band structure in the visible region, the photocatalytic activities of the Zn1−xCo0.5xMg0.5xFe2O4 ferrites for the degradation of the MB dye under natural sunlight were investigated. Zn0.25Co0.375Mg0.375Fe2O4 showed an efficiency of degradation of 99.23% for MB dye with a quick 40 min irradiation period with high reusability of up to four cycles.
1. Introduction
Spinel ferrites have been extensively studied for several decades because of their versatile and promising magnetic, optical, electrical, and chemical properties, which often vary from their bulk counterpart.1,2 Some important applications (including magnetic sensors, catalysis, MRI imaging, supercapacitors, and antibacterial agents) attract spinal ferrites.3–7 Recently, research studies have more focused on the synthesis of spinel ferrites with a general formula of AFe2O4, where A stands for metals, such as Co, Mg, Zn, Ni, Mn. Several forms of magnetic ferrites, such as manganese ferrite (MnFe2O4), cobalt ferrite (CoFe2O4), zinc ferrite (ZnFe2O4), and copper ferrite (CuFe2O4), have been reported to exhibit excellent catalytic and photocatalytic operation. Various chemical methods have been thoroughly investigated for the synthesis of well-dispersed spinel ferries, such as solvothermal, chemical co-precipitation, microwave, and sol–gel auto combustion.8–11 Due to its simplicity, lower time and energy, and environmental safety, the sol–gel auto combustion method has attracted considerable attention among the various methods.In the past decade, environmental pollution has increased the extreme overall anxiety. For instance, the release of industrial wastewater containing synthetic pigments, phenolic derivatives, and organic colouring contributes to significant environmental hazards. These contaminants are non-degradable and thus cause the aquatic life to have a serious problem. Nanomaterials play a very vital role in the degradation of effluents released from dyes and textile industries.12,13 As photocatalysts that act as sensitizers for light-induced redox processes, various semiconducting materials (such as TiO2, ZnO, and Sn3O4) have customarily been used.14–16 Recently, spinel ferrites are important photocatalysts used for environmental remediation.17,18 Its stability, abundant availability, non-toxicity, and simple synthesis make it an economically and environmentally interesting choice for the removal of aqueous organic contaminants in AOPs.19–21 The spinel ferrites exhibit a bandgap in the visible region. In view of the bandgap in the visible region, several researchers have synthesized various ferrites, and researched their morphological and optical properties. For example, Cao et al. studied the photocatalytic degradation of the MB dye using the CES-derived zinc ferrite,22 and Yang et al. demonstrated the fabrication of Cr and Mn-doped zinc ferrite nanospheres using industrial waste. The synthesized ferrites were tested for the degradation of Congo red dye.23 Mohammad et al. reported the hydrothermal route for the synthesis of cobalt ferrites, revealing an enhanced activity for the degradation of Reactive red 4 dye.24 Borhan et al. designed the ZnFe2−xAlxO4 ferrites using the sol–gel auto combustion method for the photodegradation of Orange I dye.25 Mahmoodi et al. reported the degradation of Reactive red 120 and Reactive red 198 dye using magnetically separable zinc ferrites.26 Satya et al. studied the removal of cationic triarylmethane dyes in contaminated water using spinel cobalt ferrites.27 Ikram et al. have reported on CoFe2O4 and MnFe2O4 nanocrystals by microwave-assisted and co-precipitation methods, respectively, and the catalyst showed excellent results in the photodegradation of the MB dye.28 These studies highlighted that while some great work has been done on photocatalysis, the catalytic performance remains unsatisfactory, and further work is still needed to explore new approaches to improve it. In this context, the present work is the first report on the synthesis of Zn1−xCo0.5xMg0.5xFe2O4 ferrites and its photocatalytic activity under natural sunlight.
Herein, we synthesized Zn1−xCo0.5xMg0.5xFe2O4 ferrites using a cost-effective and simple sol–gel auto combustion method. The photocatalytic activity of the as-synthesized ferrites under solar light irradiation was tested for degradation of the methylene blue dye. The magnetic, physicochemical, optical, and morphological properties of the as-synthesized Zn1−xCo0.5xMg0.5xFe2O4 ferrites were elucidated by characterization using various analytical techniques. A plausible photocatalytic mechanism for the degradation of the MB dye in the Zn1−xCo0.5xMg0.5xFe2O4 ferrites was also suggested.
2. Experimental details
2.1 Synthesis
Zn(NO3)2·6H2O, Co(NO3)2·6H2O, Mg(NO3)2·6H2O, and Fe(NO3)3·9H2O were procured from Merck (India). Cobalt and magnesium-doped Zn1−xCo0.5xMg0.5xFe2O4 (x = 0.0, 0.25, 0.50, 0.75, 1.0) ferrites were synthesized using the sol–gel auto combustion method. During synthesis, the aqueous solution was prepared by taking all of the nitrates and glycine in a 1![[thin space (1/6-em)]](https://www.rsc.org/images/entities/char_2009.gif) :
:![[thin space (1/6-em)]](https://www.rsc.org/images/entities/char_2009.gif) 3 molar ratio in water. The as-formed homogeneous mixture was stirred well, and the pH of the reaction mixture was adjusted to 7–8 with liq. NH3 to form “sol”. To obtain a viscous gel, the viscous fluid was condensed or hardened to form the ‘gel’, and the sol was placed on the hot plate at 90 °C. On the hot plate, this homogeneous gel was ignited. The glycine was then completely combusted, yielding Zn1−xCo0.5xMg0.5xFe2O4 ferrites. The as-synthesized samples of ferrites were ground well, and then annealed in the furnace at 800 °C for five hours. The obtained samples were labeled as ZF1 (X = 0.0), ZCMF1 (X = 0.25), ZCMF2 (X = 0.50), ZCMF3 (X = 0.75) and as CMF (X = 1.0), respectively, and were characterized using various techniques.
3 molar ratio in water. The as-formed homogeneous mixture was stirred well, and the pH of the reaction mixture was adjusted to 7–8 with liq. NH3 to form “sol”. To obtain a viscous gel, the viscous fluid was condensed or hardened to form the ‘gel’, and the sol was placed on the hot plate at 90 °C. On the hot plate, this homogeneous gel was ignited. The glycine was then completely combusted, yielding Zn1−xCo0.5xMg0.5xFe2O4 ferrites. The as-synthesized samples of ferrites were ground well, and then annealed in the furnace at 800 °C for five hours. The obtained samples were labeled as ZF1 (X = 0.0), ZCMF1 (X = 0.25), ZCMF2 (X = 0.50), ZCMF3 (X = 0.75) and as CMF (X = 1.0), respectively, and were characterized using various techniques.
2.2 Characterization
This XRD pattern of the Zn1−xCo0.5xMg0.5xFe2O4 ferrites was recorded on Philips (Xpert) X-ray diffractometer using Cu Kα radiation having wavelength 1.540 Å at room temperature. The morphology investigation of the Zn1−xCo0.5xMg0.5xFe2O4 ferrites can be done using JEOL JSM-7600F, FEG-SEM instrumentation. The optical properties were recorded by UV-visible spectrophotometer (Shimadzu make model 1800). The analysis of the magnetic properties was carried out by Quantum Design USA to make the SQUID system (Model MPMS XL). FTIR spectra of all samples were recorded on a 3000 Hyperion Microscope with vertex 80 FTIR using KBr pellets in the range of 400 to 4000 cm−1.2.3 Photocatalytic activity
The as-synthesized Zn1−xCo0.5xMg0.5xFe2O4 ferrites were tested using methylene blue (MB) dye as a model contaminant for its photodegradation behavior. For the photoreactor, the Pyrex beaker used was 250 mL. To ensure healthy adsorption, 100 mL, 10 ppm aqueous MB dye solution containing 0.2 g of the catalyst was stirred in the dark before sunlight irradiation. They were exposed to sunlight after 1 hour of suspension. Reaction samples were collected at regular intervals, and a UV-visible spectrophotometer was used to check the residual MB dye content.3. Results & discussion
The crystalline structure of the Zn1−xCo0.5xMg0.5xFe2O4 ferrites was investigated by the Rietveld refinement XRD pattern. Fig. 1 shows the XRD and Rietveld refinement patterns of cobalt and magnesium-doped Zn1−xCo0.5xMg0.5xFe2O4 (x = 0.0 to 1.0) ferrites. Form the figure, all diffraction peaks in the XRD spectra were indexed to the (111), (220), (311), (222), (400), (422), (511), and (440) planes of the cubic spinel phase. The measured diffraction peaks of ZF, ZCMF1, ZCMF2, ZCMF3, and CMF ferrites are in accordance with JCPDS card no. 22-1012.29 The as-synthesized ferrites are polycrystalline in a single phase without any other impurity phases. It can also be found that the substitution of Zn by the substance of Co–Mg does not alter the structure of the cubic spinel zinc ferrite.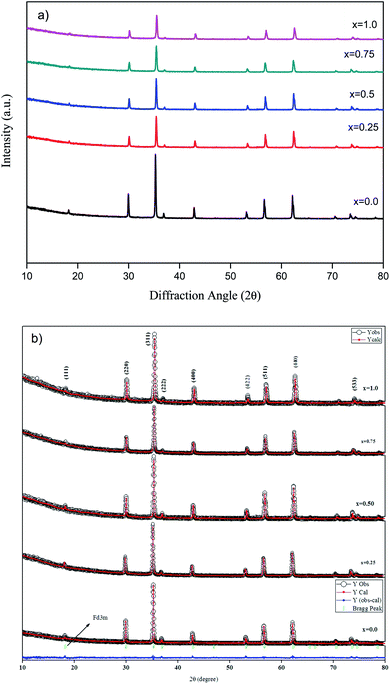 | ||
| Fig. 1 (a) XRD and (b) Rietveld refinement spectra of Zn1−xCo0.5xMg0.5xFe2O4 (x = 0.0 to 1.0) ferrites. | ||
The efficiency of refinement is defined by the consideration of the goodness-of-fit (χ2). The findings obtained in the Rietveld refinement on the X-ray diffraction of the Zn1−xCo0.5xMg0.5xFe2O4 ferrites systems are listed in Table 1. From Table 1, the Rietveld refinement of the goodness-of-fit (χ2) ranged from 1.05 to 1.82, and the low value of the fitting factor is attributed as an excellent result value. The profile fitting is better with lower χ2 values; hence, the procedure adopted for the profile fitting is by minimizing the χ2 function. Fig. 2 and Table 1 demonstrate the theoretical and observed lattice constant of Zn1−xCo0.5xMg0.5xFe2O4 (x = 0.0 to 1.0) ferrites, and the values are very much in agreement. Fig. 2 shows that the lattice parameter decreases from (x = 0.0 to 1.0), and that the decrease in the lattice parameters is in accordance with Vegards law.30 Furthermore, the close observations from the figure indicate that the ath value is greater than the aobs value. This is because the ideal spinel structure was considered a rigid sphere for measuring the ath value with cations and anions. The crystallite size of the as-synthesized ferrites was calculated using the Debye–Scherrer equation, and the most intense 311 peak was chosen for measuring the crystallite size:30
d = 0.9λ/β![[thin space (1/6-em)]](https://www.rsc.org/images/entities/char_2009.gif) cos cos![[thin space (1/6-em)]](https://www.rsc.org/images/entities/char_2009.gif) θ θ |
| Comp. | χ2 | aobs (Å) | ath (Å) | rA (Å) | rB (Å) | u (Å) | d (nm) | dx (g cm−3) |
|---|---|---|---|---|---|---|---|---|
| ZF | 1.82 | 8.4539 | 8.463 | 0.74 | 0.67 | 0.3906 | 57.25 | 5.2739 |
| ZCMF1 | 1.4 | 8.4412 | 8.448 | 0.739 | 0.6702 | 0.3908 | 52.43 | 5.1736 |
| ZCMF2 | 1.26 | 8.4280 | 8.429 | 0.737 | 0.6704 | 0.391 | 48.57 | 5.0878 |
| ZCMF3 | 1.05 | 8.4062 | 8.407 | 0.736 | 0.6705 | 0.3912 | 42.13 | 4.9872 |
| CMF | 1.47 | 8.3856 | 8.385 | 0.735 | 0.6707 | 0.3915 | 34.19 | 4.8974 |
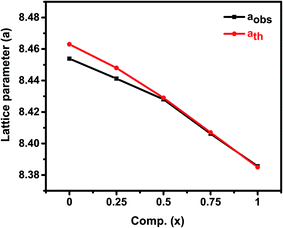 | ||
| Fig. 2 Theoretical and observed lattice parameters of Zn1−xCo0.5xMg0.5xFe2O4 (x = 0.0 to 1.0) ferrites. | ||
The Bertaut method was used in spinel ferrite to assess the site occupancy.34 This is calculated from the study of the Zn1−xCo0.5xMg0.5xFe2O4 (x = 0.0 to 1.0) X-ray diffraction pattern. The exact information on the cation distribution was obtained by comparing the intensity ratio (experimental and calculated) for the reflections, whose intensities: (i) vary with cation distribution in opposite ways, (ii) are almost independent of the oxygen position parameter, and (iii) are not significantly different. The distribution of cations at the tetrahedral site and octahedral site is shown in Table 1. The trivalent Fe3+ ions are distributed both at the tetrahedral and octahedral sites due to the simultaneous doping of cobalt and magnesium ions. Cobalt ions push Fe3+ ions to the tetrahedral sites, and this results in the distribution of Fe3+ ions over the tetrahedral A and octahedral B sites. However, it does show maximum occupancy at the B site. This is due to the greater ionic radius of the Zn2+ ion (0.82 Å). It appears to live on the tetrahedral site, and displaces the smaller Fe3+ (0.67 Å) ions and Co2+ (0.74 Å) ions at the expense of the Mg2+ (0.66 Å) ions from the tetrahedral sites to the octahedral sites. The data given in Table 2 shows that the octahedral sites are primarily occupied by Fe3+ ions. This is simply due to the increased energy from the octahedral sites. The radius of the tetrahedral A site (rA) and the radius of the octahedral B site (rB) were calculated, and are depicted in Table 1 using a modified relation discussed elsewhere.35 With the increased concentration of cobalt and magnesium, and the decreased concentration of zinc, the rA and rB values increased. Similar results have been reported in the cobalt substituted in Ni–Zn ferrites.36 The oxygen positional parameter (u) values are tabulated in Table 1. The value of the oxygen positional parameter is nearly equal to 0.375 Å in the spinel structure. The as-synthesized samples show a small increment in the oxygen positional parameter (u) value in comparison to the ideal value. These may be attributed to different causes, experimental mistakes or failures in the calculation. For most samples, u > 0.375 is obtained from the expansion of the tetrahedral interstitials due to the slight displacement of anions. The spatial coordinates of oxygen (u) in this series are always greater than 0.375, which can be due to the displacement of anions from the ideal positions.35 The disturbance in the lattice is confirmed from the data of the lattice constants and oxygen positional parameters (u).
| Comp. | Chemical formulae | Occupancy of cations | |
|---|---|---|---|
| A site | B site | ||
| ZF | ZnFe2O4 | Zn1 | Fe2 |
| ZCMF1 | Zn0.75Co0.125Mg0.125Fe2O4 | Zn0.75Mg0.0125Co0.1125Fe0.225 | Mg0.1125Co0.0125Fe1.775 |
| ZCMF2 | Zn0.50Co0.25Mg0.25Fe2O4 | Zn0.50Mg0.12Co0.015Fe0.365 | Mg0.13Co0.235Fe1.635 |
| ZCMF3 | Zn0.25Co0.375Mg0.375Fe2O4 | Zn0.25Mg0.2Co0.02Fe0.53 | Mg0.175Co0.355Fe1.47 |
| CMF | Co0.50Mg0.50Fe2O4 | Mg0.3Co0.025Fe0.675 | Mg0.2Co0.350Fe1.325 |
Infrared spectroscopy is an effective spectroscopic technique for obtaining information about the position of the metal ions in the crystal lattice through the presence of various vibrational modes in the crystal lattice.37 Fig. 3a shows the FTIR spectra of the Zn1−xCo0.5xMg0.5xFe2O4 ferrites. Two characteristic bands are present; the lower frequency band at 424 cm−1 corresponds to the intrinsic vibrations of the octahedral sites, whereas the higher frequency band at 545 cm−1 corresponds to the intrinsic vibrations of the tetrahedral sites. From Fig. 3b, it can be observed that with an increase in the content of Co2+ and Mg2+ (ZF to CMF), the low-frequency band (Mtet–O) slightly shifted to the lower frequency side, whereas the higher frequency band (Moct–O) slightly shifted to the higher frequency side. These shifts are observed due to the changes in mass at sites A and B, such as replacing the tetrahedral Zn2+ ion with the lighter Co2+ and Mg2+ ions, at the same time as both ions transfer a few Fe3+ ions from the octahedral site to the tetrahedral site. The shift in the peaks of the A sites is greater than B sites, which indicates that the Co2+ and Mg2+ ions preferably go to the B sites, and some of the Fe3+ ions transfer to the A sites, resulting in substantial increases in the stretching tetrahedral vibrations. The same results are also confirmed from the cation distribution analysis.38
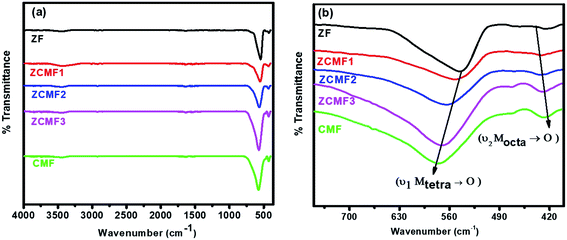 | ||
| Fig. 3 FTIR absorption spectra of Zn1−xCo0.5xMg0.5xFe2O4 (x = 0.0 to 1.0) ferrites (a) in the range of 400–4000 cm−1 and (b) in the range of 400 to 700 cm−1. | ||
Morphological analysis of the as-synthesized Zn1−xCo0.5xMg0.5xFe2O4 ferrites was achieved using field emission scanning electron microscopy (FESEM). Fig. 4 displays the FESEM images of the as-synthesized cobalt and magnesium-doped Zn1−xCo0.5xMg0.5xFe2O4 ferrites, respectively. From Fig. 4a, it can be seen that the high magnification image at 200 nm depicts the agglomerated morphology made up of secondary irregular shaped spherical nanoparticles. The size of these nanoparticles is found in the range of 40–70 nm. With cobalt and magnesium-doping in Zn1−xCo0.5xMg0.5xFe2O4 (ZCMF1, ZCMF2, ZCMF3, CMF), the greater agglomeration of the spherically formed nanoparticles was observed with a subsequent reduction in the crystalline size. The agglomeration for the higher concentrations of cobalt and magnesium is due to the ferromagnetic Co2+ substitution and diamagnetic Zn2+ replacement. More crystallinity was observed for the undoped ZF1 sample. The agglomeration can be attributed to the magnetic nature of the samples, and this result was also confirmed by VSM analysis. Energy-dispersive X-ray analysis of the as-synthesized Zn1−xCo0.5xMg0.5xFe2O4 ferrite was performed to investigate the elemental composition. Fig. 4b depicts the peaks of the Zn, Fe, O elements for undoped ZnFe2O4 (ZF1). Fig. 4d, f and h showed the peaks of the Zn, Co, Mg, Fe, O elements for ZCMF1, ZCMF2, and ZCMF3 ferrites, respectively. The sample CMF shows the peaks of Co, Mg, Fe, O elements. The stoichiometric ratios used for the synthesis of nanoferrites closely matches with the corresponding EDS results. No impurity peaks observed in the as-synthesized nanoferrites indicates the purity of the synthesized nanoferrites.
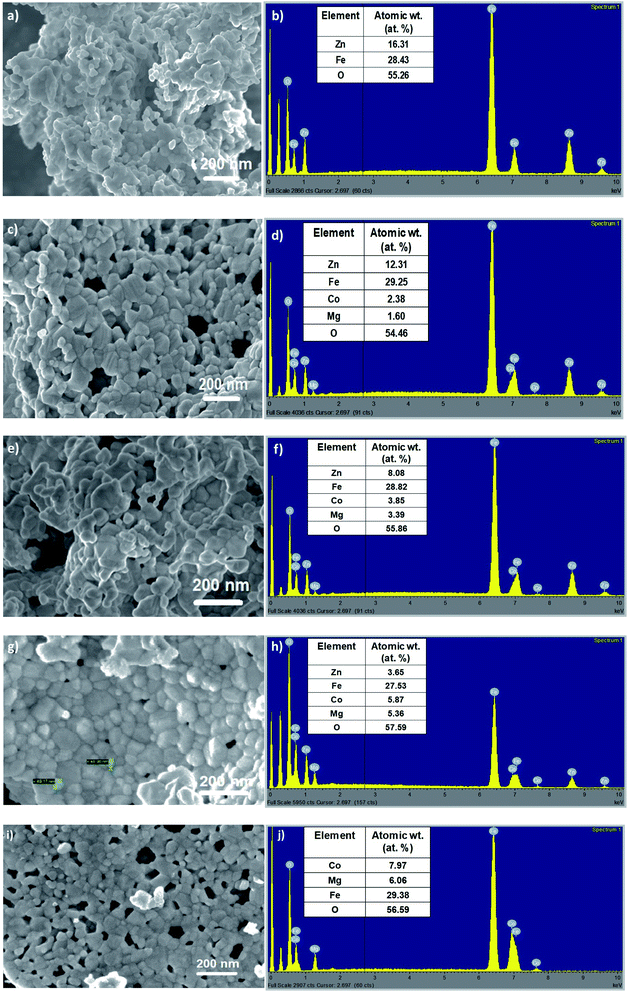 | ||
| Fig. 4 FESEM and EDS images of the as-synthesized (a and b) ZF, (c and d) ZCMF1, (e and f) ZCMF2, (g and h) ZCMF3, and (i and j) CMF, respectively. | ||
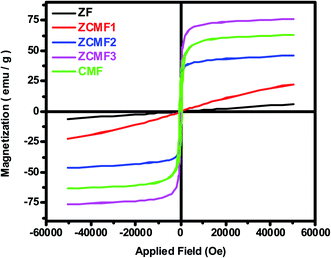
Fig. 5 shows the magnetic hysteresis loops that were recorded at room temperature for the as-synthesized Zn1−xCo0.5xMg0.5xFe2O4 ferrites. The magnetic parameters obtained from the hysteresis loops, such as the remanent magnetization (Mr), saturation magnetization (Ms), coercivity (Hc), squareness ratio (Mr/Ms), and magnetic moment (nB), are summarized in Table 3. When the Co2+ and Mg2+ dopants are introduced into a soft paramagnetic ZnFe2O4, they are transformed into hard ferrimagnetic materials. The Ms value of the Zn1−xCo0.5xMg0.5xFe2O4 ferrite nanoparticles depends on the distribution of the magnetic Co2+ (d7) and Fe3+ (d5) ions, as well as both Mg2+ (d0) and Zn2+ (d10) ions, which are non-magnetic in nature between the A sites (tetrahedral) and B sites (octahedral). According to the previous literature, ZnFe2O4 displays a regular spinel structure, where the Zn2+ ions occupy the tetrahedral (A) sites, and the octahedral (B) sites are occupied by Fe3+ ions. When the Zn2+ ions are replaced by Co2+ or Mg2+ ions, they always prefer the octahedral positions. This leads to a reverse spinal structure, and move the Fe3+ ions from the octahedral B sites to tetrahedral A sites.39 This will contribute to Fe3+ ion redistribution on the tetrahedral and octahedral sites. In the present work, it was found that the Ms value (Fig. 6a) of the nanoparticles slowly increased with the increase of the content of Co2+ and Mg2+ until x = 0.75, which is observed due to the magnetic Co2+ ions occupying the octahedral B sites preferentially, and then unexpectedly decreased if x was greater than 0.75, i.e., CMF as indicated in Table 3. The decrease in the magnetization was observed as the concentration of the Mg2+ ions increased, and the non-magnetic Mg2+ tends to occupy the octahedral B sites that move the magnetic Fe3+ ions to the tetrahedral A site. The remnant magnetization (Fig. 6b) and coercivity (Fig. 6c) are gradually increased with the introduction of Co2+ and Mg2+ dopants in ZnFe2O4, which suggests that the soft magnetic materials are transformed into hard magnetic materials. Furthermore, Table 3 demonstrates the superparamagnetic nature of samples ZF to ZCMF2 (x = 0.0 to x = 0.50), and the composition x = 0.75 and 1.0 (ZCMF3 and CMF) have Mr/Ms ratios greater than 0.10. Hence, these samples exhibit ferromagnetism.40
| Comp. | Ms emu g−1 | Mr emu g−1 | Mr/Ms | Hc Oe | nB μB |
|---|---|---|---|---|---|
| ZF | 6.16 | 0.0019 | 0.00031 | 8.32 | 0.26 |
| ZCMF1 | 22.59 | 0.0097 | 0.00043 | 12.05 | 0.94 |
| ZCMF2 | 46.27 | 4.1493 | 0.08968 | 26.29 | 1.88 |
| ZCMF3 | 76.13 | 21.8424 | 0.28691 | 92.34 | 3.02 |
| CMF | 63.09 | 28.1948 | 0.4469 | 216.47 | 2.43 |
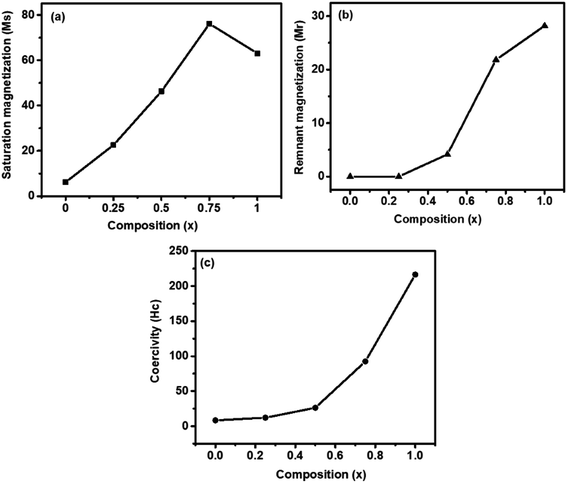 | ||
| Fig. 6 VSM results of Zn1−xCo0.5xMg0.5xFe2O4 (x = 0.0 to 1.0) ferrites: (a) saturation magnetization (Ms), (b) remanent magnetization (Mr), and (c) coercivity (Hc). | ||
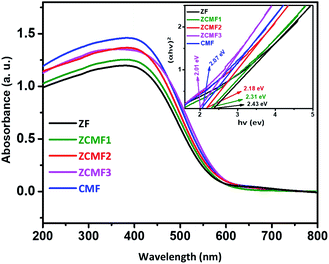
The UV-visible spectra of the as-synthesized Zn1−xCo0.5xMg0.5xFe2O4 ferrites are shown in Fig. 7. The Tauc plot (inset: Fig. 7) of (αhν)2 against the photon energy (hν) was plotted to clarify the bandgap. The spectra show the broad absorption in the UV-visible region for the Zn1−xCo0.5xMg0.5xFe2O4 ferrites, and commonly observed cubic spinel phase. The approximate ZF1, ZCMF1, ZCMF2, ZCMF3, and CMF band gaps were found to be 2.43, 2.31, 2.18, 2.01, and 2.07 eV, respectively. In addition, as the cobalt and magnesium content increased (ZCMF1 to ZCMF3), the ferrite band gap continued to decrease, supporting the substitution of the Co2+ and Mg2+ ions for Zn2+. Nevertheless, a further rise in the band gap was observed at the CMF ferrite. This may be due to the complete replacement of Zn2+ by Co2+ and Mg2+. All of the samples of the Zn1−xCo0.5xMg0.5xFe2O4 ferrites could absorb a significant amount of sunlight due to an electronic transition from Fe 3d–O 2p.41
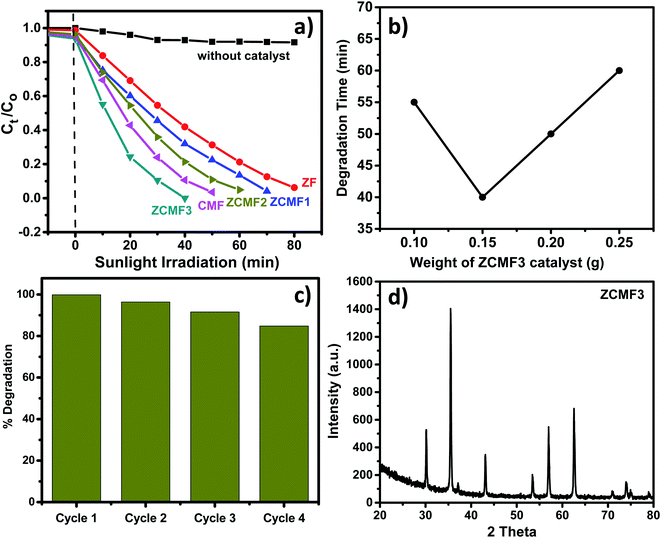
The photocatalytic efficiency of the Zn1−xCo0.5xMg0.5xFe2O4 (x = 0.00, 0.25, 0.50, 0.75, 1.0) ferrites was studied for the degradation of methylene blue dye under natural sunlight. Fig. 8a shows the degradation of the MB dye with respect to time over the Co and Mg doped Zn1−xCo0.5xMg0.5xFe2O4 ferrites. Furthermore, a controlled experiment without any catalyst was conducted for comparison. The MB dye was scarcely degraded in the absence of a catalyst, but MB dye degradation was observed in the presence of a photocatalyst. We note that the degradation rate of ZF is 93% within 80 min. By comparison, when the ZF ferrites are changed with the doping of cobalt and magnesium, the degradation levels of MB over the doped Zn1−xCo0.5xMg0.5xFe2O4 ferrites also surprisingly increase. The ZCMF3 sample shows the greatest amount of degradation under sunlight irradiation. The degradation rate of MB reaches up to a maximal 75% within 20 min, and completely disappeared after irradiation for 40 min. Moreover, the degradation rate was substantially higher than previous records.42–44 However, upon further increasing the content of Co and Mg, the degradation rate starts to reduce, which could be caused by the cation distribution, as well as increase in the bandgap of CMF. The kinetic equation of the first-order reaction is used to match the photocatalytic degradation reaction of the MB dye, in order to allow a direct quantitative comparison. The ZF, ZCMF1, ZCMF2, ZCMF3 and CMF reaction rate constants were 0.032, 0.039, 0.054, 0.108 and 0.072 min−1, respectively. The ferrite rate constant of ZCMF3 is greater than that of other ferrites. Thus, the ZCMF3 ferrite has shown strong photodegradation speed with excellent linear correlation (Table 4), indicating pseudo-first-order kinetics. The improved photodegradation activity of the as-synthesized ZCMF3 ferrites may be attributed to proper band structure, morphology, and crystallinity.
| Catalyst | k (min−1) | R2 |
|---|---|---|
| ZF | 0.032 | 0.94 |
| ZCMF1 | 0.039 | 0.94 |
| ZCMF2 | 0.054 | 0.95 |
| ZCMF3 | 0.108 | 0.99 |
| CMF | 0.072 | 0.98 |
The strong spectral response of the Zn0.25Co0.375Mg0.375Fe2O4 photocatalyst was investigated for the degradation of MB dye. Fig. 8b displays the effect of catalyst loading on the MB dye degradation. The Zn0.25Co0.375Mg0.375Fe2O4 percentage of catalyst loading by weight ranged from 0.1 g to 0.25 g. When the catalyst load is 0.15 g, the degradation of the MB dye reaches maximum (completely disappear within 45 min). Nevertheless, when increasing the content of Zn0.25Co0.375Mg0.375Fe2O4, the rate of degradation starts to decrease, which may be attributable to the shielding effect that weakens the light harvesting ability of the photocatalyst.45 In addition, given the stability and recyclability of the photocatalysts, we test the stability and reproducibility of Zn0.25Co0.375Mg0.375Fe2O4 by the cyclic degradation of the MB dye under sunlight irradiation. Fig. 8c indicates that the degradation rates of the MB dye have evidently not decreased as a result of a four-fold consecutive photocatalytic reaction, indicating that Zn0.25Co0.375Mg0.375Fe2O4 is superior in stability and reusability. In addition, as seen in Fig. 8d, the Zn0.25Co0.375Mg0.375Fe2O4 XRD was performed before and after the photocatalytic degradation reaction of the MB dye. It is worth noting that after four consecutive cycles, the Zn0.25Co0.375Mg0.375Fe2O4 XRD pattern has almost no difference, which further shows that it has outstanding reliability and reusability.
Based on the above results (Fig. 9a), we proposed the photocatalytic mechanism using Zn0.25Co0.375Mg0.375Fe2O4 under sunlight irradiation. Initially, the sunlight falls on the Zn0.25Co0.375Mg0.375Fe2O4 photocatalyst surface, activating the ferrite, and pairs of e−/h+ are formed. The electrons in the Zn0.25Co0.375Mg0.375Fe2O4 valence band become excited as the holes are left in the valence band. The holes are used for the oxidation process in the valence band, while the electrons are used for the reduction process in the conduction band. The reactive species (OH˙, O2−˙) that are produced decay the methylene blue dye in CO2 and H2O.46 In this degradation, the hydroxyl ion plays a significant role in the photodegradation of the methylene blue dye. The presence and absence of the hydroxyl radical scavenger, such as isopropyl alcohol, was monitored to investigate the development of a photodegradation reaction. The rate constant decreased significantly with the inclusion of 0.1 mL of IPA, as shown in Fig. 9b. The photodegradation of the MB dye in the presence of Zn0.25Co0.375Mg0.375Fe2O4 and sunlight is responsible for promoting the formation.
The bandgap of the ferrites Zn1−xCo0.5xMg0.5xFe2O4 lies in the visible light field (2.01–2.43 eV), which is known from optical measurements. As described in the optical properties section, the narrowing of the bandgap of ZnCMF3 was responsible for the greater activity. This makes the band structure of ZnCMF3 better for solar light optical absorption, as well as charge carrier separation. As a result, ZnCMF3 exhibits stronger MB dye degradation over other ferrites. In addition, the VSM study of the ZnCMF3 ferrites reveals that the increased cobalt ions in the octahedral sites are responsible for the high photocatalytic activity. More precisely, the MB degradation of ZnCMF3 is much higher than in previous studies (Table 5).22,42,43,47
| Sr. no. | Photocatalysts material used | Dye soln. tested | Optimized catalyst & quantity | Light source used | Remark | References |
|---|---|---|---|---|---|---|
| 1 | MnFe2O4/rGO | 10 ppm MB dye | 0.03 g | 40 W UV lamp | 97% degradation within 60 min | Mandal et al.;42 |
| 2 | CoFe2O4 | 10 ppm MB dye | 0.01 g | Visible light | 80% degradation in 140 min | Kalam et al.;43 |
| 3 | ZnO/ZnFe2O4 | 10 ppm MB dye | 0.08 g | 300 W Xe arc lamp (UV & visible light) | 98% degradation in 240 min | Yan Xu et al.;47 |
| 4 | ZnFe2O4/Fe2O3 | 10 ppm MB dye | 0.5 g | 75 W Hg lamp as UV source | 88.27% degradation in 120 min | Cao et al.;22 |
| 5 | Zn1−xCo0.5xMg0.5xFe2O4 | 10 ppm MB dye | 0.2 g | Sunlight | 99% degradation 40 min | Current work |
4. Conclusion
The present study reports the synthesis of Zn1−xCo0.5xMg0.5xFe2O4 ferrites through the sol–gel auto combustion method. The Zn1−xCo0.5xMg0.5xFe2O4 ferrites demonstrate high photocatalytic activity under sunlight irradiation for the degradation of the MB dye. Different characterization techniques characterized the prepared Zn1−xCo0.5xMg0.5xFe2O4 ferrites, which confirmed the formation of the single-phase cubic spinel structure with space group Fd3m. When compared to other ferrites, the Zn0.25Co0.375Mg0.375Fe2O4 ferrite displays excellent degradation capability for the MB dye. The Zn0.25Co0.375Mg0.375Fe2O4 ferrite could be regenerated up to four times with the photocatalytic output negligibly degrading. The present low-cost magnetic recyclable Zn0.25Co0.375Mg0.375Fe2O4 ferrite can be used to mitigate the multi-industry environmental problems.Conflicts of interest
There are no conflicts to declare.Acknowledgements
K. S. J. and K. D. P. are very thankful to TIFR for use of the instrumentation facilities, Mr Nilesh Kulkarni for the XRD facility, Mrs Bhagyashri Chalke for SEM-EDAX, Mr Ganesh Jangam for the SQUID data and SAIF IIT BOMBAY for FTIR. P. S. M. is grateful to Principal Dr B. B. Sharma for the provision of all infrastructure facilities and assistance during this work.References
- S. Agrawal, A. Parveen and A. Azam, Structural, electrical, and optomagnetic tweaking of Zn doped CoFe2-xZnxO4-δ nanoparticles, J. Magn. Magn. Mater., 2016, 414, 114–152 CrossRef.
- C. Singh, S. Jauhar, V. Kumar, J. Singh and S. Singhal, Synthesis of zinc substituted cobalt ferrites via reverse micelle technique involving in situ template formation: a study on their structural, magnetic, optical and catalytic properties, Mater. Chem. Phys., 2015, 156, 188–197 CrossRef CAS.
- U. Salazar-Kuri, J. O. Estevez, N. R. Silva-González, Y. Pal and M. E. Mendoza, Structure and magnetic properties of the Co1-xNixFe2O4-BaTiO3 core-shell nanoparticles, J. Magn. Magn. Mater., 2017, 442, 247–254 CrossRef CAS.
- C. Singh, A. Goyal and S. Singhal, Nickel-doped cobalt ferrite nanoparticles: efficient catalysts for the reduction of nitroaromatic compounds and photo-oxidative degradation of toxic dyes, Nanoscale, 2014, 6, 7959–7970 RSC.
- P. Xiong, C. Hu, Y. Fan, W. Zhang, J. Zhu and X. Wang, Ternary manganese ferrite/graphene/polyaniline nanostructure with enhanced electrochemical capacitance performance, J. Power Sources, 2014, 266, 384–392 CrossRef CAS.
- H. Yang, C. Zhang, X. Shi, H. Hu, X. Du, Y. Fang, Y. Ma, H. Wu and S. Yang, Water soluble superparamagnetic manganese ferrite nanoparticles for magnetic resonance imaging, Biomaterials, 2010, 31, 3667–3673 CrossRef CAS.
- A. Samavati and A. F. Ismail, Antibacterial properties of copper-substituted cobalt ferrite nanoparticles synthesized by co-precipitation method, Particuology, 2017, 30, 158–163 CrossRef CAS.
- W. Chen, D. Liu, W. Wu, H. Zhanga and J. Wua, Structure and magnetic properties evolution of rod-like Co0.5Ni0.25Zn0.25DyxFe2-xO4 synthesized by solvothermal method, J. Magn. Magn. Mater., 2017, 422, 49–56 CrossRef CAS.
- R. Sharma, P. Thakur, M. Kuma, N. Thakur, N. S. Negi, P. Sharma and V. Sharma, Improvement in magnetic behaviour of cobalt doped magnesium zinc nano-ferrites via coprecipitation route, J. Alloys Compd., 2016, 684, 569–581 CrossRef CAS.
- G. Theopil Anand, L. J. Kennedy, J. J. Vijaya, K. Kaviyarasan and M. Sukumar, Structural, optical and magnetic characterization of Zn1-xNixAl2O4 (0 ≤ x ≤ 0.5) spinel nanostructures synthesized by microwave combustion technique, Ceram. Int., 2015, 41, 603–615 CrossRef.
- M. Atif and M. Nadeem, Sol-gel synthesis of nanocrystalline Zn1−xNixFe2O4 ceramics and its structural, magnetic and dielectric properties, J. Sol-Gel Sci. Technol., 2014, 72, 615–626 CrossRef CAS.
- M. Ikram, M. I. Khan, A. Raza, M. Imran, A. Ul-Hamid and S. Ali, Outstanding performance of silver-decorated MoS2 nano petals used as nano catalyst for synthetic dye, Phys. E, 2020, 124, 114246 CrossRef CAS.
- A. Raza, U. Qumar, J. Hassan, M. Ikram, A. Ul-Hamid, J. Haider, M. Imran and S. Ali, A comparative study of dirac 2D materials, TMDCs and 2D insulators with regard to their structures and photocatalytic/sonophotocatalytic behavior, Appl. Nanosci., 2020, 10, 3875–3899 CrossRef CAS.
- M. Manzoor, A. Rafiq and M. Ikram, et al., Structural, optical, and magnetic study of Ni-doped TiO2 nanoparticles synthesized by sol–gel method, Int. Nano Lett., 2018, 8, 1–8 CrossRef.
- M. Khademalrasool, M. D. Talebzadeh and M. Farbod, ZnO/Silver Nanocubes Nanocomposites: Preparation, Characterization, and Scrutiny of Plasmon-Induced Photocatalysis Activity, J. Photochem. Photobiol., A, 2020, 396, 112561 CrossRef CAS.
- S. Balgude, S. Barkade and S. Mardikar, Metal Oxides for High-Performance Hydrogen Generation by Water Splitting, Multifunctional Nanostructured Metal Oxides for Energy Harvesting and Storage Devices, 2020, DOI:10.1201/9780429296871-6.
- B. Sahoo, S. Kumar Sahu, S. Nayak, D. Dhara and P. Pramanik, Fabrication of magnetic mesoporous manganese ferrite nanocomposites as efficient catalyst for degradation of dye pollutants, Catal. Sci. Technol., 2012, 2, 1367–1374 RSC.
- S. Chandrasekaran, C. Bowen, P. Zhang, Z. Li, Q. Yuan, X. Ren and L. Deng, Spinel photocatalysts for environmental remediation, hydrogen generation, CO2 reduction and photoelectrochemical water splitting, J. Mater. Chem. A, 2018, 6, 11078–11104 RSC.
- S. Kapoor, A. Goyal, S. Bansal and S. Singhal, Emergence of bismuth substituted cobalt ferrite nanostructures as versatile candidates for the enhanced oxidative degradation of hazardous organic dyes, New J. Chem., 2018, 42, 14965–14977 RSC.
- F. Chang, Z. Chen, J. Jing and J. Hou, The photocatalytic phenol degradation mechanism of Ag-modified ZnO nanorods, J. Mater. Chem. C, 2020, 8, 3000–3009 RSC.
- S. Balgude, Y. Sethi, A. Gaikwad, B. Kale, D. Amalnerkar and P. Adhyapak, Unique N doped Sn3O4 nanosheets as an efficient and stable photocatalyst for hydrogen generation under sunlight, Nanoscale, 2020, 12, 8502–8510 RSC.
- Z. Cao, J. Zhang, J. Zhou, X. Ruan, D. Chen, J. Liu, Q. Liu and G. Qian, Electroplating sludge derived zinc-ferrite catalyst for the efficient photo-Fenton degradation of dye, J. Environ. Manage., 2017, 193, 146–153 CrossRef CAS.
- Li Yang, D. Chen, S. Fan and T. Yang, Enhanced visible light assisted Fenton-like degradation of dye via metal-doped zinc ferrite nanosphere prepared from metal-rich industrial wastewater, J. Taiwan Inst. Chem. Eng., 2019, 96, 185–192 CrossRef.
- M. H. Habibi and J. Parhizkar, Cobalt ferrite nano-composite coated on glass by Doctor Blade method for photo-catalytic degradation of an azo textile dye Reactive Red 4: XRD, FESEM and DRS investigations, Spectrochim. Acta, Part A, 2015, 150, 879–885 CrossRef CAS.
- A. I. Borhan, P. Samoila, V. Hulea, A. R. Iordan and M. N. Palamaru, Effect of Al3+ substituted zinc ferrite on photocatalytic degradation of Orange I azo dye, J. Photochem. Photobiol., A, 2014, 279, 17–23 CrossRef CAS.
- N. M. Mahmoodi, Zinc ferrite nanoparticle as a magnetic catalyst: synthesis and dye degradation, Mater. Res. Bull., 2013, 48, 4255–4260 CrossRef CAS.
- S. C. W. Sakti, R. N. Laily, S. Aliyah, N. Indrasari, M. Z. Fahmi, H. V. Lee, Y. Akemotod and S. Tanaka, Re-collectable and recyclable epichlorohydrin-cross linked humic acid with spinel cobalt ferrite core for simple magnetic removal of cationic triarylmethane dyes in polluted water, J. Environ. Chem. Eng., 2020, 8, 104004 CrossRef CAS.
- A. Wahab, M. Imran and M. Ikram, et al., Dye degradation property of cobalt and manganese doped iron oxide nanoparticles, Appl. Nanosci., 2019, 9, 1823–1832 CrossRef CAS.
- H. O'neill and S. C. Hugh, Temperature dependence of the cation distribution in zinc ferrite (ZnFe2O4) from powder XRD structural refinements, Eur. J. Mineral., 1992, 4, 571–580 CrossRef.
- H. P. Klung and L. E. Alexander, Synthesis of Ni-Zn ferrite catalysts by combustion reaction using different fuels, X-ray diffraction procedures for polycrystalline and amorphous materials, Wiley, New York, NY 1997, p. 637 Search PubMed.
- T. R. Tatarchuk, M. Bououdina, N. D. Paliychuk, I. P. Yaremiy and V. V. Moklyak, Structural characterization and antistructure modeling of cobalt substituted zinc ferrites, J. Alloys Compd., 2017, 694, 777–791 CrossRef CAS.
- R. Sharma, P. Thakur, P. Sharma and V. Sharma, Ferrimagnetic Ni2+ doped Mg-Zn spinel ferrite nanoparticles for high density information storage, J. Alloys Compd., 2017, 704, 7–17 CrossRef CAS.
- A. K. M. Akther Hossaina, K. Khirul Kabira, M. Sekib, T. Kawaib and H. Tabatab, Structural, AC, and DC magnetic properties of Zn1-xCoxFe2O4, J. Phys. Chem. Solids, 2007, 68, 1933–1939 CrossRef.
- L. Weil, F. Bertaut and L. Bochirol, Magnetic properties and structure of the quadratic phase of copper ferrite, J. Phys. Radium, 1950, 11, 208–212 CrossRef CAS.
- R. Sharma and S. Singhal, Structural, magnetic and electrical properties of zinc doped nickel ferrite and their application in photo catalytic degradation of methylene blue, Phys. B, 2013, 414, 83–90 CrossRef CAS.
- M. A. Amer, A. Tawfiq, A. G. Mostafa, A. F. El-Shora and S. M. Zaki, Spectral studies of Co substituted Ni–Zn ferrites, J. Magn. Magn. Mater., 2011, 323, 1445–1452 CrossRef CAS.
- R. D. Waldron, Infrared Spectra of Ferrites, Phys. Rev., 1955, 99, 1727–1735 CrossRef CAS.
- V. Rathod, A. V. Anupama, R. Vijaya Kumar, V. M. Jali and B. Sahoo, correlated vibrations of the tetrahedral and octahedral complexes and splitting of the absorption bands in FTIR spectra of Li-Zn ferrites, Vib. Spectrosc., 2017, 92, 267–272 CrossRef CAS.
- Y. Tang, X. Wang, Q. Zhang, Y. Li and H. Wang, Solvothermal synthesis of Co1-xNixFe2O4 nanoparticles and its application in ammonia vapors detection, Prog. Nat. Sci.: Mater. Int., 2012, 22, 53–58 CrossRef.
- T. R. Tatarchuk, N. D. Paliychuk, M. Bououdina, B. Al-Najar, M. Pacia, W. Macyk and A. Shyichuk, Effect of cobalt substitution on structural, elastic, magnetic and optical properties of zinc ferrite nanoparticles, J. Alloys Compd., 2018, 731, 1256–1266 CrossRef CAS.
- K. Jangam, K. Patil, S. Balgude, S. Patange and P. More, Synthesis and characterization of magnetically separable Zn1-xCoxFeMnO4 nanoferrites as highly efficient photocatalyst for degradation of dye under solar light irradiation, J. Phys. Chem. Solids, 2020, 109700 Search PubMed.
- B. Mandal, J. Panda, P. K. Paul, R. Sarkar and B. Tudu, MnFe2O4 decorated reduced graphene oxide heterostructures: nanophotocatalyst for methylene blue dye degradation, Vaccum, 2020, 173, 109150–109158 CrossRef CAS.
- A. Kalam, A. G. Al-Sehemi, M. Assiri, G. Du, T. Ahmad, I. Ahmad and M. Pannipara, Modified Solvothermal synthesis of cobalt ferrite (CoFe2O4) magnetic nanoparticles photocatalysts for degradation of methylene blue with H2O2/visible light, Results Phys., 2018, 8, 1046–1053 CrossRef.
- F. Almeida, E. C. Grzebielucka, S. R. M. Antunes, C. P. F. Borges, A. V. C. Andrade and E. C. F. Souza, Visible light activated magnetic photocatalysts for water treatment, J. Environ. Manage., 2020, 273, 111143–111152 CrossRef CAS.
- K. N. Harish, H. S. B. Naik, P. N. P. Kumar and R. Viswanath, Optical and Photocatalytic Properties of Solar Light Active Nd-Substituted Ni Ferrite Catalysts: For Environmental Protection, ACS Sustainable Chem. Eng., 2013, 1(9), 1143–1153 CrossRef CAS.
- S. Balgude, Y. Sethi, B. Kale, D. Amalnerkar and P. Adhyapak, ZnO decorated Sn3O4 nanosheets nano-heterostructure: stable photocatalyst for water splitting and dye degradation under natural sunlight, RSC Adv., 2019, 9, 10289–10296 RSC.
- Y. Xu, S. Wu, X. Li, Y. Huang, Z. Wang, Y. Han, J. Wu, H. Meng and X. Zhang, Synthesis, characterization and their photocatalytic degradation properties of ZnO/ZnFe2O4 magnetic heterostructures, New J. Chem., 2017, 41, 15433–15438 RSC.
| This journal is © The Royal Society of Chemistry 2020 |

