 Open Access Article
Microstructural study of epoxy-based thermosets prepared by “classical” and cationic frontal polymerization†
Helena Švajdlenková *ad,
Angela Kleinová
 a,
Ondrej Šauša
 b,
Jaroslav Rusnák
 c,
Tran Anh Dung
 d,
Thomas Koche and
Patrick Knaack*d
aDepartment of Synthesis and Characterization of Polymers, Polymer Institute of SAS, Dúbravská cesta 9, Bratislava 845 41, Slovakia. E-mail: helena.svajdlenkova@savba.sk
bDepartment of Nuclear Physics, Institute of Physics of SAS, Dúbravská cesta 9, Bratislava 845 11, Slovakia
cDepartment of Metal Physics, Institute of Physics of SAS, Dúbravská cesta 9, Bratislava 845 11, Slovakia
dInstitute of Applied Synthetic Chemistry, TU Wien, Getreidemarkt 9/163 MC, 1060 Vienna, Austria. E-mail: patrick.knaack@tuwien.ac.at
eInstitute of Materials Science and Technology, TU Wien, Getreidemarkt 9/308, 1060 Vienna, Austria
First published on 11th November 2020
Abstract
A microstructural study of bisphenol-A diglycidyl ether (BADGE), prepared via both “classical” and novel photo- and thermally-induced cationic frontal polymerization, can help to understand the relationships between the microstructure of epoxides and their material properties, as well as the propagation of frontal polymerization waves. Microstructural PALS characteristics, such as the ortho-positronium lifetime (τo-Ps), lifetime distribution, and void fraction, were investigated in relation to the extension of H bonds obtained from ATR/FTIR and the bulk density. The thermal profiles of differently-induced RICFP revealed that photo-triggered propagation is twice as fast as thermally-induced RICFP, with a comparable maximal reaction temperature (∼283 °C) and heat conductivity. Both RICFP-based samples, induced by UV light and heat, showed a lower τo-Ps, narrower lifetime distributions, and a reduced void fraction, in comparison to the “classical” cured anhydride-based epoxy sample. These may be the main factors which result in better material properties. In addition, both their radial and angular profiles of free volume fraction confirmed experimentally the rotational movement of the propagating frontal waves and their influence on the microstructural inhomogeneities, and the final material properties.
Introduction
Bisphenol-A diglycidyl ether (BADGE) is an epoxy resin widely used in many applications such as protective coatings, adhesives, construction, etc. They have excellent mechanical, chemical, and heat resistance, with low moisture absorption. The challenge is to understand the relationship between the chemical composition and the microstructure and their impact on the final material properties. The “classical” thermal curing of BADGE with curing agents, e.g. amines, anhydrides, or phenolic compounds, requires a higher temperature and a long curing time. The reaction mechanism of catalysed epoxy-anhydride resins is very complex and it is not clear due to competing reactions. In the initial step, anhydride rings are opened by the catalyst and form an internal salt. Next, the carboxyl anion reacts with an epoxy group and the alkoxide anion generated reacts with an anhydride. These alternating anionic copolymerization steps form a polyester.1,2 M. Capelot et al. found that, in the initial step, the anhydride rings can also be opened by hydroxyl groups formed from the reaction of epoxy groups with the water molecules which are present in the metal catalyst. This leads to the formation of a monoester and a carboxylic acid and the latter opens the epoxy ring and forms a diester and hydroxyl group.3 Thermal curing is an energy and time-consuming process, which induces residual stresses in the material. Thermal curing is overcome by photo curing due to its lower energy consumption, high cure speed, and lack of oxygen inhibition. This technology is suitable only for thin films. Currently, the curing of epoxy resins by frontal polymerization is a very promising technique for the preparation of thick systems that require a minimum of energy and time and is, therefore, a low cost process. Photo or thermal frontal polymerization triggered by external UV light or heat is based on self-propagating fronts driven by the exothermic reaction.4 Mariani et al. explained the mechanism of a combined radical-induced cationic polymerization with frontal polymerization, in which photo and thermal initiators are used.5Radical-induced cationic frontal polymerization (RICFP) overcomes the limitations of “classical” thermally- and photo-cured epoxy resins such as the penetration depth of UV light, and it is possible to use this technique for both bulk materials and for the thin layers.6–8
Recently, the “classical” thermally- and photo-cured BADGE-based resins, mixed with methylhexahydrophthalic anhydride hardener (MHHPA, Aradur HY 1102, Huntsman) or a photoacid generator iodonium hexafluoroantimonate salt (IOC-8 SbF6, PAG I-Sb), were compared in relation to a cationic frontal cured resin by RICFP, in the presence of both photo and tetraphenylethanediol thermal initiators (PAG/TPED).7 The BADGE cured by RICFP showed a higher Tg (168 ± 2 °C) compared to the “classical” photo- and thermally-cured epoxy resins, 163 ± 2 °C and 154 ± 4 °C, respectively.7 In addition, tensile and impact tests revealed that the sample prepared by the cationic frontal polymerization (CFP) exhibits higher Young's modulus, tensile strength, and greater elongation at break and impact resistance, than the anhydride based formulation.7
Knaack et al.8 showed a new reaction system for RICFP consisting of 1 mol% of TPED and a more reactive photo-initiator, bis(4-tert-butylphenyl)iodonium tetrakis(perfluoro-tert-butyloxy)aluminate9 (PAG I-Al). It works even at lower concentrations than PAG I-Sb.8
This new PAG I-Al significantly reduces the amount of photo initiator in the reaction system with 1 mol% of TPED. IR spectra of PAG I-Al/TPED-based formulations exhibit the conversion of epoxy group of more than 98%. Moreover, I–Al-based epoxy samples prepared by photo RICFP exhibit higher Tg about 5–10 °C, than an anhydride-cured epoxy sample.8
The PALS (Positron Annihilation Lifetime Spectroscopy) technique is a suitable tool for the investigation of free volume at sub-nanometre sizes and the determination of free volume size distributions,10 as well as other derived quantities, e.g. the free volume fraction11 and the morphology of free volume holes.12 PALS is also used at the investigation of epoxides.
The solidification of epoxy resins and the influence of the composition of bisphenol-A-based epoxy resin/anhydride hardener, and the heating treatment of epoxy resins on o-Ps formation were investigated.13 The combined study of the thermal curing of BADGE with diaminodiphenyl sulfone (DDS) hardener via ss-NMR, DSC, DMTA and PALS revealed a formation of clusters with different degrees of crosslinking, where PALS results showed that dynamic post-curing processes may increase the free volume size in cured epoxy resin.14
Other structural factors, e.g. network rigidity and the crosslinking density of amino BADGE epoxy samples in relation to their microstructural changes and material properties, were studied.15,16 Suzuki et al. focused on thermal curing of epoxies (bisphenol-A epoxy resin) with anhydrides and the thermal curing of cyanate resins (bisphenol-A dicyanate, BADCY) by PALS.17–19 They found that, after polymerization, a reduced lifetime and broadening of the lifetime distribution appears. This is due to the formation of a 3D network. The relationship between the chemical and physical properties of a series of bisphenol-A diglycidyl ether epoxy samples, prepared by curing with polyetherdiamine of different chain lengths, were reported,20 and the effects of cross-link density on the free volume was revealed. However, no work has yet studied the microstructure of epoxy resins prepared by advanced RICFP via PALS technique.
In this paper, we present the chemical composition, bulk density and free volume characteristics of epoxy resins cured in four different ways: “classical” thermally- and “classical” photo-cured, and novel cured epoxy resins by photo or thermal RICFP. The chemical composition was obtained from attenuated total reflectance/Fourier-transform infrared spectroscopy (ATR/FTIR) and the free volume characteristics from PALS. In the case of the RICFP process induced by UV light and a soldering iron, we studied kinetic parameters, i.e. the front velocity and maximal temperature. We also examined the microstructural changes in the radial and angular profiles, which support the finding that the frontal reaction forms non-planar spin modes that propagate spirally with the helical path.21,22
Experimental section
Materials and methods
Bisphenol-A diglycidyl ether (BADGE-MY-790-1) was a gift. Also used were 1,1,2,2-tetraphenyl-1,2-ethanediol (TPED, Fluka), as a thermal initiator; the hardener methylhexahydrophthalic anhydride (MHHPA, Aradur HY 1102, Huntsman); zinc neodecanoate (abcr), as a catalyst; and the photo-initiator bis(4-tert-butylphenyl)iodonium tetrakis(perfluoro-tert-butyloxy)aluminate (PAG I-Al).9Preparation of cured samples
A “classically” photo-cured epoxy sample, BADGE with 0.1 mol% of PAG, was placed in a round silicone mould (diameter ∼ 15 mm, thickness ∼ 3 mm) (Fig. S1, in ESI†). Four samples were cured for 150 seconds – first, the shiny side and then the matte, in an INTELLI-RAY 600 light oven. After removing unreacted monomers from the surfaces, they were again cured for 150 seconds on both sides. The wavelength was in the range of 300–580 nm, with a flux density of ∼20 mW cm−2.The “classically” thermally-cured sample, and the epoxy resins cured by photo- and thermally-induced RICFP, were prepared in a cylindrical mould (diameter ∼ 15 mm, length ∼ 40 mm) (Fig. S3, ESI†). The thermally-cured epoxy sample, consisting of an equimolar mixture of BADGE and hardener with 3 wt% of a Zn-based catalyst, was cured at 160 °C in the oven for 10 hours (S2, ESI†). The epoxy samples cured by RICFP contained 1 mol% of TPED, 0.1 mol% of PAG. The frontal reaction was initiated via UV light or heat, locally, in the middle, from the bottom of the cylinder, by soldering iron or along the whole surface of the mixture by a heating plate.
The reaction systems were triggered by UV light of wavelength 365 nm, and the flux density of the light, 219 mW cm−2, was determined at the bottom, in the middle of the mould, passing through a fixed 1 mm glass (Fig. S3, ESI†). The flux density was measured by an Ophir Photonics StarLite meter with a PD300-UV probe. The flux density profile of the UV light was also measured (Fig. S5, ESI†).
The soldering iron was heated to a temperature of 394 °C, and the heated plate to 190 °C. After the reaction started, the UV light and the heaters were removed.
All of the cured samples in the cylindrical mould were cut into 3 mm thick discs (Fig. S2 and S4 in ESI†).
Attenuated total reflection (ATR/FTIR)
The differences in the chemical composition of “classically” and RICFP prepared epoxy resins were examined by Nicolet 8700™ spectrometer, (Thermo Scientific, Madison, Wisconsin, USA) – sampling technique: ATR/FTIR. The reference uncured BADGE was measured as a liquid film. In the ATR/FTIR measurements, the individual discs of cured samples were measured in the middle IR range (4000–650 cm−1) with a Ge crystal used as an optical material. The estimated penetration depth of the infrared beam, at 1000 cm−1, was 0.66 μm (Thermo Scientific Application Note AN01153).Density measurement
The bulk density of “classically” thermally- and photo-cured epoxy samples, and of the epoxy resins cured by photo- or thermally-induced RICFP, was determined by the gravimetric method. The individual discs were weighed dry (m0) and immersed in ethanol (m1). Their bulk density was calculated based on the equation:
 | (1) |
Temperature profile
The photo and thermally-induced RICFP reactions were investigated in more detail, to obtain the thermal profile of the front reactions, the maximal temperature, and the frontal velocity, using 6 or 7 thermocouples (TC) fixed at 7.5 mm, 4 mm and 2 mm from the inner surface of the cylinder mould (see Fig. S6 in ESI†). In the case of CFP triggered by the heating plate, TCs were fixed on the inner wall of the cylinder.The reactions were triggered, from the bottom of the mould, by UV light, the soldering iron and the heating plate.
The measurements were made at RT (27 °C), and repeated at least 3 times.
The temperature profile measurements were made using a combination of a measuring system developed at the Institute of Physics, SAS, which consist of five TCs and several separate multimeters with time synchronization. The 5-TCs measurement system had T-type thermocouples (0.1 mm diameter, Omega Engineering, Inc.), an electronic cold junction compensation circuit, a DAQ (data acquisition) NI-USB 6008, and software for synchronized data acquisition. This arrangement was extended with K-type thermocouples with ProsKit MT-1860 multimeters as needed. The data were recorded every 0.5 s.
PALS
The PALS technique gives information about the free volume microstructure of polymers by measuring the lifetime of positron or positronium, Ps, the bound state of the electron and positron which is formed in most polymers after thermalization of the positrons during enter into the substance. The lifetime of the triplet state of Ps (ortho-Ps) provides important information about the local free volume sizes, which depend on external conditions (temperature, pressure). The PALS spectrum for polymers usually contains three lifetime components that are associated with annihilation in different states, i.e. the annihilation of para-positronium (p-Ps, the shortest component), free positron (e+), and ortho-positronium (o-Ps), which has the longest lifetime. O-Ps nearly always annihilates in matter via so-called pick-off annihilation, wherein the positron from o-Ps is annihilated with the electron of the void surface, where o-Ps is localized. This process substantially shortens the lifetime of the o-Ps from the vacuum value (142 ns) to the typical values of 1–3 ns for polymers. The relationship between the pick-off lifetime of o-Ps (τo-Ps) and the pore size is described by different models, of which the most common is the Tao–Eldrup model.23 This model assumes spherical voids, and this approximation is usually accepted for polymers.The lifetime measurements were carried out by a conventional fast–fast coincidence spectrometer with a time resolution of 320 ps at w1/2h (full width at half height of the resolution curve). An instrumental resolution was determined from the annihilation spectra of an Al defect-free sample, with a single lifetime of 166 ps. In PALS experiments, the discs of cylinders were measured individually in air at 23 °C. The sandwich geometry consisted of the polymer disc, the reference aluminium (Al) disc with known lifetime and the radioactive source with activity of 1 MBq located between the discs.
The obtained PALS data were analysed by the LT polymer program.24
The standard quantum mechanical model proposed by Tao and Eldrup gives the relation lifetime τo-Ps to the radius of the voids, rh, in the equation:23
 | (2) |
 | (3) |
Results and discussion
ATR/FTIR data
Epoxy samples prepared by “classical” curing or RICFP were measured both in the middle and 2 mm from the edge of the discs.In these two locations, the chemical composition, mainly C![[double bond, length as m-dash]](https://www.rsc.org/images/entities/char_e001.gif) O, C–O–C, and OH groups influenced by H bonding, was investigated.
O, C–O–C, and OH groups influenced by H bonding, was investigated.
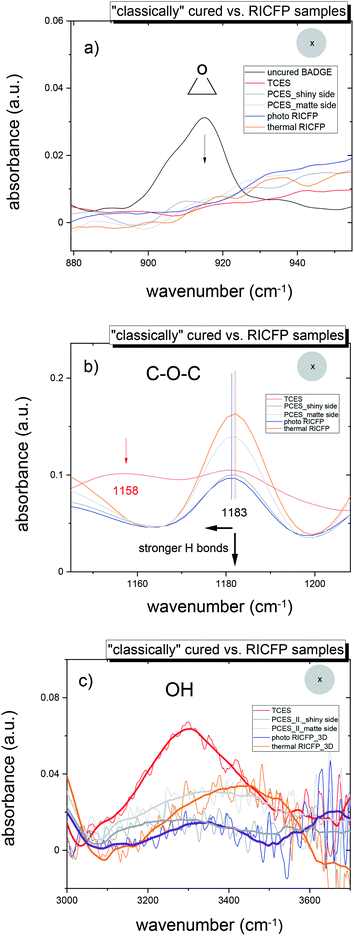
The conversion of monomers, reflected in the disappearance of the oxirane group, i.e. C–O group (915 cm−1) and C–H group (3050 cm−1), showed an almost 100% conversion of monomers (Fig. 1a). More detailed plots of the conversion of epoxy groups during RICFP revealed a higher conversion of monomers along the cured samples for photo-induced RICFP than thermally-induced reaction (ESI, Fig. S10 and S11†).
In the case of the anhydride-based epoxy resin (TCES), in Fig. 1b, the broad split peak of ether linkage (C–O–C) of BADGE (1182 cm−1) reveals the right wing of the C–O group of the ester groups (R–CO–O–R′) at 1158 cm−1,25 which is in agreement with the appearance of a very intensive band of carbonyl ester groups (R–CO–O–R′) at 1735 cm−1 (Fig. S8a and b in ESI†). In addition, the very broad peak at 3200–3500 cm−1 in Fig. 2c implies the formation of a complex between OH groups and carbonyl groups O![[double bond, length as m-dash]](https://www.rsc.org/images/entities/char_e001.gif) C (R–O–H⋯C
C (R–O–H⋯C![[double bond, length as m-dash]](https://www.rsc.org/images/entities/char_e001.gif) O).26
O).26
In Fig. S8c and d† (FTIR-SI), it was found that the decrease of the C![[double bond, length as m-dash]](https://www.rsc.org/images/entities/char_e001.gif) O ester stretching band and the decrease of the OH band, as well as the shift to a lower wavenumber imply the formation of a complex (stronger interactions) between the OH groups and the carbonyl groups O–H⋯O
O ester stretching band and the decrease of the OH band, as well as the shift to a lower wavenumber imply the formation of a complex (stronger interactions) between the OH groups and the carbonyl groups O–H⋯O![[double bond, length as m-dash]](https://www.rsc.org/images/entities/char_e001.gif) C.
C.
On the other hand, “classically” photo-cured epoxy samples (PCES), and the samples prepared by photo- and thermally-induced RICFP, exhibited an absorption of flexible ether (C–O–C) groups at 1183 cm−1 and an OH absorption peak at 3200–3600 cm−1, and the both are influenced by H bonds (Fig. 1b and c). The increase in H bond interactions causes a decrease in the C–O–C band and in the OH band, which broadens and shifts to a lower wavenumber.27,28
In addition, the amplitude of the C–O–C band, and the breadth and position of the OH bands of all discs for “classically” photo-cured (PCES) and RICFP samples (photo and thermal RICFP) revealed that the thermal RICFP (Fig. S11, in ESI†) sample exhibited a more intense C–O–C band, and a narrower OH band, which is located at a higher wavenumber compared to PCES and photo RICFP (see Fig S9 and S10 in ESI†). This implies weaker H bond interactions in the network structure.
Bulk density
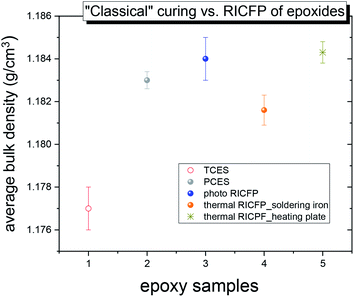
The bulk density (1/ρ – specific volume) reflects differences in the structural arrangement, whether it is tight or loose, and the size of local free volumes.In Fig. 2, the average bulk density (ρ) of five differently cured epoxy samples shows that the “classically” thermally-cured epoxide (TCES) had a lower ρ than both the epoxides prepared by “classical” photo curing (PCES) and RICFP triggered by UV light or heat. This finding is in agreement with the observation that, TCES sample has lower Tg compared to photo RICFP formulation.8
In the case of the RICFP-based samples, the photo-induced CFP exhibited a higher average bulk density compared to both the PCES sample and the thermal CFP triggered by soldering iron. This correlates to the conversion of monomers (ESI, Fig. S10 and S11†). However, the RICFP-based samples induced by heating plate showed the highest average bulk density.
Temperature profile, frontal velocity, maximum temperature
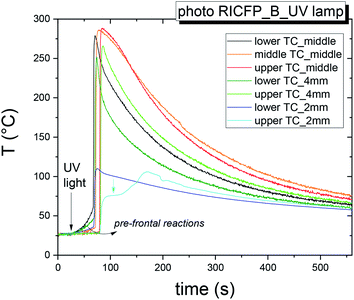 | ||
| Fig. 3 Time dependence of temperature of self-propagating thermal reaction waves of the sample BADGE/PAG + TPED induced by UV lamp measured in mould B. | ||
The velocity was determined as the ratio of the distance of two TCs (9 mm or 18 mm) to the time difference of the peak maxima (vmax), as well as at the inflexion point (vip) (Table 1) for three data sets, measured in mould A and B (ESI, Fig. S6†). The rate (vmax) of photo-induced RICFP in the middle of the cylinder, determined at 1–2 TCs and 2–3 TCs, increased from 1.26 mm s−1 to 1.35 mm s−1 and its determined value between 1–3 TCs was 1.2 ± 0.1 mm s−1.
| Reaction zone | vip (mm s−1) | vmax (mm s−1) | Tmax (°C) |
|---|---|---|---|
| Middle (1–2 TC, 2–3 TC, 1–3 TC) | 1.96, 1.17, 1.50 ± 0.03 | 1.26, 1.35, 1.2 ± 0.1 | 283 ± 4 |
| 4 mm (1–2 TC) | 1.60 ± 0.05 | 1.5 ± 0.03 | 243 ± 5 |
| 2 mm (1–2 TC) | 1.65 ± 0.07 | 1.06 ± 0.1 | 157 ± 10 |
vmax increased to 1.5 ± 0.03 mm s−1 at 4 mm from the mould surface and reduced to 1.06 mm s−1 at 2 mm. On the other hand, the velocity determined at the inflexion point (vip) showed a decrease from 1.96 to 1.17 mm s−1. However, it is necessary to take into account that the standard approach for the determination of the frontal speed from the peak maxima, is influenced by heat losses, which cause the shift of peak to the shorter times.
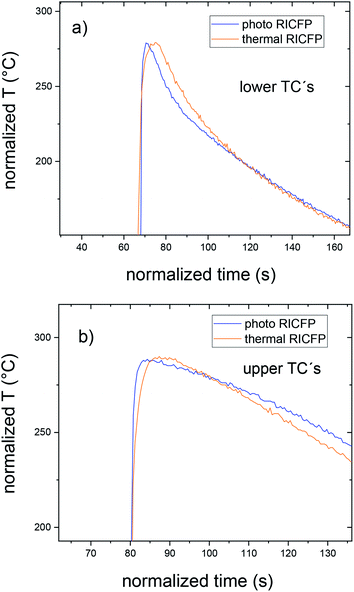
In the case of thermally-induced RICFP by soldering iron (Fig. 4), the temperature response is without pre-frontal reactions and the velocity (propagation reaction) is almost twice as slow compared to photo RICFP with the same features (Table 2). In Fig. 5, the normalized temperature profiles of thermally-induced RICFP to photo RICFP profiles, for lower and upper TCs in the middle of the mould, confirmed similar heat conductivity along the frontal reaction.
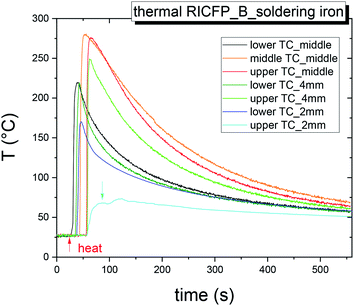 | ||
| Fig. 4 Time dependence of temperature of self-propagating thermal reaction waves of the sample BADGE/PAG + TPED triggered by the soldering iron measured in mould B. | ||
| Reaction zone | vip (mm s−1) | vmax (mm s−1) | Tmax (°C) |
|---|---|---|---|
| Middle (1–2 TC, 2–3 TC, 1–3 TC) | 0.678, 0.705, 0.71 ± 0.01 | 0.678, 0.801, 0.77 ± 0.03 | 281 ± 1 |
| 4 mm (1–2 TC) | 0.86 ± 0.2 | 0.93 ± 0.03 | 251 ± 1 |
| 2 mm (1–2 TC) | 1.015 ± 0.03 | 0.57 ± 0.1 | 165 ± 5 |
However, the CFP induced by the heating plate is accompanied by initial heating of the sample and of the mould to a temperature of approx. 90 °C, until the start of the front.
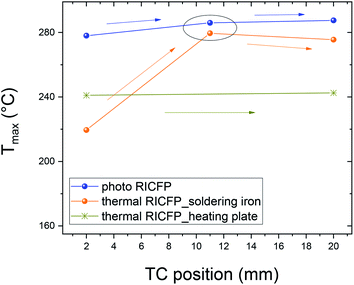
The two similar temperature maxima are present due to the heat released from the two independent thermal waves, from frontal reactions along the mould axis. The temperature profiles showed the Tmax = 242 °C (Fig. 6 and Table 3). The velocity of the main thermal waves determined from the first maxima of double peaks is comparable to the spreading of the thermal frontal waves induced by soldering iron. In addition, the evolution of the temperature maxima (Tmax) in the radial dependence (7.5 mm, 4 mm, 2 mm), and in the middle of the reaction front, had an obvious shift, from the data obtained for the RICFP samples triggered by UV light or soldering iron (Fig. 7 and 8).
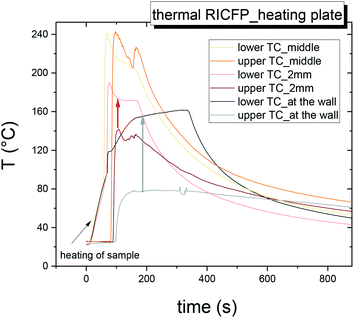 | ||
| Fig. 6 Time dependence of temperature of self-propagating thermal reaction waves of the sample BADGE/PAG + TPED triggered by heating plate measured in mould A. | ||
| Reaction zone | vip (mm s−1) | vmax (mm s−1) | Tmax (°C) |
|---|---|---|---|
| Middle | 0.77 | 0.617 | 242.5 |
| 2 mm | 0.815 ± 0.035 | 0.603 | 142.6 |
| At the wall | 0.65 | 0.219 | 78.4 |
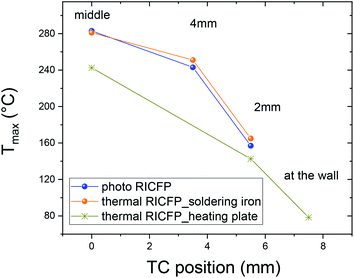 | ||
| Fig. 7 Temperature maximum of the TCs in the middle, at 4 mm, at 2 mm and at the wall of the mould, in the case of thermally-induced RICFP by heating plate. | ||
The profile of velocity suggests a nonlinear propagation of the frontal polymerization, probably with layered and helical pattern. This was also revealed in the mathematic modeling of frontal polymerization on acrylates.22
In the case of the time derivative of the temperature profile for photo and thermal RICFP (Fig. S7†), the extent of the separation, or the overlap, of the temperature profiles, which indicate the existence of thermal waves. Here, CFP triggered by the heating plate has an obvious separation and broad 1st peak at the beginning of the front, which suggests a less homogeneously self-propagating frontal polymerization.
PALS
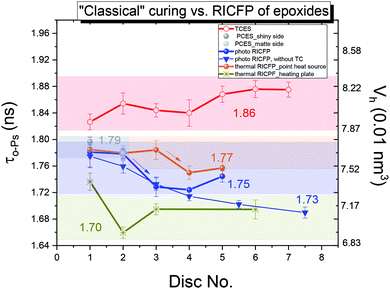
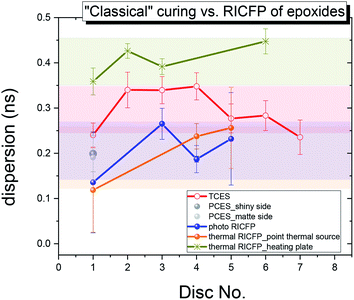
The o-Ps lifetime distribution was also evaluated on a series of differently-cured epoxy samples. In Fig. 10, the o-Ps dispersions of a series of epoxy samples determined by LT program,21 and, directly affected by the width of distribution of void sizes, reflects the homogeneity of void size distribution in the microstructure. The relationship between the o-Ps dispersion and the heterogeneity of the microstructure in thermosets was found by Rey et al.29 The samples cured “classically” by UV light, or by RICFP, or triggered by UV light or the soldering iron, have a narrower distribution (∼0.20 ns) than both the “classically” thermally-cured anhydride based sample (0.295 ns) and the thermal RICFP induced by heating plate (0.41 ns). In addition, the determined free volume fraction parameter τo-Ps × Io-Ps is proportional to the free volume fraction (fV = C × Vh × Io-Ps, C is a material constant).30,31
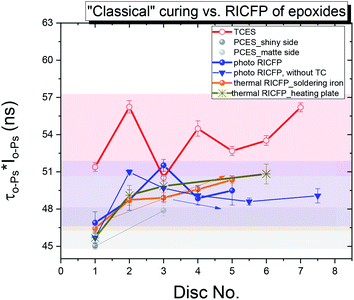
In a series of differently-cured epoxy samples (Fig. 11), TCES exhibits an increased amount of free volume fraction in the microstructure compared to PCES, and both photo and thermal RICFP. The RICFP-based samples exhibited quasi saturation of the free volume fraction from 3rd disc.
The free volume is influenced by the crosslinking density, the packed network structure given by the flexible ether groups (C–O–C), and the H-bonding strength of hydroxyl groups (OH). It was also found that both rigidity and packing frustration increased the free volume.15
The reduced average o-Ps lifetime for “classical” photo and cationic-cured samples induced by UV light is in relation to the reduced amplitude of C–O–C absorption and the broad OH band lying at a lower wavenumber compared to the thermally-induced RICFP by soldering iron (see ESI, Fig. S10a and S11a†). This implies the formation of stronger H bonds in the network structure. In addition, the relationship between a reduced o-Ps lifetime and stronger H bonds is in agreement with the determined bulk density (Fig. 2) and higher conversion of monomers (ESI, Fig. S10†).
In the case of the “classically” cured TCES sample, complex agglomerates with relatively strong H bonds between R–O–H⋯C![[double bond, length as m-dash]](https://www.rsc.org/images/entities/char_e001.gif) O can lead to the formation of a larger free volume with less homogeneous void size and an increased void fraction that causes decreased bulk density (Fig. 2) and a lower Tg, as published by Bomze et al.7
O can lead to the formation of a larger free volume with less homogeneous void size and an increased void fraction that causes decreased bulk density (Fig. 2) and a lower Tg, as published by Bomze et al.7
Moreover, the more homogeneous microstructure in the photo RICFP than in the anhydride-based sample (TCES) is in relation to the improved material properties, i.e. increased Young's modulus, tensile strength, elongation at break and impact resistance, as published by Bomze.7
In the series of investigated samples, “classically” cured disc vs. 2nd disc of cut cylindrical samples were compared in the radial dependence, i.e. from the middle (0 mm) to the edge of the disc (6 mm), with 2 mm increments.
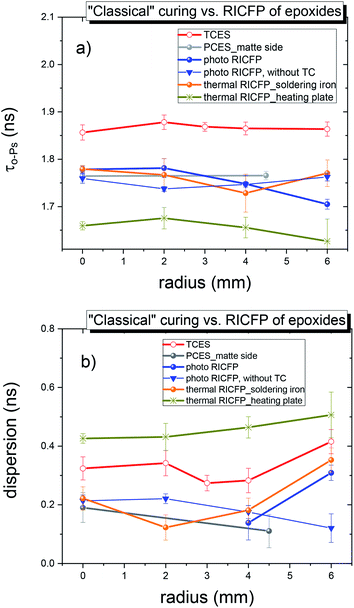
The radial dependence of the o-Ps lifetime (Fig. 12) did not show any significant changes.
In addition, the increased o-Ps lifetime dispersion from the core to the edge of the disc, for all samples, implies a higher heterogeneity towards the wall of the sample surface.
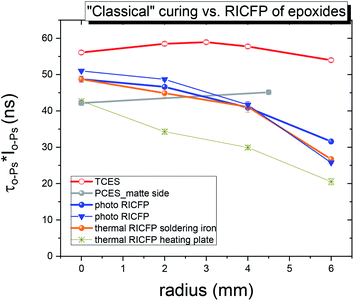
The most obvious differences between “classically” cured and RICFP-based samples were observed, namely the more pronounced decrease in intensity (Io-Ps, not shown) and the free volume fraction parameter (τo-Ps × Io-Ps) (Fig. 13) for the RICFP-based sample than for “classically” cured samples. This decrease in the void fraction parameter suggests the highest amount of free volume is formed in the core of discs with a decrease to the edge of disc (Fig. 13).
In the case of samples prepared by photo and thermal RICFP, the trend in the radial evolution of the free volume fraction is in relation to the evolution of the maximal temperatures (Tmax) measured at different positions of the TCs (7.5 mm, 4 mm and 2 mm from the edge of sample), Fig. 7.
Moreover, the photo-induced RICFP-based sample has a higher free volume fraction than thermally-induced RICFP and its decreasing trend towards the Teflon mould correlates with the higher conversion in the core than at the edge of the discs (in ESI, Fig. S10 and S11†).
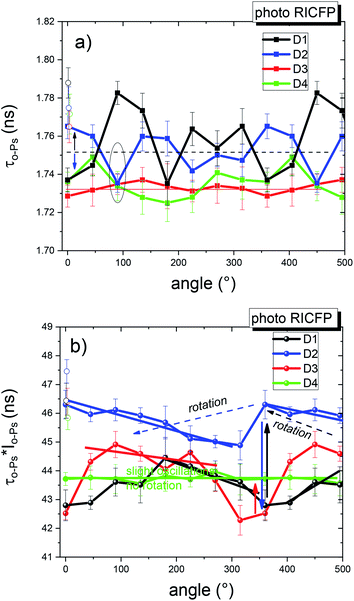
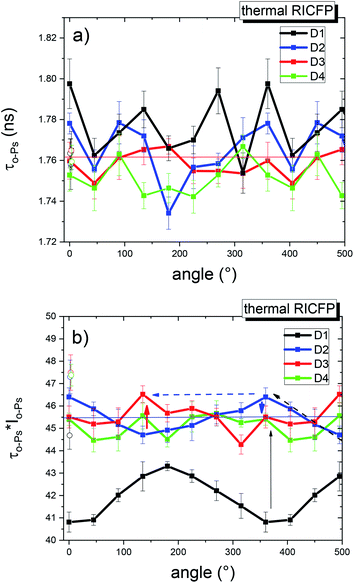
Angular PALS measurements of the samples cured by RICFP and induced by UV light or soldering iron showed that the frontal polymerization propagated unevenly in the sample, and this affected the microstructural parameters, i.e. the average o-Ps lifetime and the free volume fraction. A mutual comparison of the adjacent discs, for both samples, showed irregular oscillations and indications of rotation (Fig. 14a and b). In this figure, the spatial scale of 360° has been extended by several replicated points in order to better illustrate the changes in the observed quantities, in an angular scale of nearly 360°.
In the case of photo-induced RICFP, the angular profile of the average o-Ps lifetime for discs (D1, D2) exhibited pronounced oscillations in the beginning of the frontal reaction but the values of τo-Ps were more uniform and lower in the discs (D3, D4) (Fig. 14a).
The local free volume fraction represented by τo-ps × Io-Ps was obviously larger for the 2nd disc (D2). The following discs had only a slightly oscillating void fraction parameter, with an indication that the local maxima rotated counter clock-wise, in the direction of the frontal propagation (Fig. 14b). In addition, all the discs exhibited an increased free volume fraction in the core of the disc.
In the case of the thermally-induced RICFP by point heat source (Fig. 15), the average o-Ps lifetimes showed that the free volume at different angles for D1 and D2 exhibited a greater scatter of points compared to D3. However, the free volume fractions revealed more pronounced differences between D1 and the other discs. The significant angular dependence of the free volume fraction of the 1st disc (D1) had a lower average value of fraction compared to the 2nd and 3rd discs (D2, D3), which had a comparably higher void fraction. As can be seen, the rotation from the 1st to 4th disc gradually weakened and the core of the discs exhibited an increased void fraction for the RICFP-based sample induced by UV light.
For comparison, the angular dependence of “classically” thermally-cured anhydride epoxy resin (TCES) did not manifest rotational propagation (see ESI, Fig. S15 and S16†).
The main differences between the angular dependences of samples cured by photo and thermally-induced RICFP are in the free volume fraction. In the former, the values for discs D3 and D4 fell to the level of disc D1, and in the latter, the free volume fraction of disc D1 was very low and disc D3 remained at the level of the next two discs. For both RICFP samples, the angular dependences of the free volume fraction confirmed a rotationally propagating frontal reaction with consequences for the microstructure and its heterogeneity.
The presence of a “crater”-like structure at the end of the cured sample, with a certain surface pattern (see Fig. 16) supports the PALS findings from the radial and angular measurements of photo RICFP B (Fig. 17).
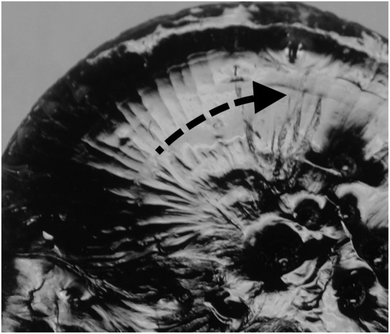 | ||
| Fig. 16 Sample prepared by photo RICFP. Visible regular pattern at the end of the cylindrical sample. The edge lifts slightly in the direction of rotation. | ||
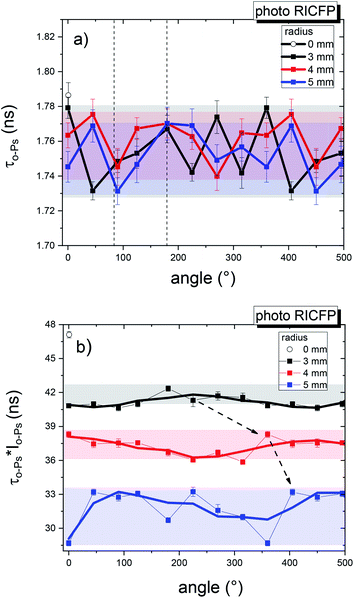 | ||
| Fig. 17 2D angular dependence of (a) the average o-Ps lifetime and (b) τo-Ps × Io-Ps for four different radii of the “crater”-shaped end of the photo-induced RICFP sample. | ||
Relatively uniform average o-Ps lifetimes (or cavity sizes) were measured for the selected radii. The angular dependence was insignificant (Fig. 17a).
However, the local fraction of free volume (Fig. 17b) shows a significant angular dependence. About 3 mm from the core, the angular dependence is weak, but a higher angular inhomogeneity of τo-Ps × Io-Ps, at an angle of 0°–45°, is observed near the edge of the disc. This figure shows the location of the maxima of τo-Ps × Io-Ps for different radii close to the upper disk surface, which may be a consequence of the rotational movement of the front.
In addition, the dependence in Fig. 17b confirms the general trend of the free volume fraction reduction in all RICFP samples towards the mould surface, a phenomenon which was also shown in the study of radial dependencies (Fig. 13).
It can be stated that the end of the sample volume, terminated by a “crater”-like formation, is a consequence of the rotational movement of the reacting mass, which pushes the colder and slower reaction mixture towards the edge of the sample (see Fig. 16). In the RICFP process, in the core of the sample, the hot front forms a higher fraction associated with a higher number of cavities compared to the edge of the sample.
Conclusion
In the present work, “classically” thermally and photo-cured samples and samples prepared by novel RICFP, induced by UV light and two different heat sources, i.e. soldering iron and heating plate, were investigated by ATR/FTIR and PALS technique.The combined study explored the relationships between the strength of H bonding (ATR/FTIR), bulk density, and the free volume characteristics obtained from the o-Ps lifetime, its dispersion, and the free volume fraction parameter (PALS). In addition, the thermal profiles of two differently-triggered RICFP showed that photo RICFP induced by UV light propagates twice as fast as thermal RICFP induced by soldering iron at a comparable maximal reaction temperature of around 283 °C, and with heat conductivity in the middle of the cylinder, along the frontal reaction. However, thermal RICFP induced by heating plate exhibited two individual propagation fronts that can cause inhomogeneities in the network structure.
PALS data showed that “classically” thermally-cured sample had an increased average o-Ps lifetime and a broader dispersion of τo-Ps than the “classically” photo-cured sample. On the other hand, in the series of samples prepared by RICFP, the CFP triggered by heating plate had the most reduced τo-Ps and a very broad τo-Ps dispersion, implying a high microstructural heterogeneity due to the presence of two individual fronts.
A mutual comparison of the PALS and ATR/FTIR results of the RICFP-based sample induced by UV light showed a lower τo-Ps than the thermal RICFP-based sample triggered by soldering iron, which is in agreement with the higher strength of H bonding demonstrated by the reduction in C–O–C band intensity, and the broadening of the OH band with a shift to a lower wavenumber. In addition, the samples prepared by RICFP exhibit a reduced free volume fraction in comparison to the “classically” anhydride-cured epoxy sample, which could be one of the key factors responsible for improved material properties (toughness).
The PALS results for the samples prepared by RICFP showed a high local fraction of free volume in the core. This is associated with a high value of Io-Ps, a high number of local free volumes that can be ascribed to the fastest propagation being in the core.
The fraction decreased more significantly towards the inner surface of the mould, and the number of holes was smaller than in the middle of the reaction zone. It was also shown that, at the beginning of the reaction volume, the free volume fraction in the core gradually increased up to the 3rd disc, after which it was saturated. This may be due to the lower interface temperature between the reaction volume and the mould wall.
There was a decrease in the size of the holes in the axial direction of the reaction volume for the samples. The largest holes were mostly in the starting area of the reaction volume.
Finally, the microscopic features of the structural changes during the frontal polymerization of epoxides, by PALS technique, had not been investigated before. Our study revealed the propagation of the front in bulk samples, such as spinoidal–helical rotation, with consequences for local inhomogeneities in the structure.
More detailed relationships between the propagation of the frontal reaction and the free volume characteristics will be the subject of future studies.
Abbreviations
| TCES | “Classically” thermally-cured epoxy sample |
| PCES | “Classically” photo-cured epoxy sample |
| thermal RICFP | Heat-induced cationic frontal polymerization |
| photo RICFP | UV light-induced cationic frontal polymerization |
| TC | Thermocouple |
| rh | Radius of voids |
| τo-Ps | ortho-Positronium lifetime |
| Vh | Void volume |
| τo-Ps × Io-Ps | Free volume fraction parameter |
Conflicts of interest
There are no conflicts to declare.Acknowledgements
The authors acknowledge the VEGA Agency, Slovakia (Grants No. VEGA 2/0029/20).Notes and references
- R. F. Fischer, Ind. Eng. Chem., 1960, 52, 321–323 CrossRef CAS.
- H. Q. Pham and M. J. Marks, Chapter: Epoxy Resins, Ullmann's Encyclopedia of Industrial Chemistry, Wiley-VCH Verlag GmbH & Co. KGaA, Weinheim, 7th edn, 2012, pp. 156–238 Search PubMed.
- M. Capelot, D. Montarnal, F. Tournilhac and L. Leibler, J. Am. Chem. Soc., 2012, 134, 7664–7667 CrossRef CAS.
- J. A. Pojman, Frontal Polymerization: A Comprehensive Reference, ed. K. Matyjaszewski and M. Möller, Elsevier, Amsterdam, 2012, pp. 957–980 Search PubMed.
- A. Mariani, S. Bidali, S. Fiori, M. Sangermano, G. Malucelli, R. Bongiovanni and A. Priola, J. Polym. Sci., Part A: Polym. Chem., 2004, 42, 2066–2072 CrossRef CAS.
- D. Bomze, P. Knaack and R. Liska, Polym. Chem., 2015, 6, 8161–8167 RSC.
- D. Bomze, P. Knaack, T. Koch, H. Jin and R. Liska, J. Polym. Sci., Part A: Polym. Chem., 2016, 54, 3751–3759 CrossRef CAS.
- P. Knaack, N. Klikovits, A. D. Tran, D. Bomze and R. Liska, J. Polym. Sci., Part A: Polym. Chem., 2019, 57, 1155–1159 CrossRef CAS.
- N. Klikovits, P. Knaack, D. Bomze, I. Krossing and R. Liska, Polym. Chem., 2017, 8, 4414–4421 RSC.
- T. Goworek, Positronium as a Probe of Small Free volumes in Crystals, Polymers and Porous Media, Ann. Univ. Mariae Curie-Sklodowska, Sect. AA: Chem., 2014, LXIX(1–2), 1–110 Search PubMed http://www.annales.umcs.lublin.pl.
- W. Salgueiro, A. Marzocca, A. Somoza, G. Consolati, S. Cerveny, F. Quassso and S. Goyanes, Polymer, 2004, 45, 6037–6044 CrossRef CAS.
- G. Consolati and F. Quasso, Morphology of free-volume holes in amorphous polymers by means of positron annihilation lifetime spectroscopy, in Polymer physics: from suspensions to nanocomposites and beyond, ed. L. A. Utracki and A. M. Jamieson, Wiley, Hoboken, NJ, USA, 2010 Search PubMed.
- T. Suzuki, K. Ito, K. Endo and S. Fujita, Appl. Radiat. Isot., 1989, 40, 397–402 CrossRef CAS.
- S. Alessi, E. Caponetti, O. Güven, M. Skbulut, G. Spadaro and A. Spinella, Macromol. Chem. Phys., 2015, 216, 538–546 CrossRef CAS.
- L. Yang, H. A. Hristov, A. F. Yee, D. W. Gidley, D. Bauchiere, J. L. Halary and L. Monnerie, Polymer, 1995, 36, 3997–4003 CrossRef CAS.
- Y. C. Jean, T. C. Sandreczki and D. P. Ames, J. Polym. Sci., Part B: Polym. Phys., 1986, 24, 1247–1258 CrossRef CAS.
- T. Suzuki, Y. Oki, M. Numajiri, T. Miura, K. Kondo and Y. Ito, Polymer, 1993, 34, 1361–1365 CrossRef CAS.
- T. Suzuki, Y. Oki, M. Numajiri, T. Miura, K. Kondo, T. Hayashi, H. Nakamura and Y. Ito, J. Radioanal. Nucl. Chem., 1996, 210, 555–562 CrossRef CAS.
- T. Suzuki, T. Hayashi and Y. Ito, Acta Phys. Pol., A, 1999, 95, 671–676 CrossRef CAS.
- P. N. Patil, S. K. Rath, K. Sudarshan, D. Dutta, M. Patri and P. K. Pujari, Conf. Proceedings of Conference on Physics of Emerging Functional Materials, 2010, vol. 1313, pp. 298–300 Search PubMed.
- Y. M. Maksimov, A. T. Pak, G. B. Lavrenchuk, Y. S. Naiborodenko and A. G. Merzhanov, Combust., Explos. Shock Waves, 1979, 15, 415–418 CrossRef.
- J. A. Pojman, Math. Modell. Nat. Phenom., 2019, 14, 604 CrossRef CAS.
- M. Eldrup, D. Lightbody and J. N. Sherwood, Chem. Phys., 1981, 63, 51–58 CrossRef CAS.
- J. Kansy, Nucl. Instrum. Methods Phys. Res., Sect. A, 1996, 374, 235–244 CrossRef CAS.
- S. T. Cholake, M. R. Mada, R. K. S. Raman, Y. Bai, X. Zhao, S. Rizkalla and S. Bandyopadhyay, Def. Sci. J., 2014, 64, 314–321 CrossRef CAS.
- L. Li, Q. Wu, S. Li and P. Wu, Appl. Spectrosc., 2008, 62, 1129–1136 CrossRef CAS.
- W. Zhang, A. A. Dehghani-Sanij and R. S. Blackburn, Prog. Nat. Sci., 2008, 18, 801–805 CrossRef CAS.
- J. Coates, Interpretation of Infrared Spectra, A Practical Approach, Encyclopedia of Analytical Chemistry, ed. R. A. Meyers, John Wiley & Sons Ltd, Chichester, 2000, pp. 10815–10837 Search PubMed.
- L. Rey, J. Galy, H. Sautereau, G. P. Simon and W. D. Cook, Polym. Int., 2004, 53, 557–568 CrossRef CAS.
- Y. Kobayashi, W. Zheng, E. F. Meyer, J. D. McGervey, A. M. Jamieson and R. Simha, Macromolecules, 1989, 22, 2302–2306 CrossRef CAS.
- Y. Y. Wang, H. Nakanishi, Y. C. Jean and T. C. Sandreczki, J. Polym. Sci., Part B: Polym. Phys., 1990, 28, 1431–1441 CrossRef CAS.
Footnote |
| † Electronic supplementary information (ESI) available. See DOI: 10.1039/d0ra08298h |
| This journal is © The Royal Society of Chemistry 2020 |

