 Open Access Article
Lanthanide contraction effect and white-emitting luminescence in a series of metal–organic frameworks based on 2,5-pyrazinedicarboxylic acid†
Marina O. Barsukova *ab,
Sofia V. Cherezovaab,
Aleksandr A. Sapianik
 ab,
Olga V. Lundovskayaab,
Denis G. Samsonenko
 ab and
Vladimir P. Fedinab
aNikolaev Institute of Inorganic Chemistry, Siberian Branch of the Russian Academy of Sciences, 3 Acad. Lavrentiev Ave., 630090, Novosibirsk, Russia. E-mail: barsukova@niic.nsc.ru
bNovosibirsk State University, 2 Pirogov St., 630090, Novosibirsk, Russia
First published on 16th October 2020
Abstract
A series of lanthanide and yttrium MOFs of two structural types [M2(H2O)2(nmp)2(pzc)3] (1M) and [M2(H2O)4(pzc)3]·NMP·5H2O (2M) (where M – lanthanide or yttrium cation, nmp – N-methyl-2-pyrrolidone, pzc2− – 2,5-pyrazinedicarboxylate) was synthesized and characterized by single crystal and powder X-ray diffraction crystallography, TG, elemental analyses and IR-spectroscopy. The effect of lanthanide contraction has led to the fact that lanthanides at the beginning of the series (from lanthanum to gadolinium) have a structure different from the structure of lanthanides at the end of the series and yttrium (from terbium and beyond). According to PXRD patterns of the obtained samples mixed metal materials could be obtained not only as crystalline mixtures of two structure types but also as crystalline products of single structure type. Varying the ratio of lanthanides in the initial reaction mixture allowed us to obtain a wide color range of luminescence, including several near-white-light emitting samples.
Introduction
Materials scientists and chemists showed interest in using lanthanides for obtaining new materials long ago.1 This was facilitated not only by their unusual luminescent properties as f-elements,2–4 but also by high coordination numbers, hydrolytic and thermal stability as Lewis acids, and the possibility of being used as catalysts,5–7 sensors,8–10 molecular magnets11,12 and conductive materials.13 As photoluminescent materials, such compounds have the advantages of high sensitivity of the luminescent response, a wide colour range of emission in the visible region, large values of the Stokes shift, narrow emission bands and high luminescence lifetimes. Among all these applications, the use of mixed metal materials to obtain sources of white-emitting luminescence occupies a special place.14–16MOFs (Metal–Organic Frameworks) are a good platform for producing such materials. MOFs are a “symbiosis” of inorganic nodes with organic linkers forming the “skeleton” of the framework. MOFs have become widely known over the past couple of decades. The interest in their study is primarily due to the wide design possibilities and a large selection of source of organic linkers and metal clusters. There are many possible applications for MOFs in the areas of gas storage and separation,17–20 heterogeneous catalysis21,22 and sensing.23–28 Still one of the most necessary properties for MOFs is high thermal stability and durability over a wide pH range.29,30
With the using of rare earth elements into the framework a new subclass was created, named Lanthanide MOFs (LnMOFs) that have demonstrated their uncommon characteristics as catalysts,31 luminescent sensors,32–34 white light emitting devices35,36 as well as their role in biomedical applications.37 The main source of luminescence properties of LnMOFs called “antenna effect” includes the absorption of light by the organic linkers, followed by an energy transfer to the lanthanide metal ions and subsequent emission by them. Taking this into account the most desirable white light colour could be obtained by the combination of suitable monochromatic emission colours i.e. red, green and blue or yellow and blue. There are at least two approaches to obtain white emitting materials using lanthanides: doping of MOFs with lanthanide cations38 and synthesis of mixed-metal MOFs.39
Herein we investigate the lanthanide contraction effect on the formation of series of 3D MOFs of two structural types. We report the solvothermal synthesis of 10 MOFs based on Ln(III), Y(III) and 2,5-pyrazinedicarboxylic acid (H2pzc) and their mixed metal analogies. Obtained compounds were characterized by single crystal and powder X-ray diffraction, TG and elemental analyses, IR-spectroscopy, ICP-OES (inductively coupled plasma optical emission spectrometry) and luminescence. It was demonstrated that lanthanide compounds from lanthanum to gadolinium possesses dense 3D structure with no guest molecules while terbium, erbium and yttrium compounds crystallizes into framework with channels filled with guest molecules of NMP and water. The mixed metal materials demonstrate wide colour range of luminescence including near-white-light emitting examples.
Experimental
Materials
All chemicals were of reagent grade (≥95%) and were used as received without further purification. La(NO3)3·6H2O, Ce(NO3)3·6H2O, Pr(NO3)3·6H2O, Nd(NO3)3·6H2O, Sm(NO3)3·6H2O, Eu(NO3)3·6H2O, Gd(NO3)3·6H2O, Tb(NO3)3·6H2O, Er(NO3)3·xH2O was received from STREM Chemicals Inc. (USA), Y(NO3)3·6H2O from Dalchem (Russia), 2,5-pyrazinedicarboxylic acid dihydrate from Acros Organics (USA), DMF, N-methyl-2-pyrrolidone and concentrated HCl and HNO3 from Reachem (Russia).Physical measurements
Powder X-ray diffraction (PXRD) data were collected with Cu-Kα radiation on a powder X-ray diffractometer Shimadzu XRD 7000S. Elemental analyses were performed on the Vario Micro Cube, Elementar. Thermogravimetric analysis (TGA) was performed using TG 209 F1 Iris Thermo Microbalance (NETZSCH) instrument at temperatures between 25 and 600 °C in He atmosphere and a heating rate of 10 °C min−1. FTIR spectra (KBr pellets) were recorded in the range of 4000–400 cm−1 on a Scimitar FTS 2000 Fourier-transform infrared spectrometer. The luminescence spectra were recorded on Horiba Jobin Yvon Fluorolog 3 Photoluminescence Spectrometer, equipped with a 450 W xenon lamp, excitation/emission monochromator and FL-1073 PMT detector. Mole fractions of Eu, Tb and Gd in obtained mixed metal samples were determined by ICP-OES (inductively coupled plasma optical emission spectrometry) method using a high-resolution iCAP-6500 (Thermo Scientific, UK) spectrometer with axial view, working in the wavelength range 166–847 nm. The nebulization system consisted of a concentric pneumatic SeaSpray nebulizer and a single-pass cyclonic-type Tracey spray chamber.Synthetic procedures
Crystal structure analysis
Diffraction data for the single crystals of compounds 1La and 2Y were obtained at 130 K on an automated Agilent Xcalibur diffractometer equipped with a CCD AtlasS2 detector (Mo-Kα, graphite monochromator, ω-scans). Integration, absorption correction, and determination of unit cell parameters were performed using the CrysAlisPro program package.40 The structures were solved by dual space algorithm (SHELXT)41 and refined by the full-matrix least squares technique (SHELXL)42 in the anisotropic approximation (except hydrogen atoms). Positions of hydrogen atoms of organic species were calculated geometrically and refined in the riding model. The crystallographic data and details of the structure refinements are summarized in Table S1.† The selected bond distances and angles for obtained crystal structures are shown in Table S2.† The PLATON/SQUEEZE procedure43 was employed to calculate the contribution to the diffraction from the solvent region and thereby produced a set of solvent-free diffraction intensities. The formula of 2Y is derived from SQUEEZE results (87e− per unit cell), and closely corresponds to the empirical formula of 2Y obtained from TG and elemental analysis. Crystallographic data for the reported structures have been deposited to the Cambridge Crystallographic Data Centre under the CCDC reference numbers 2002640 and 2002641 for 1La and 2Y, respectively. Structure identity of other obtained compounds was proven by PXRD method and by comparison of unit cell parameters (for 1Pr, 1Eu, 1Gd, 2Tb, see Table S2†).Preactivation procedure
Samples of as-synthesized compounds 1La and 2Y were soaked in acetone for 3 days with changing solvent every day.Surface area and porous structure
An analysis of the porous structure was performed by a N2 and CO2 adsorption technique using Quantochrome's Autosorb iQ at 77 and 195 K, respectively. Initially the compounds were first activated in a dynamic vacuum using standard ‘outgas’ option of the equipment at 80 °C during 6 hours. Adsorption–desorption isotherms were measured within the range of relative pressures of 10−5 to 0.995. The specific surface area was calculated from the data obtained based on the conventional BET model.Elemental analysis of samples after sorption experiment
Results of elemental analyses for 1La and 2Y: calculated for 1La ([La2(H2O)2(nmp)2(pzc)3]) C28H28La2N8O16: C, 33.3; H, 2.8; N, 11.1%; found C, 33.4; H, 2.8; N, 11.1%; calculated for activated 2Y ([Y2(H2O)4(pzc)3]) C18H14N6O16Y2: C, 28.9; H, 1.9; N, 11.2%; found C, 29.0; H, 2.1; N, 11.1%.Synthesis of mixed metal materials
Mixed metal materials from 1 to 22 were synthesized according to procedure used for compound 1La but using a certain ratio of the starting metal salts, as shown in Table 1. Mole fractions of Eu, Tb and Gd in obtained mixed metal samples were analysed by ICP-OES method. Samples of powder materials (n = 2–3, weight from 2 to 10 mg) were dissolved in concentrated nitric acid and diluted with deionized water. The results of the analysis of the resulting solutions are shown in Table 1.| Sample | Mole fraction in the reaction mixtures | Mole fraction in the obtained compounds according to ICP-OES | ||||
|---|---|---|---|---|---|---|
| Eu | Tb | Gd | Eu | Tb | Gd | |
| 1Eu | 1 | 0 | 0 | 0.997 ± 0.007 | <0.002 | <0.002 |
| 1Gd | 0 | 0 | 1 | 0.0037 ± 0.0003 | 0.038 ± 0.015 | 0.95 ± 0.03 |
| 2Tb | 0 | 1 | 0 | <0.01 | 0.988 ± 0.004 | 0.012 ± 0.004 |
| 1 | 0.9091 | 0.0909 | 0 | 0.84 ± 0.06 | 0.16 ± 0.01 | <0.01 |
| 2 | 0.66(6) | 0.33(3) | 0 | 0.72 ± 0.02 | 0.28 ± 0.02 | <0.01 |
| 3 | 0.50 | 0.50 | 0 | 0.537 ± 0.003 | 0.463 ± 0.003 | <0.01 |
| 4 | 0.33(3) | 0.66(6) | 0 | 0.37 ± 0.04 | 63 ± 0.04 | <0.01 |
| 5 | 0.0909 | 0.9091 | 0 | 0.150 ± 0.005 | 0.850 ± 0.005 | <0.01 |
| 6 | 0.33(3) | 0.33(3) | 0.33(3) | 0.344 ± 0.004 | 0.357 ± 0.001 | 0.299 ± 0.003 |
| 7 | 0.90 | 0.05 | 0.05 | 0.898 ± 0.002 | 0.056 ± 0.001 | 0.047 ± 0.001 |
| 8 | 0.50 | 0.40 | 0.10 | 0.49 ± 0.03 | 0.41 ± 0.05 | 0.100 ± 0.015 |
| 9 | 0.50 | 0.10 | 0.40 | 0.51 ± 0.02 | 0.12 ± 0.03 | 0.36 ± 0.02 |
| 10 | 0.50 | 0.25 | 0.25 | 0.510 ± 0.004 | 0.26 ± 0.01 | 0.23 ± 0.02 |
| 11 | 0.40 | 0.10 | 0.50 | 0.38 ± 0.03 | 0.11 ± 0.01 | 0.51 ± 0.04 |
| 12 | 0.40 | 0.50 | 0.10 | 0.38 ± 0.03 | 0.52 ± 0.04 | 0.100 ± 0.007 |
| 13 | 0.25 | 0.50 | 0.25 | 0.24 ± 0.02 | 0.51 ± 0.03 | 0.25 ± 0.02 |
| 14 | 0.25 | 0.25 | 0.50 | 0.25 ± 0.02 | 0.24 ± 0.02 | 0.51 ± 0.04 |
| 15 | 0.10 | 0.50 | 0.40 | 0.098 ± 0.009 | 0.49 ± 0.01 | 0.41 ± 0.01 |
| 16 | 0.10 | 0.40 | 0.50 | 0.101 ± 0.002 | 0.388 ± 0.001 | 0.512 ± 0.002 |
| 17 | 0.05 | 0.90 | 0.5 | 0.042 ± 0.003 | 0.90 ± 0.06 | 0.054 ± 0.004 |
| 18 | 0.05 | 0.05 | 0.90 | 0.051 ± 0.006 | 0.051 ± 0.001 | 0.898 ± 0.007 |
| 19 | 0.10 | 0.45 | 0.45 | 0.993 ± 0.005 | 0.43 ± 0.01 | 0.48 ± 0.01 |
| 20 | 0.10 | 0.20 | 0.70 | 0.097 ± 0.001 | 0.196 ± 0.002 | 0.707 ± 0.002 |
| 21 | 0.10 | 0.30 | 0.60 | 0.095 ± 0.001 | 0.295 ± 0.002 | 0.609 ± 0.002 |
| 22 | 0.05 | 0.15 | 0.80 | 0.0491 ± 0.001 | 0.143 ± 0.002 | 0.807 ± 0.002 |
Results and discussion
Synthesis, structures description and characterization
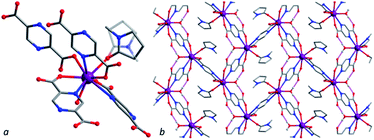
All compounds were obtained by solvothermal reactions between lanthanide nitrates or yttrium nitrate and 2,5-pyrazinedicarboxylic acid in acidified solvent mixture of NMP, DMF and water.Compound [La2(H2O)2(nmp)2(pzc)3] (1La) crystalizes in monoclinic space group P21/c. An asymmetric unit of 1La comprises a nine-coordinated La(III) cation, one and a half of pzc2− moiety and coordinated H2O and NMP molecules (Fig. 1). La(III) cation coordinates four anions, one H2O and one disordered NMP molecule playing a role of the seven-connecting node. La–OCOO bond lengths are 2.456(3), 2.487(3), 2.520(3) and 2.528(3) Å, La–Npzc ones are 2.746(3), 2.783(3) and 2.833(3) Å. La–OHOH bond length is 2.490(3) Å and La–Onmp one is 2.487(3) Å.
Lanthanum cations are connected via bridging pzc2− anions to form dense 3D structure. Three of four pzc2− moieties are chelatedly connected. A coordinated water molecule connects free O atoms of ligand carboxylic groups with hydrogen bonds. There are 6-membered rings in structure with La(III) cations as nodes and ligand moieties as edges. Coordinated solvent molecules occupy free volume formed by framework. Guest-accessible volume without coordinated solvent molecules for 1La was found to be 35% according to PLATON programme package.43
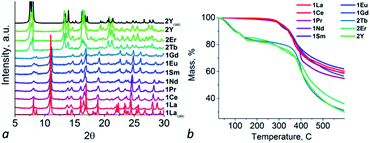
Compounds 1Ce–1Gd are isostructural to 1La according to PXRD patterns (Fig. 2a) and comparison of unit cell parameters (for 1Pr, 1Eu and 1Gd, see Table S3†). It was shown that unit cell parameters decrease during moving from La to Pr and further to Eu and Gd which is consistent with effect of lanthanide contraction. The structural integrity and phase purity of the crystalline compound was shown by PXRD. Composition of the bulk material was confirmed by IR spectra, elemental and TG analyses (Fig. S1† and 2b). Compounds 1La–1Gd have similar thermal decomposition behaviour: frameworks are stable up to 300 °C, then removal of coordinated solvent molecules starts. At about 400 °C framework decomposition starts.
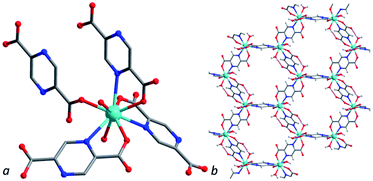
Compound [Y2(H2O)4(pzc)3]·NMP·5H2O (2Y) crystalizes in triclinic space group P![[1 with combining macron]](https://www.rsc.org/images/entities/char_0031_0304.gif) . An asymmetric unit of 2Y comprises a nine-coordinated Y(III) cation, one and a half of pzc2− moiety and coordinated H2O molecules. Y(III) cation coordinates four pzc2− anions and two H2O molecules (Fig. 3). Y–OCOO bond lengths are 2.294(2), 2.310(2), 2.3602(19) and 2.377(2) Å, Y–Npzc are 2.604(2), 2.638(2) and 2.740(2) Å. Y–OHOH bond lengths are 2.360(2) and 2.371(2) Å. All bond distances for compound 2Y are about 0.1 Å shorter then corresponding bonds in compound 1La that in a good agreement with difference in cationic radii. Bridging pyrazinedicarboxylates form a 3D structure with hexagonal channels along a axis. Guest-accessible volume for 2Y was found to be 35% according to PLATON programme package.43 Guest composition was determined and confirmed by combination of single crystal X-ray diffraction data, IR spectroscopy, elemental and TG analyses (Fig. 2 and S1†). Framework with the structure similar to 2Y was obtained using Tm(III) as metal source.44
. An asymmetric unit of 2Y comprises a nine-coordinated Y(III) cation, one and a half of pzc2− moiety and coordinated H2O molecules. Y(III) cation coordinates four pzc2− anions and two H2O molecules (Fig. 3). Y–OCOO bond lengths are 2.294(2), 2.310(2), 2.3602(19) and 2.377(2) Å, Y–Npzc are 2.604(2), 2.638(2) and 2.740(2) Å. Y–OHOH bond lengths are 2.360(2) and 2.371(2) Å. All bond distances for compound 2Y are about 0.1 Å shorter then corresponding bonds in compound 1La that in a good agreement with difference in cationic radii. Bridging pyrazinedicarboxylates form a 3D structure with hexagonal channels along a axis. Guest-accessible volume for 2Y was found to be 35% according to PLATON programme package.43 Guest composition was determined and confirmed by combination of single crystal X-ray diffraction data, IR spectroscopy, elemental and TG analyses (Fig. 2 and S1†). Framework with the structure similar to 2Y was obtained using Tm(III) as metal source.44
According to TG the first step (under about 150 °C) involves the removal of guest solvent molecules of NMP and water (calculated for one NMP and five H2O 20%, found 18%). After about 350 °C decomposition of the framework starts.
Compounds 2Er and 2Tb are isostructural to 2Y according to PXRD patterns and unit cell parameters measurements (Fig. 2a and Table S3†). According to elemental and TG analyses compound 2Tb has formula [Tb2(H2O)4(pzc)3]·NMP·5H2O and compound 2Er has formula [Er2(H2O)4(pzc)3]·NMP·5H2O. Both compounds have TG curves similar to 2Y one. On the first step upon heating both compounds lose guest solvent molecules (calculated for 2Tb 17%, found 17%, calculated for 2Er 17%, found 15%).
IR spectra are very similar for all 10 compounds (Fig. S1†). Broad bands for free O–H and C–H stretching vibrations are present in a range between 2800 and 3500 cm−1. Strong vibration bands of double C![[double bond, length as m-dash]](https://www.rsc.org/images/entities/char_e001.gif) O bonds are observed from 1633 to 1660 (asymmetric stretch) and from 1610 to 1614 cm−1 (symmetric stretch) from La to Gd. Moreover the position of the bands is shifted by increasing the atomic number of the element in the periodic table. For compounds 2Tb, 2Er and 2Y vibration bands of double C
O bonds are observed from 1633 to 1660 (asymmetric stretch) and from 1610 to 1614 cm−1 (symmetric stretch) from La to Gd. Moreover the position of the bands is shifted by increasing the atomic number of the element in the periodic table. For compounds 2Tb, 2Er and 2Y vibration bands of double C![[double bond, length as m-dash]](https://www.rsc.org/images/entities/char_e001.gif) O bonds are observed on 1631–1633 and 1603–1604 cm−1. Vibrations of C–N bond of ligand and NMP cation are visible at about 1175–1180 cm−1 for all compounds.
O bonds are observed on 1631–1633 and 1603–1604 cm−1. Vibrations of C–N bond of ligand and NMP cation are visible at about 1175–1180 cm−1 for all compounds.
BET surface characterization of selected compounds was carried out. Samples of 1La and 2Y were preactivated by exchanging of as-synthesized guest molecules with acetone and then degassed under dynamic vacuum with heating at 80 °C during 6 hours. Obtained isotherms of N2 at 77 K and CO2 at 195 K are shown in Fig. S2.† Analysis of obtained isotherms demonstrates that both compound adsorbs small amounts of gases and appear to be unporous. Calculated BET surface areas reach 7 m2 g−1 (CO2) and 6 m2 g−1 (N2) for 1La and 11 m2 g−1 (CO2) and 8 m2 g−1 (N2) for 2Y. According PXRD patterns (Fig. S3†) and elemental analyses of samples after sorption both compounds save their crystal structures but still contain coordinated solvent molecules of NMP and water while 2Y loses its guest molecules. Although both compounds save their structure after activation they cannot be used as sorbents due to inaccessibility of inner surface because of irremovable coordinated solvent molecules (1La and 2Y) and too small pore entrance (2Y). Activation under more stringent conditions leads to degradation of the framework.
Mixed metal materials (1–22) were synthesized using certain molar ratio of two lanthanide salts of Eu and Tb and three lanthanide salts of Eu, Gd and Tb in starting reaction mixture. In the first case Eu and Tb were chosen to complete RGB colour model to reach white-emitting material where Eu gives red colour luminescence, Tb – green and ligand has own intraligand luminescence of blue colour. Mole fractions of Eu and Tb in obtained materials were obtained using ICP-OES method and appear to be the same with mole fractions in reaction mixture (Table 1).
It was shown that PXRD patterns of bimetallic mixed metal materials save crystal structure of Eu compound (1Eu) for molar ratios of Eu to Tb from 10![[thin space (1/6-em)]](https://www.rsc.org/images/entities/char_2009.gif) :
:![[thin space (1/6-em)]](https://www.rsc.org/images/entities/char_2009.gif) 1 to 1
1 to 1![[thin space (1/6-em)]](https://www.rsc.org/images/entities/char_2009.gif) :
:![[thin space (1/6-em)]](https://www.rsc.org/images/entities/char_2009.gif) 1 (from sample 1 to sample 3) and structure of Tb compound (2Tb) in case of greater influence of Tb for molar ratio 1
1 (from sample 1 to sample 3) and structure of Tb compound (2Tb) in case of greater influence of Tb for molar ratio 1![[thin space (1/6-em)]](https://www.rsc.org/images/entities/char_2009.gif) :
:![[thin space (1/6-em)]](https://www.rsc.org/images/entities/char_2009.gif) 10 (for sample 5). Only in case of molar ratio of Eu to Tb 1
10 (for sample 5). Only in case of molar ratio of Eu to Tb 1![[thin space (1/6-em)]](https://www.rsc.org/images/entities/char_2009.gif) :
:![[thin space (1/6-em)]](https://www.rsc.org/images/entities/char_2009.gif) 2 (sample 4) PXRD pattern of resulting material contains peaks corresponding to both crystal structure (Fig. 4). It could be concluded that europium has a more intensive effect on the resulting structure of mixed metal framework in case of bimetallic mixed metal materials.
2 (sample 4) PXRD pattern of resulting material contains peaks corresponding to both crystal structure (Fig. 4). It could be concluded that europium has a more intensive effect on the resulting structure of mixed metal framework in case of bimetallic mixed metal materials.
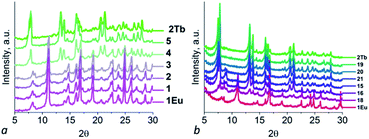 | ||
| Fig. 4 PXRD patterns for samples 1–5 (a) and 15, 16, 18, 19, 20, 21 (b) in comparison with 1Eu and 2Tb. | ||
In the case of three-metallic materials PXRD patterns of mixed metal materials changes steadily from dense structure (for higher sum of molar ratio of Eu and Gd) to porous framework (for samples with higher Tb molar ratio) (Fig. S4†). Samples 7, 8, 9, 10 and 11 with the highest mole fraction of Eu from 0.9 to 0.4 and low mole fraction of Tb up to 0.4 expectedly have structure of compound 1Eu. The corresponding samples with “mirror” mole fraction of Gd (see Table S4†) have structure of 1Gd only in case of sample 14, structure of 2Tb in case of sample 16 and mix of both structure types in case of sample 18. Thus it could be concluded that despite of the fact that Eu- and Gd-containing compounds crystallizes in one structure type their influence in three-metal system is significantly differs. Only three mixed metal samples 17, 19 and 20 have structure of 2Tb. There is a mix of two structure types in all other cases.
Photoluminescence properties
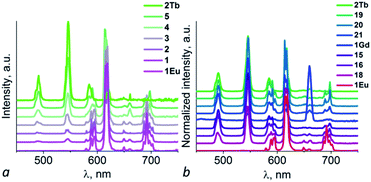
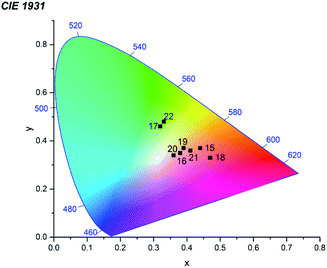
The solid-state luminescent properties of obtained samples were explored at room temperature, and the emission spectra were given in Fig. 5 and S5.† Compound 1Eu and 2Tb display bright red and green luminescence under UV irradiation, respectively. Compound 1Gd presents a weak blue luminescence. The solid-state luminescent spectra of 1Eu, excited at 330 nm, shows the narrow emission peaks at about 579, 594, 619, 649 and 692 nm, originating from 5D0 → 7F0, 5D0 → 7F1, 5D0 → 7F2, 5D0 → 7F3 and 5D0 → 7F4 f–f transitions of Eu3+ ions, respectively, in which the electric dipole transition 5D0 → 7F2 dominates the red colour emission. Compound 1Gd reveals narrow peaks at 545, 589, 616, 660 and 694 nm (λex = 330 nm), corresponding to the characteristic transitions of 5D0 → 7F0, 5D0 → 7F1, 5D0 → 7F2, 5D0 → 7F3 and 5D0 → 7F4 of Gd3+ ions, respectively. Compound 2Tb reveals narrow peaks at 491, 546, 585, 621 and 661 nm (λex = 330 nm), corresponding to the characteristic transitions of 5D4 → 7F6, 5D4 → 7F5, 5D4 → 7F4, 5D4 → 7F3 and 5D4 → 7F2 of Tb3+ ions, respectively. The strongest peak at 546 nm produces the green colour emission for 2Tb. The ligand-centred emission is completely absent in the emission bands of 1Eu–2Tb, implying efficient energy transfer from H2pzc to lanthanide ions via “antenna effect”.Mixed metal materials of different Eu and Tb molar ratios demonstrate colour range from green to red while Eu/Tb/Gd samples have wide colour range under irradiation with λex = 365 nm including not only green and red, but also near-white-light emitting samples (Fig. 6 and S6†). Dominant influence of Eu(III) cations is appeared to have key role not only in formation of crystal structure of the first type (1Eu) but also in emission spectra of ternary mixed metal materials 6–14 (Eu mole fraction from 0.90 to 0.25) which have emission spectra in the region of red colour. For selected samples with near-white-light luminescence QY were measured (Table 2). The highest QY among mixed metal materials were obtained for samples 15 (21.1%), 16 (23.7%), 20 (24.3%) and 21 (26.8%). Samples 15, 16, 17, 18, 19, 20, 21 and 22 have the closest to white-light point (0.33, 0.33) CIE coordinates among all obtained samples (Fig. 7). Taking into account that only samples 19 and 20 could be obtained as pure crystalline phase of the second structure type (according to PXRD pattern) these material could be considered the most promising for creating of luminophores for WLED from UV-LEDs.
| Sample | Quantum yield, % |
|---|---|
| 1Eu | 16.90 ± 0.01 |
| 2Tb | 26.40 ± 0.01 |
| 1 | 15.15 ± 0.01 |
| 2 | 9.61 ± 0.02 |
| 3 | 14.02 ± 0.01 |
| 4 | 12.08 ± 0.02 |
| 5 | 14.77 ± 0.01 |
| 15 | 21.09 ± 0.02 |
| 16 | 23.73 ± 0.02 |
| 17 | 15.34 ± 0.01 |
| 18 | 17.10 ± 0.01 |
| 19 | 16.26 ± 0.02 |
| 20 | 24.34 ± 0.02 |
| 21 | 26.81 ± 0.02 |
| 22 | 17.28 ± 0.02 |
Conclusions
In summary we synthesized a series of new coordination polymers based on Ln(III) and 2,5-pyrazinedicarboxylic acid and demonstrated the influence of lanthanide contraction effect on the their structure. It was demonstrated that compounds with lanthanides from lanthanum to gadolinium possesses dense 3D structure with no guest molecules while terbium, erbium and yttrium compounds crystallizes into framework with channels filled with guest molecules of NMP and water. The mixed metal materials demonstrate wide colour range of luminescence including near-white-light emitting examples.Conflicts of interest
There are no conflicts to declare.Acknowledgements
The reported study was funded by The Russian Science Foundation according to the research project no. 19-73-00169.References
- S. A. Cotton and P. R. Raithby, Coord. Chem. Rev., 2017, 340, 220 CrossRef CAS.
- A. M. Nonat and L. Charbonnière, Coord. Chem. Rev., 2020, 409, 213192 CrossRef CAS.
- X. Chen, T. Sun and F. Wang, Chem.–Asian J., 2020, 15, 21 CrossRef CAS.
- J.-C. G. Bünzli, Coord. Chem. Rev., 2015, 293–294, 19 CrossRef.
- A. R. Richard and M. Fan, J. Rare Earths, 2018, 36, 1127 CrossRef CAS.
- A. D. G. Firmino, F. Figueira, J. P. C. Tomé, F. A. Almeida Paz and J. Rocha, Coord. Chem. Rev., 2018, 355, 133 CrossRef CAS.
- H. Pellissier, Coord. Chem. Rev., 2017, 336, 96 CrossRef CAS.
- M. L. Aulsebrook, B. Graham, M. R. Grace and K. L. Tuck, Coord. Chem. Rev., 2018, 375, 191 CrossRef CAS.
- Y. Hasegawa and Y. Kitagawa, J. Mater. Chem. C, 2019, 7, 7494 RSC.
- K. Staszak, K. Wieszczycka, V. Martur and B. Tylkowski, Coord. Chem. Rev., 2019, 397, 76 CrossRef CAS.
- J.-H. Jia, Q.-W. Li, Y.-C. Chen, J.-L. Liu and M.-L. Tong, Coord. Chem. Rev., 2019, 378, 365 CrossRef CAS.
- Z. Zhu, M. Guo, X.-L. Lia and J. Tang, Coord. Chem. Rev., 2019, 378, 350 CrossRef CAS.
- L. S. Xie and M. Dincă, Isr. J. Chem., 2018, 58, 1119 CrossRef CAS.
- Z.-Y. Zhou, Y.-H. Han, X.-S. Xing and S.-W. Du, ChemPlusChem, 2016, 81, 798 CrossRef CAS.
- A. Tiwari and S. J. Dhoble, Luminescence, 2020, 35, 4 CrossRef CAS.
- Z. Zhang, Y. Chen, H. Chang, Y. Wang, X. Li and X. Zhu, J. Mater. Chem. C, 2020, 8, 2205 RSC.
- S. Qiu, M. Xue and G. Zhu, Chem. Soc. Rev., 2014, 43, 6116 RSC.
- K. Adil, Y. Belmabkhout, R. S. Pillai, A. Cadiau, P. M. Bhatt, A. H. Assen, G. Maurin and M. Eddaoudi, Chem. Soc. Rev., 2017, 46, 3402 RSC.
- D. Alezi, Y. Belmabkhout, M. Suyetin, P. M. Bhatt, Ł. J. Weseliński, V. Solovyeva, K. Adil, I. Spanopoulos, P. N. Trikalitis, A.-H. Emwas and M. Eddaoudi, J. Am. Chem. Soc., 2015, 137, 13308 CrossRef CAS.
- I. A. Ibarra, J. W. Yoon, J. Chang, S. K. Lee, V. M. Lynch and S. M. Humphrey, Inorg. Chem., 2012, 51, 12242 CrossRef CAS.
- L. Zhu, X.-Q. Liu, H.-L. Jiang and L.-B. Sun, Chem. Rev., 2017, 117, 8129 CrossRef CAS.
- Y.-B. Huang, J. Liang, X.-S. Wang and R. Cao, Chem. Soc. Rev., 2017, 46, 126 RSC.
- T. N. Nguyen, F. M. Ebrahim and K. C. Stylianou, Coord. Chem. Rev., 2018, 377, 259 CrossRef CAS.
- Z. Hu, B. J. Deibert and J. Li, Chem. Soc. Rev., 2014, 43, 5815 RSC.
- A. Douvali, A. C. Tsipis, S. V. Eliseeva, S. Petoud, G. S. Papaefstathiou, C. D. Malliakas, I. Papadas, G. S. Armatas, I. Margiolaki, M. G. Kanatzidis, T. Lazarides and M. J. Manos, Angew. Chem., Int. Ed., 2015, 54, 1651 CrossRef CAS.
- B. Gole, A. K. Bar and P. S. Mukherjee, Chem.–Eur. J., 2014, 20, 2276 CrossRef CAS.
- S. G. Dunning, A. J. Nunez, M. D. Moore, A. Steiner, V. M. Lynch, J. L. Sessler, B. J. Holliday and S. M. Humphrey, Chem, 2017, 2, 579 CAS.
- I. A. Ibarra, T. W. Hesterberg, J. Chang, J. W. Yoon, B. J. Holliday and S. M. Humphrey, Chem. Commun., 2013, 49, 7156 RSC.
- B. Liu, K. Vikrant, K.-H. Kim, V. Kumar and S. K. Kailasa, Environ. Sci.: Nano, 2020, 7, 1319 RSC.
- S. Yuan, L. Feng, K. Wang, J. Pang, M. Bosch, C. Lollar, Y. Sun, J. Qin, X. Yang, P. Zhang, Q. Wang, L. Zou, Y. Zhang, L. Zhang, Y. Fang, J. Li and H.-C. Zhou, Adv. Mater., 2018, 30, 1704303 CrossRef.
- C. Pagis, M. Ferbinteanu, G. Rothenberg and S. Tanase, ACS Catal., 2016, 6, 6063 CrossRef CAS.
- X. H. Huang, L. Shi, S. M. Ying, G. Y. Yan, L. H. Liu, Y. Q. Sun and Y. P. Chen, CrystEngComm, 2018, 20, 189 RSC.
- J. Wang, Q.-S. Zhang, W. Dou, A. M. Kirillov, W.-S. Liu, C. Xu, C.-L. Xu, R. Fang and L.-Z. Yang, Dalton Trans., 2018, 47, 465 RSC.
- Z. Hu, G. Huang, W. P. Lustig, F. Wang, H. Wang, S. J. Teat, D. Banerjee, D. Zhang and J. Li, Chem. Commun., 2015, 51, 3045 RSC.
- Y. Gai, Q. Guo, K. Xiong, F. Jiang, C. Li, X. Li, Y. Chen, C. Zhu, Q. Huang, R. Yao and M. Hong, Cryst. Growth Des., 2017, 17, 940 CrossRef CAS.
- J.-J. Yu, W.-J. Liang, Q. Zhang, M.-M. Li and D.-H. Qu, Chem.–Asian J., 2019, 14, 3141 CrossRef CAS.
- T.-T. Zheng, J. Zhao, Z.-W. Fang, M.-T. Li, C.-Y. Sun, X. Li, X.-L. Wang and Z.-M. Su, Dalton Trans., 2017, 46, 2456 RSC.
- Y. Li, T. Jing, G. Xu, J. Tian, M. Dong, Q. Shao, B. Wang, Z. Wang, Y. Zheng, C. Yang and Z. Guo, Polymer, 2018, 149, 13 CrossRef CAS.
- S. Abednatanzi, P. G. Derakhshandeh, H. Depauw, F.-X. Coudert, H. Vrielinck, P. Van Der Voort and K. Leus, Chem. Soc. Rev., 2019, 48, 2535 RSC.
- CrysAlisPro 1.171.40.74a, Rigaku Oxford Diffraction, The Woodlands, TX, 2019 Search PubMed.
- G. M. Sheldrick, Acta Crystallogr., Sect. A: Found. Adv., 2015, 71, 3 CrossRef.
- G. M. Sheldrick, Acta Crystallogr., Sect. C: Cryst. Struct. Commun., 2015, 71, 3 CrossRef.
- A. L. Spek, Acta Crystallogr., Sect. C: Cryst. Struct. Commun., 2015, 71, 9 CrossRef CAS.
- Y. Pan, D. Ma, H. Liu, H. Wu, D. Hec and Y. Li, J. Mater. Chem., 2012, 22, 10834 RSC.
Footnote |
| † Electronic supplementary information (ESI) available: X-ray crystallography data, IR spectra, PXRD patterns, luminescence spectra and photo of obtained samples. CCDC 2002640 and 2002641. For ESI and crystallographic data in CIF or other electronic format see DOI: 10.1039/d0ra08485a |
| This journal is © The Royal Society of Chemistry 2020 |

