 Open Access Article
Microwave-assisted synthesis of an RGO/CdS/TiO2 step-scheme with exposed TiO2 {001} facets and enhanced visible photocatalytic activity†
Zilun Maa,
Liyan Shia,
Wenwen Qu *ab,
Qiong Hua,
Ruifang Chena,
Yijun Wanga and
Zhen Chena
aFaculty of Science, Kunming University of Science and Technology, Kunming 650500, China. E-mail: qwwen1977@126.com
bKey Laboratory of Unconventional Metallurgy Education Ministry, Kunming University of Science and Technology, Kunming 650093, China
First published on 9th December 2020
Abstract
Semiconductor-based heterojunction photocatalysts with a special active crystal surface act as an essential part in environmental remediation and renewable energy technologies. In this study, an RGO/CdS/TiO2 step-scheme with high energy {001} TiO2 facets was successfully fabricated via a microwave-assisted solvothermal method. The photocatalytic performance of as-prepared samples was assessed by degrading methylene blue under visible light irradiation. We found that the photocatalytic activity of the RGO/CdS/TiO2 step-scheme heterojunction was related to the proportion of TiO2. A ternary sample with a TiO2 content of 10 wt% exhibited superior photocatalytic performance, and approximately 99.7% of methylene blue was degraded during 50 min of visible illumination which was much higher than the percentages found for TiO2, CdS, RGO/TiO2, and RGO/CdS. The greatly improved photocatalytic performance is due to the exposure of the reactive {001} surface of TiO2 and the formation of a CdS/TiO2 heterojunction step-scheme, which effectively inhibits the recombination of charge carriers at the heterogeneous interfaces. Moreover, the incorporation of graphene further enhances the visible light harvesting and serves as an electron transport channel for rapidly separating photogenerated carriers. Based on the PL, XPS, photoelectrochemical properties and the free radical capturing experiment results, a possible photodegradation mechanism was proposed.
1. Introduction
With rapid economic and industrial development, environmental pollution and energy shortage have become two major problems for humanity.1–3 Photocatalysis is a green technology that has great potential for use in environmental pollutant removal, the production of hydrogen via direct photolysis, and dye-sensitized solar cells.4–6 Designing and synthesizing photocatalytic materials with superior performance is a hot topic due to their wide prospects for commercial applications. TiO2 is a traditional semiconductor photocatalyst which has been widely applied in photocatalysis, solar cells, self-cleaning technologies and biosensors because of its excellent photocatalytic activity, high chemical stability, wide availability and environmental friendliness.7–10 However, TiO2 is subject to many limitations in photocatalytic performance such as weak absorption in the visible light region because of its wide band gap (3.2 eV) and it has low quantum efficiency because of the recombination of photogenerated electron–hole pairs.11,12 The photocatalytic properties of TiO2 have been shown to be affected via its shape, size, morphology and specific surface area of TiO2.13,14 In particular, the configuration of surface atoms and the extent of exposure of the reactive crystal plane determine the efficiency of the catalytic activities of TiO2.15,16 Therefore, significant attention is being attracted toward controlling the surface structure of photocatalysts.Microscale and nanoscale control of the morphology of TiO2 crystal facets is considered to be an available approach to improve visible light adsorption and to achieve better separation of charge carriers. Both theoretical and experimental investigations have proved that the catalytic performance of anatase TiO2 {001} surface is better than that of the thermodynamically steady {101} surface because of the higher surface energy of the {001} facet (0.90 J m−2) than that of the {101} facet (0.44 J m−2).17,18 However, during the normal growth of TiO2 crystals, the high energy {001} facet disappears quickly, and the crystal spontaneously forms a more thermodynamically stable {101} facet.19 Some agents, such as hydrogen fluoride (HF) and an ammonium fluoride (NH4F), can be used to control the growth of the {001} plan.19 Yang et al. first reported the anatase TiO2 monocrystal with 47% exposed {001} surfaces using HF as a shape control agent. Subsequently, a battery of high energy TiO2 surfaces with various morphologies have been successfully synthesized using fluorine-containing substances as a blocking agent. Research regarding the photocatalytic mechanism suggested that the higher surface energy of the {001} crystal plane is far more effective for the dissociative adsorption of the reactant molecules than the {101} plane, because of the low atomic coordination numbers of exposed atoms. Therefore, there are a large number of active unsaturated coordination Ti atoms and active surface oxygen atoms with wide bond angles of Ti–O–Ti in the {001} crystal plane.20–22 In addition, density functional theory (DFT) calculations indicated that the {101} and {001} faces of anatase TiO2 have different band edge positions and bandgaps, and these differences facilitate the transfer of photogenerated electrons from the {101} surface to the {001} surface.23 Therefore, the recombination rate of photogenerated electron–hole pairs at the grain boundary of TiO2 is reduced, which results in the improvement of the visible light photocatalytic performance of TiO2.24
Although the exposed {001} facets efficiently enhance the photocatalytic activity of TiO2, the poor visible light harvesting of TiO2 still limited its application in photocatalysis. Many researches have centered around expanding the visible light response region and enhancing photocatalytic efficiency via loading catalysts on large-area materials, surface sensitization, metal and non-metal ion doping and semiconductor coupling.25–30 Among these approaches, the formation of step-scheme (S-scheme) heterostructures via coupling TiO2 with narrow-bandgap semiconductors is an excellent strategy for achieving high photocatalytic efficiency.31 Construction of an S-type heterojunction usually requires two n-type semiconductor photocatalysts. At present, S-scheme heterojunction photocatalysts such as WO3/g-C3N4,32 TiO2/W18O49,33 AgI/I-BiOAc34 have been reported. CdS is recognized as one of the most promising n-type photocatalytic materials due to its negative conduction band edge position and narrow band gap (∼2.4 eV).35–37
Nevertheless, in actual application, CdS nanoparticles still have drawbacks, such as photo corrosion and a tendency to agglomeration solution.38,39 The large specific surface area of reduced graphene (RGO) can effectively disperse nanoparticles, reduce the agglomeration of active semiconductor components, and increase the effective active sites that of anchoring pollutants.40–43 Moreover, the unique pore structure and electronic properties of RGO provide fast electron transport channels for materials, and these improve the forward migration index of photogenerated carriers and electrical conductivity.44–47 Currently, there are many reports in the literature that studied the RGO/TiO2 binary heterostructures with an exposed {001} plane of TiO2,48,49 and it has been reported that introducing RGO greatly increases the photocatalytic performance of TiO2. However, there are few reports regarding the combination of the above modification methods to prepare an RGO/CdS/TiO2 S-scheme with the exposed high energy {001} surface of TiO2. In addition, compared to the traditional synthesis method, microwave-assisted synthesis is a direct heating method that is based on in situ energy conversion, and this assists in rapid selection and internal heating of materials, furthers chemical reactions, and greatly reduces heating time.50 We suggest that this efficient hybrid system and microwave-assisted synthesis will afford a new and promising method for the further development of photocatalysis.
In this study, RGO/CdS/TiO2 S-scheme heterojunction photocatalysts with an exposed high energy {001} facet of TiO2 were synthesized via the microwave-assisted solvothermal method. The morphology and structure of the as-prepared samples were characterized by XRD, SEM, TEM-EDS, UV-Vis, FT-IR, photocurrent measurements and photocatalytic properties were researched via the visible-light catalytic degradation of methylene blue (MB). The influence of TiO2 loading on the photocatalytic property of RGO/CdS/TiO2 samples was also studied. As expected, the prepared composite nanomaterials showed enhanced photocatalytic activity when they are irradiated with visible light. In addition, according to PL, XPS and free radical capture experiments, the prepared RGO/CdS/TiO2 photocatalyst conforms to the S-scheme photocatalytic enhancement mechanism.
2. Experimental
2.1. Materials and reagents
All reagents were of analytical purity and can be used without further processing. Thiourea was purchased from Chengdu Jinshan Chemical Reagent Co., Ltd. Ethanol, ethylene glycol, cadmium chloride, and urea were purchased from Tianjin Sailboat Chemical Reagent Technology Co., Ltd. Graphene was purchased from Shanghai Macklin Biochemical Co., Ltd. Ammonium fluoride was purchased from Tianjin Ruijinte Chemical Co., Ltd. Titanium sulphate was purchased from Sinopharm Chemical Reagent Co., Ltd.2.2. Synthesis of RGO/CdS/TiO2 heterojunction
The RGO/CdS/TiO2 core–shell heterojunctions with exposed {001} facets of TiO2 were compounded via a two-step, microwave-assisted solvothermal method.For comparison, TiO2 and RGO/TiO2 with exposed {001} facets were fabricated using a similar solvothermal procedure, and the products are denoted as TiO2 and GT, respectively. In addition, non-high energy surface RGO/CdS/TiO2 was prepared without adding ammonium fluoride, which is recorded as GCT-N.
2.3. Characterization
The structures and morphologies of the samples that were obtained via the experiments were characterized using a D/MAX-3B SEM. Microstructural information of the experimental samples was characterized using a JEM-2100 TEM. The surface element compositions and chemical states of the samples that were obtained via the experiment were characterized using a Thermo ESCALAB 250 XPS, and the phase structures of the samples were tested using a D/MAX-3B XRD. The functional group structure was determined using a Nicolet IS10 FTIR spectrometer. Light absorption characteristics of the samples were determined using a U-4100 UV-Vis spectrometer. Analytical structure and composition identification were determined using a Renishaw inVia Raman spectrometer, and the PL spectra of the samples were tested using a HITACHIF 4600. The light absorption performances of the catalytic samples were tested using a UV-2550 spectrophotometer. The electrochemical workstation (CHI660E, CH Instruments, China) was used to perform photoelectrochemical measurements under the irradiation of a 300 W xenon lamp. Apply a sample with an area of 1 cm2 on the TFO conductive glass as a working electrode, the platinum and a saturated Ag/AgCl electrode were used as the counter and the reference electrodes, respectively. And Na2SO3 solution was used as electrolyte. Electrochemical impedance spectroscopy (EIS) and transient photocurrent responses were performed with 5 mV amplitude in a frequency range (1 Hz to 100 kHz) under open circuit potential conditions. The Brunauer–Emmett–Teller (BET) specific surface area of the sample obtained through nitrogen adsorption–desorption isotherms at 77 K by Autosorb-iQ.2.4. Photocatalytic activity tests
Determination of photocatalytic performance of GCT nanocomposites by detecting degradation of MB aqueous solution under visible light irradiation. Firstly, 0.1 g of the as-prepared photocatalyst was suspended in 100 mL of 10 ppm MB aqueous solution, and a 30 min of dark-reaction with stirring would be implemented to achieve adsorption–desorption equilibrium. Then, the photocatalytic reaction was carried out in the PLS-LAX500ADJ photocatalytic reactor with a 300 W xenon lamp (with a light intensity of 496 mW cm−2) and a cut off filter (λ > 420 nm). Aliquots (3 mL) of the as-prepared photocatalyst were removed at specific intervals of time and centrifuged to wipe off the catalyst powders. The concentration of the MB solution was analysed via used a spectrophotometer at a maximum absorption wavelength of 664 nm.The photocatalytic degradation rate (D) can be calculated as follows:
| D = (1 − C/C0) × 100% | (1) |
In addition, radical capture experiments were carried out according to the above procedure of photocatalytic degradation test. Before the visible light irradiation, 2 mmol L−1 benzoquinone (BQ) isopropanol (IPA), disodium edetate (EDTA-2Na) and silver nitrate (AgNO3) were added to the reaction system as scavengers for superoxide radicals (˙O2−), hydroxyl radicals (˙OH), photogenerated holes (h+) and photogenerated electronics (e−), respectively.
3. Results and discussion
3.1. XRD analysis
XRD is used to characterize the crystal structure of the GT and GCT samples with that has different contents of TiO2 (Fig. 1). The diffraction peaks of GT appear at 2θ values of 25.3°, 37.8°, 48.1°, 53.9° and 55.1° can be assigned to the (101), (004), (200), (105), (211) and (116) crystal facets, respectively, of anatase-phase of TiO2 (JCPDS no. 21-1272).52 Anatase TiO2 exposes (101), and their peak intensities are much higher than other diffraction peaks, which corresponds to the {001} high-energy facets of TiO2.53 The crystallite size of TiO2 is estimated using Scherrer's formula,54 and the average size of TiO2 for GT samples was 43.7 nm. Compared to the GT sample, GCT sample exhibited additional diffraction peaks located at 2θ values of 24.8°, 26.5°, 28.2°, 36.6°, 43.7°, 47.8°, and 51.8°, and these can be indexed to the (100), (002), (101), (102), (110), (103), and (112) crystal faces, respectively, of CdS (JCPDS no. 41-1049). The characteristic peaks of TiO2 in the GCT sample is not obvious because the proportion of TiO2 in the sample is low and the characteristic peaks of (101) surface of TiO2 largely overlap with the peak of (100) surface of CdS. Hence, it is difficult to observe the enhancement of intensity of (101) peaks of TiO2 with the increase of its proportion in XRD patterns. But when we compared with the standard card as well as the relative intensity of (100) vs. (002) peaks of GCT samples, we find that the relative intensity of (100) vs. (002) enhances with the increasing the proportion of TiO2, which imply the enhancement of (101) facet of TiO2. The enhanced intensity of the (101) facet represents the enhancement of the proportion of the exposed {001} facets. Notably, after solvothermal treatment, the characteristic diffraction peak of GO near 12.2° disappeared, which suggests that most of the GO was reduced 42. Furthermore, no typical RGO diffraction peaks appeared in the XRD patterns for GT and GCT because the weak RGO diffraction peak at 23.0° is overlapped by the stronger peak of CdS, which occurs at 24.8°.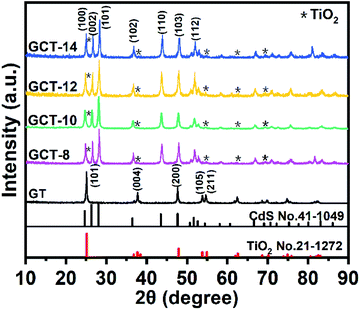 | ||
| Fig. 1 XRD patterns of GT and GCT with different contents of TiO2 (TiO2 in samples are designated with asterisk *). | ||
3.2. SEM and TEM-EDS analysis
To visualize the morphologies of the GT, GC, and GCT-10 composites, we performed SEM and TEM-EDS characterization. Fig. 2(a), (b) and (c) show the SEM images of GT, GC, and GCT-10, respectively. TiO2, CdS, and TiO2/CdS nanoparticles in GT, GC, and GCT-10 grow in high density and are uniformly distributed on the gauze-like RGO sheet, which are subjected to hydrothermal treatment to increase the number of wrinkles. RGO not only supports CdS and TiO2 nanoparticles, but it also prevents their aggregation.55 Fig. 2(d), (e), and (f) show TEM images of GT, GC, and GCT-10 samples, respectively, at the same magnification. In Fig. 2(d), nanocrystalline TiO2 is largely dispersed on RGO and is consisted of well-faceted nanocrystals with homogeneous particle size around 40 nm; this observation is consistent with the XRD results. Viewed from different perspectives, truncated rhombus, square and hexagon shapes can be seen in the TEM images, and these may be ascribed to the highly truncated octahedral bipyramidal structure that results when ammonium fluoride is used as a morphology control agent. The inset in Fig. 2(d) clearly shows lattice fringes of TiO2. The lattice spacing is 0.35 nm and corresponds to the (101) plane of anatase TiO2 (JCPDS no. 21-1272). In the light of the symmetries of anatase TiO2,23 the two thick and square surfaces in the crystal structure of the nanoparticles correspond to the {001} facet, and the other eight surfaces on the side of the truncated octahedral bipyramid correspond to the {101} facet. According to the combined XRD analysis with the SEM and TEM images, it can be concluded that the high energy {001} facets are successfully exposed in the GT sample. In the case of GC, CdS displays spherical nanoparticles that have diameters of approximately 200 nm. The lattice spacing of CdS in GC is 0.32 nm and corresponds to the (101) crystal plane of CdS (JCPDS no. 41-1049) (inset in Fig. 2(c)). Fig. 2(f)–(i) show the TEM images of the ternary GCT-10 composite. In Fig. 2(f) and (g), the morphology of GCT-10 sample is similar to that of the GC spherical nanoparticles, and the average size of the nanoparticles is 250–300 nm. The lamellar structure of multilayers of RGO stacked together exhibits a curly edge. In particular, the nanocrystalline TiO2 coated on the surface of CdS forms a core–shell structural heterojunction. The coated TiO2 shell protects the CdS nanoparticles from aggregation, photocorrosion, or effects of other reagents,56,57 and this indicates improved photocatalytic activity. Further observation with high magnification TEM images (Fig. 2(h)) shows a truncated octahedral bipyramidal structure of TiO2 in GCT-10 sample which is similar to that in GT. The side length of the bipyramid is approximately 20 nm, which is smaller than that in GT because of the lower concentration of TiO2 in the GCT-10 composite. This observation further demonstrated that the high energy {001} facet of TiO2 was fabricated. The lattice fringes of the GCT-10 sample are obviously seen in the enlarged HRTEM image in Fig. 2(i). The lattice spacings of 0.35 nm and 0.32 nm corresponds to the anatase TiO2 (101) and CdS (101) crystal facets, respectively, and these values indicate the intimate integration of TiO2 and CdS. In addition, compared with GCT-10, GCT-N show different morphology of TiO2. The TEM images exhibit many spherical and irregular TiO2 nanoparticles on the surface of CdS (Fig. S1(a) and (b) of ESI†). By analysis of the HRTEM image, we cannot observe any truncated octahedral bipyramidal structure, indicating no {001} facets TiO2 are exposed. The measured lattice spacing of GCT-N is 0.35 nm, which can be attributed to the (101) plane of anatase TiO2 (Fig. S1(c) of ESI†). Fig. 2(j), (k), (l) and S1(d)† show EDS diagrams of the GT, GC, GCT-10 and GCT-N samples, respectively. As shown, the samples contain five elements (C, Ti, O, Cd, and S), and this further confirms the presence of TiO2, CdS, and RGO in the heterostructures.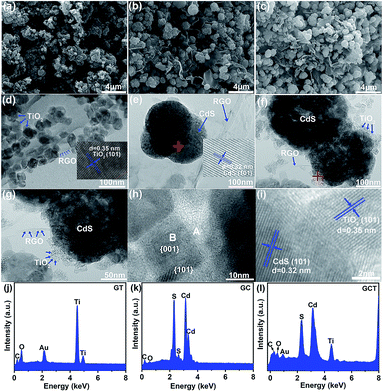 | ||
| Fig. 2 SEM images of GT (a), GC (b) and GCT-10 (c). TEM images of GT (d), GC (e), and GCT-10 (f–i). EDS diagrams of GT (j), GC (k) and GCT-10 (l). | ||
3.3. XPS analysis
XPS detections are performed to further investigate the chemical composition and elemental chemical states in the GC, GT, and GCT-10 samples. The full XPS spectrum of the GC, GT, and GCT-10 samples are shown in Fig. 3(a). The GCT-10 sample shows Ti 2p, Cd 3d, O 1s, S 2p and C 1s orbitals, and the corresponding binding energies are 459.2 eV, 530.3 eV, 530.0 eV, 161.7 eV and 284.4 eV, respectively. This indicates that TiO2, CdS, and graphene were successfully composited, which is in well accordance compliance with the XRD and EDS results. Fig. 3(b)–(f) show a comparison of high resolution XPS spectra of Ti 2p, Cd 3d, O 1s, S 2p, and C 1s for the GT, GC, and GCT-10 samples. The Ti 2p peaks of GT at 458.6 eV and 464.3 eV are attributed to Ti 2p3/2 and Ti 2p1/2, respectively. GCT-10 shows a slight negative shift (0.3 eV) in the Ti 2p binding energy compared to that of GT. Meanwhile, the Cd 3d peaks of GC at 404.3 eV and 411.0 eV are corresponded to Cd 3d5/2 and Cd 3d3/2, respectively (Fig. 3(c)). Two similar peaks at 405.3 eV and 412.0 eV are detected in GCT-10, which shift towards the higher energy region by 1.0 eV, compared to those of GC. Moreover, the characteristic peaks of the O 1s spectra of GT samples at 529.6 eV are associated with Ti–O. The corresponding O 1s peak of GCT-10 is located at 529.5 eV, which also slightly shifts toward lower binding energy by 0.1 eV. The corresponding binding energies of –OH in GT and GCT-10 are 531.1 eV and 531.4 eV, respectively. The other peak in the O 1s spectrum are located at 532.3 eV in the GT and GCT-10 samples and are attributed to C–O. The S 2p peaks of GC at 160.9 eV and 162.1 eV are attributed to S 2p3/2 and S 2p1/2, respectively. Compared with GC, GCT-10 has moved forward 0.1 eV. Compared with the binary compounds, GCT-10 shows the decrease in the binding energies of Ti 2p and O 1s, suggesting an increase in electronic density on the TiO2. On the contrary, the increase in the binding energies of Cd 3d and S 2p suggest a decrease in electronic density on the CdS. The opposite shift of binding energy indicates the electrons migration pathway across the heterogeneous interface of TiO2 and CdS. When TiO2 is deposited on CdS, the close interfacial contact between TiO2 and CdS makes it possible to transfer electrons from CdS to TiO2 according to the more negative Fermi level and smaller work function of CdS than TiO2 until the Fermi levels of TiO2 and CdS are the same,58 which is in well agreement with the S-scheme mechanism. In addition, Fig. 3(f) shows the C 1s of GO, GC, and GCT-10 samples. The binding energy at 284.4 eV, 286.2 eV and 532.3 eV is attributed to C–C, C–O and C![[double bond, length as m-dash]](https://www.rsc.org/images/entities/char_e001.gif) O of GCT samples, respectively. In the GC sample, the peak values of C–C, C–O and C
O of GCT samples, respectively. In the GC sample, the peak values of C–C, C–O and C![[double bond, length as m-dash]](https://www.rsc.org/images/entities/char_e001.gif) O are 284.6 eV, 286.2 eV and 288.3 eV, respectively. Compared with GO, the strength of the peak that corresponds to the oxygen-containing functional groups (C–O) in the GC and GCT composite is significantly less than that in GO (Fig. 3(f)). This indicates that most of the oxygen-containing functional groups are successfully removed and that GO is efficiently reduced to RGO after it is fabricated with CdS and TiO2. RGO serve as an electron acceptor and transport channel for fast separation and migration of photogenerated electrons generated from the catalysts, which enhances the conductivity of the sample. Therefore, the well-fabricated S-scheme TiO2/CdS heterostructure and the introduction of RGO is favourable for the GCT samples with enhanced photocatalytic activity.59
O are 284.6 eV, 286.2 eV and 288.3 eV, respectively. Compared with GO, the strength of the peak that corresponds to the oxygen-containing functional groups (C–O) in the GC and GCT composite is significantly less than that in GO (Fig. 3(f)). This indicates that most of the oxygen-containing functional groups are successfully removed and that GO is efficiently reduced to RGO after it is fabricated with CdS and TiO2. RGO serve as an electron acceptor and transport channel for fast separation and migration of photogenerated electrons generated from the catalysts, which enhances the conductivity of the sample. Therefore, the well-fabricated S-scheme TiO2/CdS heterostructure and the introduction of RGO is favourable for the GCT samples with enhanced photocatalytic activity.59
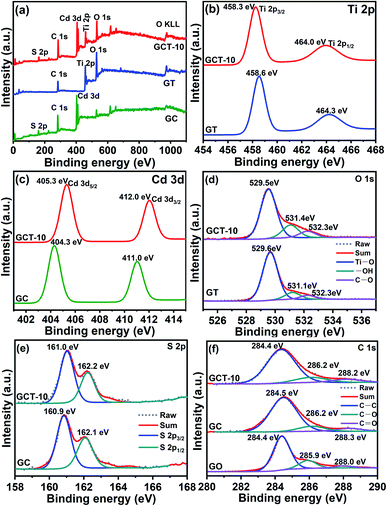 | ||
| Fig. 3 XPS spectra of GC, GT, GCT-10 samples (a) and comparison of high-resolution XPS spectra of Ti 2p (b), Cd 3d (c), O 1s (d), S 2p (e) and C 1s (f) of GC, GT, and GCT-10. | ||
3.4. Optical properties
3.5. Photoelectrochemical properties
The interfacial charge-carrier separation and transfer efficiency of the GCT-10, GCT-N, GT and GC samples was investigated by photoelectrochemical measurements. Fig. 8(a) shows the transient photocurrent response of different samples under the same wavelength (420 nm) of light. It can be found that all samples will immediately detect a significant current in the light (ON), and will drop to almost zero in the dark (OFF) condition. After repeated ON/OFF cycles, the transient photocurrent response of GC, GT, GCT-N, and GCT can still be reproducible and stable. It is widely accepted that the reason for the generation of photocurrent is the diffusion of photogenerated electrons and the capture of photo-induced holes in the electrolyte.4,5,62 Compared with GC, GT, GCT-N, GCT has the highest photocurrent response, suggesting more efficient separation and longer lifetimes for the photo-excited carries of GCT-10. Fig. 8(b) shows the experimental results of electrochemical impedance spectroscopy (EIS) Nyquist impedance plot, under the visible light irradiation. Rs represents the solution impedance, Rct represents the charge transfer impedance, and C is the electric double layer capacitance.14,64,65 The Rs of GC, GT, GCT-N and GCT-10 samples correspond to 24.10 Ω cm2, 26.78 Ω cm2, 25.96 Ω cm2 and 24.43 Ω cm2, respectively. The similarity of Rs indicates that the photocurrent test is measured in the same environment. The Rct of GC, GT, GCT-N and GCT-10 samples are 427.9 Ω cm2, 123.7 Ω cm2, and 71.85 Ω cm2 are 65.43 Ω cm2. We can observe that the order of the impedance arc radius of the samples is GCT < GCT-N < GT < GC. Obviously, the impedance arc radiuses of ternary composites are smaller than those of the binary ones. GCT-10 shows the smallest impedance arc radius among these four samples, indicating the best electrical conductivity, which will prompt the effective migration of the photo-induced carries and reduced charge transfer resistance, thus the photocatalytic efficiency can be greatly enhanced.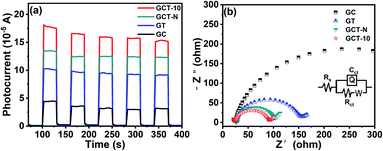 | ||
| Fig. 8 Transient photocurrent response (a) and electrochemical impedance spectroscopy (EIS) Nyquist impedance plots (b) of TiO2, CdS, GT, GC, and GCT-10 samples. | ||
3.6. Photocatalytic performance
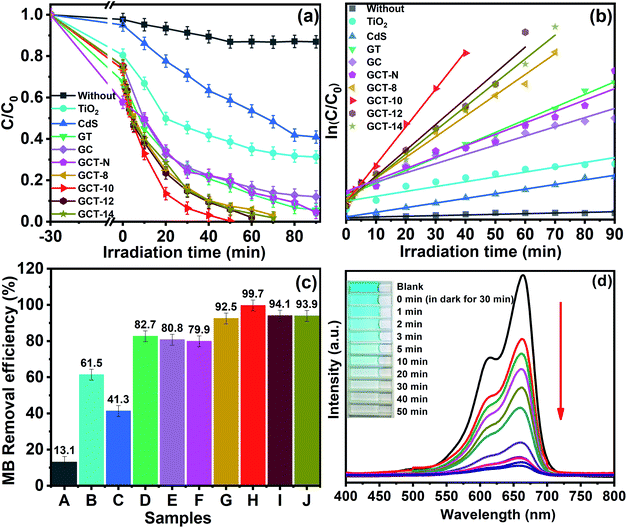
Degradation of an MB aqueous solution exposed to visible-light irradiation was used to evaluate the photocatalytic activities of the GCT heterostructures with different amounts of TiO2 loading were evaluated via the degradation of an MB aqueous solution exposed to visible light. MB is a cationic dye that is used in dyeing processes, and it is often use as a model for evaluating photocatalysts. Fig. 9(a) shows the relationship between C/C0 of MB degradation in different samples and irradiation time, where C is the concentration of MB at time t and C0 is the initial concentration of MB. Obviously, in the absence of photocatalyst, the self-degradation of MB is almost insignificant. For the 30 min reaction in the dark, each sample underwent little adsorption of MB, suggesting that adsorption–desorption equilibrium was established. The CdS, TiO2, GC, GT, and GCT samples showed approximately 5%, 19.5%, 24.6%, 32.2%, and 26.5% adsorption of MB molecules, respectively, and these values indicate that adsorption in the dark has negligible effect on the photocatalytic activities. However, under visible light irradiation, compared with those of TiO2, CdS, GC and GT, the MB degradation photocatalytic performance of the GCT-10 composites was greatly enhanced. Moreover, the photocatalytic efficiency of the GCT samples are related to the proportion of TiO2 in the composites. GCT-10 (which has a TiO2 content of 10 wt%) exhibits the highest MB degradation rate (99.70%) at a reaction time of 50 min. Under the similar conditions, the MB degradation rates for CdS, TiO2, GC, and GT only reach 41.3%, 61.5%, 80.8%, and 82.7%, respectively (Fig. 9(c)). The photocatalytic performance of the GCT composites is significantly improved due to the S-scheme heterostructure between TiO2 and CdS, and the good dispersity and electronical conductivity of RGO. By comparing the GCT-10 and GCT-N samples we can find that the MB degradation rates for GCT-N reached 79.9%, which is less about 20% than the GCT-10 sample under the same conditions. Obviously, the difference of photocatalytic activity between the two samples can be ascribed to the different morphology of TiO2. The TiO2 with high energy {001} facet play a key role in determining the overall photocatalytic activity of GCT-10 composite through effectively accelerating the separation and transfer of carrier charges between the heterogeneous interface and promoting the dissociative adsorption of organic molecules on the reactive surface. The rate constant of MB degradation can be normalized to specific surface area to evaluate the contribution of surface area to the enhanced photocatalytic activity.66 In order to calculate the surface area of the sample, we made an adsorption equilibrium isotherm (Fig. S2(a) and (b)†). From the Table 1 we can see that the BET surface area of GCT samples slightly increase with the enhancement of TiO2 proportion, and the BET surface area of all ternary samples is in the range of 21–24 m2 g−1, respectively. When dividing BET by k respectively, the normalized rate constants of MB photodegradation (k′) are 0.0020, 0.0035, 0.0023, and 0.0021 min−1 m−2, respectively. The GCT-10 show the highest k′, indicating the superior photocatalytic performance for MB degradation. Apparently, the contribution of surface area to the enhanced photocatalytic activity is not significant for GCT samples. Moreover, all GCT samples show much lower BET surface area compared to TiO2 and GT, but exhibit higher photocatalytic activity. Hence, the major contribution of the enhanced photocatalytic performance may come from the synergistic effect of the CdS/TiO2 heterojunction step-scheme, which is related to the loading capacity of TiO2 on CdS. The decrease of photocatalytic property with the further increase of TiO2 content can be ascribed to the excessive TiO2 loading on CdS, which hampers visible light harvesting of CdS. Therefore, an appropriate amount of TiO2 is important for improving the photocatalytic ability of the GCT composite. This result is in consistent with the UV-Vis DRS analysis.| TiO2 content | k/min−1 | R2 | BET/m2 g−1 | k′/min−1 m−2 |
|---|---|---|---|---|
| Without | 0.0013 | 0.8289 | — | — |
| CdS | 0.0023 | 0.8289 | 7.6 | 0.0003 |
| TiO2 | 0.0101 | 0.8894 | 60.0 | 0.0002 |
| GC | 0.0192 | 0.9910 | 5.8 | 0.0033 |
| GT | 0.0264 | 0.9922 | 62.6 | 0.0004 |
| GCT-N | 0.0238 | 0.9055 | 20.8 | 0.0011 |
| GCT-8 | 0.0432 | 0.9922 | 21.9 | 0.0020 |
| GCT-10 | 0.0785 | 0.9988 | 22.1 | 0.0035 |
| GCT-12 | 0.0537 | 0.9828 | 23.1 | 0.0023 |
| GCT-14 | 0.0496 | 0.9940 | 23.7 | 0.0021 |
The Langmuir–Hinshelwood model is chosen to quantify the reaction kinetics of MB degradation when MB is in the millimolar range. A pseudo-first-order kinetic equation is used: −ln(C/C0) = kt, where k and t are the reaction rate constant and irradiation time, respectively. Fig. 9(b) shows the linear photodegradation plot of −ln(C/C0) = kt for MB photodegradation. The values of the rate constant k and R-squared (R2) for each sample can be determined from a linear fitting. The adsorption part was not considered in the reaction kinetics. Table 1 lists the values of the kinetic parameters k and R-square (R2). As seen in the table, GCT-10 has the highest k value (0.0785 min−1), indicating the best photocatalytic performance, which is approximately 3, 3, 4, 8, and 34 times of degradation rate of GCT-N, GT, GC, TiO2, and CdS, respectively. This result further confirms the remarkably improved photocatalytic activity of the GCT photocatalysts. Fig. 8(d) shows the temporal evolution of the UV-vis spectra of MB solution in the presence of GCT-10 with visible light irradiation. A rapid decrease in MB absorption was observed at a maximum wavelength of 664 nm, and the colour of the suspension faded from blue to light blue and then to colourless, which suggests the complete degradation of MB. In addition, there was no apparent shift in the maximum absorption band of MB, which indicates that the degradation process is not accompanied by N-demethylation of MB to generate intermediates. MB degradation may be followed by hydroxyl radicals attacking the aromatic chromophore ring, which leads to cleavage of the MB structure.67 It is noteworthy that the photocatalytic effect of the as-prepared GCT samples in our study that had high energy {001} facets of TiO2 was superior to that of GCT samples without exposed {001} facets,61 and this implied that fabrication of TiO2-based S-scheme heterojunctions with high energy {001} facets of TiO2 is an beneficial strategy for enhancing photocatalytic performance.
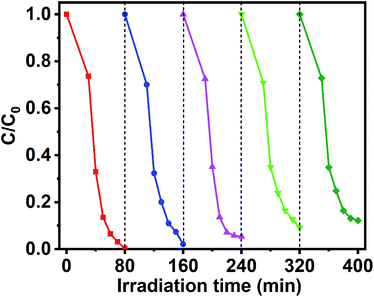
In addition to photocatalytic properties, the stability of the catalyst is also an important factor in its effectiveness. Therefore, GCT-10 sample were subjected to photocatalytic cycling experiments to assess their photocatalytic stability. The result reveals that after five recycling runs for MB photodegradation, the degradation rates of GCT-10 samples decreased by only 11.89% (Fig. 10). Compared with the easily photo corrosion CdS photocatalysts reported in literature, GCT-10 is considerably stable during the photoinduced reaction process, which further suggests that the ternary GCT photocatalysts have great potential for environmental remediation.
3.7. Photodegradation mechanism
To understand the band position and the photocatalytic mechanism of GCT heterostructures, we calculated the valence band (VB) potential EVB and the conduction band (CB) potential ECB of TiO2 and CdS using the following empirical equations:| EVB = χ − Ee + 0.5Eg | (2) |
| ECB = EVB − Eg | (3) |
To prove the accuracy of the theoretical analysis, we did a capture experiment to detect the main active substances of GCT-10 in the MB decomposition process. EDTA-2Na, AgNO3, BQ, and IPA and were used as h+, e−, ˙O2− and ˙OH scavengers, respectively. In Fig. 11(a), when EDTA-2Na was added, the degradation efficiency for MB decreased markedly, indicating h+ is the remarkable active species in the MB photodegradation process. Meanwhile, significant inhibition was noted when BQ and IPA were added into the reaction system, which suggest that ˙O2− and ˙OH play essential roles in the process of MB degradation. Comparatively, the decline of degradation efficiency after AgNO3 addition is less obvious than that for the other three scavengers, indicating that relatively fewer e− were participated in the photocatalytic process. After EDTA-2Na, BQ, IPA and AgNO3 were added, the degradation efficiency for MB declined from 99.70% to 28.11%, 36.02%, 43.33% and 73.31%, respectively (Fig. 11(b)). Apparently, h+, ˙O2−, and ˙OH are the major active species for MB photodegradation, which are consistent with the calculated results.
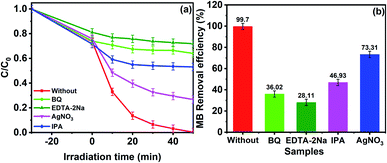 | ||
| Fig. 11 Active species capture experiment during the photocatalytic degradation of MB by GCT-10 exposed to visible light. | ||
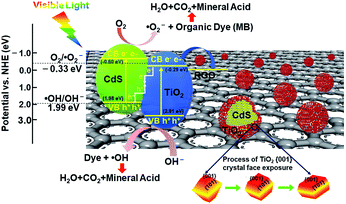
Based on the band potential calculations and free radical capturing experiments, an S-scheme photocatalytic mechanism of the GCT heterogeneous photocatalyst is proposed and illustrated in Scheme 2. When TiO2 has an appropriate proportion of exposed {001} and {101} facets, the high active {001} facets and the efficient transfer of photogenerated electrons from the {101} to {001} planes will increase the photocatalytic activity of samples.23 However, when TiO2 is loaded on CdS, a tight heterogeneous interface forms via the close contact between TiO2 and CdS. Since Fermi level of CdS is more negative than that of TiO2,52 the electrons in CdS automatically flow to TiO2 through their interface until the Fermi levels are equal. Therefore, an internal electric field is generated at the interface, which is from CdS to TiO2. When exposed to visible light, CdS and TiO2 in the GCT heterojunctions are first excited to generate electrons and holes. Relatively unused electrons in the CB of TiO2 and relatively unused holes in the VB of CdS are recombined and excluded annihilated at the interface. In contrast, the conducive holes in VB of TiO2 and conducive electrons in CB of CdS are retained because of the existence of the internal electric field. Simultaneously, RGO with a lower energy potential (−0.08 eV vs. NHE)72 in this system further leads to a fast charge transfer from CdS/TiO2 heterojunction to the RGO sheet through its unique π–π conjugated structure. Therefore, efficient separation of photogenerated electrons and holes occurs at the ternary heterojunction, which can greatly reduce the recombination of the photoinduced charge carriers.
In brief, the promoted photocatalytic performance can be ascribed to the synergistic effect among high energy {001} facet TiO2, S-type TiO2/CdS heterojunction, and RGO. Particularly, the S-scheme heterojunction with exposed high energy {001} facet of TiO2 demonstrates a reasonable and efficient charge transfer and separation process and provide the photocatalyst with excellent redox capacity for the degradation of pollutants.
4. Conclusions
In summary, we report the successful fabrication of the RGO/CdS/TiO2 S-scheme photocatalyst using a facile solvothermal process with microwave irradiation. The morphology and structure characterizations demonstrate that TiO2 nanocrystals with successfully exposed high energy {001} facets grow on the surface of CdS spherical nanoparticles to form an S-scheme heterojunction. The nanoparticles are uniformly distributed on the support of the RGO. Most importantly, the photocatalytic performance of the ternary heterostructures is greatly enhanced compared to those of TiO2, CdS, RGO/TiO2, and RGO/CdS. For MB degradation under visible light, the RGO/CdS/TiO2 sample with 10 wt% of TiO2 achieved the highest degradation rate (99.70%) within 50 min, resulting in a rate that is 38.2%, 58.4%, 17.0%, and 18.9% higher than those of TiO2, CdS, RGO/TiO2, and RGO/CdS samples, respectively, under the same conditions. This remarkable enhancement depends on the synergistic effect among the individual constituents of the catalyst. Specifically, this enhancement results from the following: (i) exposure of high energy {001} facets of TiO2 greatly enhance the separation and transfer efficiency of charge carriers at the heterogeneous interfaces; (ii) TiO2 and CdS formed a step-scheme heterojunction that not only promotes the separation of useful electrons and holes, but also accelerates the recombination of relatively unnecessary electrons and holes. (iii) Introducing graphene promotes visible light utility and provides more reaction sites through large specific surface area. This work provided new insight for designing and fabricating photocatalysts through exposure of high energy facets, formation of S-scheme heterojunctions, and introduction of large surface supports. In addition, microwave-assisted synthesis is an energy-efficient and eco-friendly process, which has great potential for development of heterogeneous photocatalysts for environmental remediation.Conflicts of interest
There are no conflicts to declare.Acknowledgements
This work was supported by the National Natural Science Foundation of China (No. 51562018, U1402274). We are grateful to all of the contributing authors who have offered us help.References
- D. Huang, S. Chen, G. Zeng, X. Gong, C. Zhou, M. Cheng, W. Xue, X. Yan and J. Li, Coord. Chem. Rev., 2019, 385, 44–80 CrossRef CAS.
- D. V. Markovskaya, A. V. Zhurenok, A. Y. Kurenkova, A. M. Kremneva, A. A. Saraev, S. M. Zharkov, E. A. Kozlova and V. V. Kaichev, RSC Adv., 2020, 10, 34137–34148 RSC.
- Y. Liu, J. Chen, J. Zhang, Z. Tang, H. Li and J. Yuan, RSC Adv., 2020, 10, 30245–30253 RSC.
- J. Jia, Q. Wang and Y. Wang, J. Alloys Compd., 2019, 809, 151791 CrossRef CAS.
- J. Low, B. Dai, T. Tong, C. Jiang and J. Yu, Adv. Mater., 2019, 31, 1–5 CrossRef.
- Y. H. Chiu, T. F. M. Chang, C. Y. Chen, M. Sone and Y. J. Hsu, Catalysts, 2019, 9, 430 CrossRef CAS.
- C. Zhang, Z. Xiao, T. Qin and Z. Yang, J. Mol. Recognit., 2019, 32, 1–7 Search PubMed.
- H. S. El-Sheshtawy, Z. ghubish, K. R. Shoueir and M. El-Kemary, J. Alloys Compd., 2020, 842, 155848 CrossRef CAS.
- M. Wang, Z. Cui, M. Yang, L. Lin, X. Chen, M. Wang and J. Han, J. Colloid Interface Sci., 2019, 544, 1–7 CrossRef CAS.
- J. Li, E.-H. Wu, J. Hou, P. Huang, Z. Xu, Y. Jiang, Q.-S. Liu and Y.-Q. Zhong, RSC Adv., 2020, 10, 34775–34780 RSC.
- K. Xu, Z. Liu, S. Qi, Z. Yin, S. Deng, M. Zhang and Z. Sun, RSC Adv., 2020, 10, 34702–34711 RSC.
- P. Y. Hsieh, J. Y. Wu, T. F. M. Chang, C. Y. Chen, M. Sone and Y. J. Hsu, Arabian J. Chem., 2020, 13, 8372–8387 CrossRef CAS.
- H. Zhao, S. Cui, L. Yang, G. Li, N. Li and X. Li, J. Colloid Interface Sci., 2018, 512, 47–54 CrossRef CAS.
- T. Lai, K. Katsumata and Y. Hsu, Nanophotonics, 2020 Search PubMed.
- S. Liu, J. Yu and M. Jaroniec, Chem. Mater., 2011, 23, 4085–4093 CrossRef CAS.
- Z. Ghasemi, V. Abdi and I. Sourinejad, J. Alloys Compd., 2020, 841, 155593 CrossRef CAS.
- L. Ye, J. Mao, J. Liu, Z. Jiang, T. Peng and L. Zan, J. Mater. Chem. A, 2013, 1, 10532–10537 RSC.
- H. G. Yang, C. H. Sun, S. Z. Qiao, J. Zou, G. Liu, S. C. Smith, H. M. Cheng and G. Q. Lu, Nature, 2008, 453, 638–641 CrossRef CAS.
- W. J. Ong, L. L. Tan, S. P. Chai, S. T. Yong and A. R. Mohamed, Nanoscale, 2014, 6, 1946–2008 RSC.
- J. Wang, Z. Bian, J. Zhu and H. Li, J. Mater. Chem. A, 2013, 1, 1296–1302 RSC.
- J. Yu, L. Qi and M. Jaroniec, J. Phys. Chem. C, 2010, 114, 13118–13125 CrossRef CAS.
- M. V. Sofianou, C. Trapalis, V. Psycharis, N. Boukos, T. Vaimakis, J. Yu and W. Wang, Environ. Sci. Pollut. Res., 2012, 19, 3719–3726 CrossRef CAS.
- J. Yu, J. Low, W. Xiao, P. Zhou and M. Jaroniec, J. Am. Chem. Soc., 2014, 136, 8839–8842 CrossRef CAS.
- Z. He, L. Jiang, D. Wang, J. Qiu, J. Chen and S. Song, Ind. Eng. Chem. Res., 2015, 54, 808–818 CrossRef CAS.
- L. L. Tan, W. J. Ong, S. P. Chai and A. R. Mohamed, Appl. Catal., B, 2015, 166–167, 251–259 CrossRef CAS.
- J. Xiao, Y. Xie, H. Cao, F. Nawaz, S. Zhang and Y. Wang, J. Photochem. Photobiol., A, 2016, 315, 59–66 CrossRef CAS.
- M. Zhang, Y. Xu, Z. Gong, J. Tao, Z. Sun, J. Lv, X. Chen, X. Jiang, G. He, P. Wang and F. Meng, J. Alloys Compd., 2015, 649, 190–195 CrossRef CAS.
- L. Luo, Y. Yang, A. Zhang, M. Wang, Y. Liu, L. Bian, F. Jiang and X. Pan, Appl. Surf. Sci., 2015, 353, 469–479 CrossRef CAS.
- M. Gao, L. Zhu, W. L. Ong, J. Wang and G. W. Ho, Catal. Sci. Technol., 2015, 5, 4703–4726 RSC.
- J. Wang, M. Gao and G. W. Ho, J. Mater. Chem. A, 2014, 2, 5703–5709 RSC.
- B. Pant, N. A. M. Barakat, H. R. Pant, M. Park, P. S. Saud, J. W. Kim and H. Y. Kim, J. Colloid Interface Sci., 2014, 434, 159–166 CrossRef CAS.
- J. Fu, Q. Xu, J. Low, C. Jiang and J. Yu, Appl. Catal., B, 2019, 243, 556–565 CrossRef CAS.
- R. Wang, J. Shen, W. Zhang, Q. Liu, M. Zhang, Zulfiqar and H. Tang, Ceram. Int., 2020, 46, 23–30 CrossRef CAS.
- X. Jia, Q. Han, M. Zheng and H. Bi, Appl. Surf. Sci., 2019, 489, 409–419 CrossRef CAS.
- V. U. Pandit, S. S. Arbuj, R. R. Hawaldar, P. V. Kshirsagar, A. J. Deshmukh, J. D. Ambekar, U. P. Mulik, S. W. Gosavi and B. B. Kale, RSC Adv., 2015, 5, 13715–13721 RSC.
- Z. Yu, B. Yin, F. Qu and X. Wu, Chem. Eng. J., 2014, 258, 203–209 CrossRef CAS.
- M. J. Fang, C. W. Tsao and Y. J. Hsu, J. Phys. D: Appl. Phys., 2020, 53, 143001 CrossRef CAS.
- X. Ruan, H. Hu, H. Che, E. Jiang, X. Zhang, C. Liu and G. Che, J. Colloid Interface Sci., 2019, 543, 317–327 CrossRef CAS.
- Y. Xue, Z. Wu, X. He, Q. Li, X. Yang and L. Li, J. Colloid Interface Sci., 2019, 548, 293–302 CrossRef CAS.
- K. Tsai, P. Hsieh, T. Lai, C. Tsao, H. Pan, Y. Lin and Y. Hsu, ACS Appl. Energy Mater., 2020, 3, 5322–5332 CrossRef CAS.
- E. Mahmoudi, W. L. Ang, C. Y. Ng, L. Y. Ng, A. W. Mohammad and A. Benamor, J. Colloid Interface Sci., 2019, 542, 429–440 CrossRef CAS.
- H. Zhang, C. Zhai, H. Gao, N. Fu and M. Zhu, J. Colloid Interface Sci., 2019, 547, 102–110 CrossRef CAS.
- Y. Chen, K. Katsumata, Y. Chiu, K. Okada, N. Matsushita and Y. Hsu, Appl. Catal., A, 2015, 490, 1–9 CrossRef CAS.
- K. Tsai and Y. Hsu, Appl. Catal., B, 2015, 164, 271–278 CrossRef CAS.
- Y. Pu, H. Chou, W. Kuo and K. Wei, Appl. Catal., B, 2017, 204, 21–32 CrossRef CAS.
- S. Chowdhury and R. Balasubramanian, Appl. Catal., B, 2014, 160–161, 307–324 CrossRef CAS.
- W. Hu, Y. Chen, P. Hsieh, C. Tsao, Y. Chiu, T. M. Chang, C. Chen, M. Sone and Y. Hsu, J. Taiwan Inst. Chem. Eng., 2020, 112, 337–344 CrossRef CAS.
- B. Liu, Y. Huang, Y. Wen, L. Du, W. Zeng, Y. Shi, F. Zhang, G. Zhu, X. Xu and Y. Wang, J. Mater. Chem., 2012, 22, 7484–7491 RSC.
- L. Gu, J. Wang, H. Cheng, Y. Zhao, L. Liu and X. Han, ACS Appl. Mater. Interfaces, 2013, 5, 3085–3093 CrossRef CAS.
- J. h. Peng, Y. j. Zhao, Q. Ul Hassan, H. y. Li, Y. b. Liu, S. h. Ma, D. l. Mao, H. q. Li, L. c. Meng and M. Hojamberdiev, Adv. Powder Technol., 2018, 29, 1158–1166 CrossRef CAS.
- M. Yuan, L. Wang, W. Qu, L. Zhang, J. Zhang and Z. Chen, Mater. Rep., 2019, 33, 1602–1608 Search PubMed.
- A. Meng, B. Zhu, B. Zhong, L. Zhang and B. Cheng, Appl. Surf. Sci., 2017, 422, 518–527 CrossRef CAS.
- J. Wang, P. Zhang, X. Li, J. Zhu and H. Li, Appl. Catal., B, 2013, 134–135, 198–204 CrossRef CAS.
- S. C. Pillai, J. M. Kelly, D. E. McCormack and R. Ramesh, J. Mater. Chem., 2008, 18, 3926–3932 RSC.
- S. Dong, X. Ding, T. Guo, X. Yue, X. Han and J. Sun, Chem. Eng. J., 2017, 316, 778–789 CrossRef CAS.
- D. Ke, S. Liu, K. Dai, J. Zhou, L. Zhang and T. Peng, J. Phys. Chem. C, 2009, 113, 16021–16026 CrossRef CAS.
- H. Zhu, R. Jiang, L. Xiao, L. Liu, C. Cao and G. Zeng, Appl. Surf. Sci., 2013, 273, 661–669 CrossRef CAS.
- M. Nasr, S. Balme, C. Eid, R. Habchi, P. Miele and M. Bechelany, J. Phys. Chem. C, 2017, 121, 261–269 CrossRef CAS.
- X. Rong, F. Qiu, C. Zhang, L. Fu, Y. Wang and D. Yang, Ceram. Int., 2015, 41, 2502–2511 CrossRef CAS.
- Y. Ni, W. Wang, W. Huang, C. Lu and Z. Xu, J. Colloid Interface Sci., 2014, 428, 162–169 CrossRef CAS.
- B. Pant, M. Park, S. J. Park and H. Y. Kim, Ceram. Int., 2016, 42, 15247–15252 CrossRef CAS.
- S. Liu, M. Q. Yang and Y. J. Xu, J. Mater. Chem. A, 2014, 2, 430–440 RSC.
- C. Jia, X. Zhang, K. Matras-Postolek, B. Huang and P. Yang, Carbon, 2018, 139, 415–426 CrossRef CAS.
- P. Y. Hsieh, Y. H. Chiu, T. H. Lai, M. J. Fang, Y. T. Wang and Y. J. Hsu, ACS Appl. Mater. Interfaces, 2019, 11, 3006–3015 CrossRef CAS.
- Y. S. Chang, M. Choi, M. Baek, P. Y. Hsieh, K. Yong and Y. J. Hsu, Appl. Catal., B, 2018, 225, 379–385 CrossRef CAS.
- K. H. Chen, Y. C. Pu, K. Der Chang, Y. F. Liang, C. M. Liu, J. W. Yeh, H. C. Shih and Y. J. Hsu, J. Phys. Chem. C, 2012, 116, 19039–19045 CrossRef CAS.
- T. Zhang, T. Oyama, A. Aoshima, H. Hidaka, J. Zhao and N. Serpone, J. Photochem. Photobiol., A, 2001, 140, 163–172 CrossRef CAS.
- M. A. Butler, J. Electrochem. Soc., 1978, 125, 228 CrossRef CAS.
- J. Guo, L. Shi, J. Zhao, Y. Wang, K. Tang, W. Zhang, C. Xie and X. Yuan, Appl. Catal., B, 2018, 224, 692–704 CrossRef CAS.
- E. Gao, W. Wang, M. Shang and J. Xu, Phys. Chem. Chem. Phys., 2011, 13, 2887–2893 RSC.
- Y. Huang, S. Kang, Y. Yang, H. Qin, Z. Ni, S. Yang and X. Li, Appl. Catal., B, 2016, 196, 89–99 CrossRef CAS.
- Q. Xiang, J. Yu and M. Jaroniec, J. Am. Chem. Soc., 2012, 134, 6575–6578 CrossRef CAS.
Footnote |
| † Electronic supplementary information (ESI) available. See DOI: 10.1039/d0ra08597a |
| This journal is © The Royal Society of Chemistry 2020 |


