 Open Access Article
Atomically dispersed Cu and Fe on N-doped carbon materials for CO2 electroreduction: insight into the curvature effect on activity and selectivity†
Yue Zhang,
Lei Fang and
Zexing Cao *
*
State Key Laboratory of Physical Chemistry of Solid Surfaces, Fujian Provincial Key Laboratory of Theoretical and Computational Chemistry, College of Chemistry and Chemical Engineering, Xiamen University, Xiamen 360015, China. E-mail: zxcao@xmu.edu.cn
First published on 26th November 2020
Abstract
CO2 electroreduction reaction (CO2ER) by single metal sites embedded in N-doped graphene (M@N-Gr, M = Cu and Fe) and carbon nanotubes (M@N-CNT, M = Cu and Fe) has been explored by extensive first-principles calculations in combination with the computational hydrogen electrode model. Both atomically dispersed Cu and Fe nanostructures, as the single atom catalysts (SACs), have higher selectivity towards CO2ER, compared to hydrogen evolution reduction (HER), and they can catalyze CO2ER to CO, HCOOH, and CH3OH. In comparison with Cu@N-Gr, the limiting potentials for generating CO, HCOOH, and CH3OH are reduced obviously on the high-curvature Cu@N-CNT. However, the curvature effect is less notable for the single-Fe-atom catalysts. Such discrepancies can be attributed to the d-band center changes of the single Cu and Fe sites and their different dependences on the curvature of carbon-based support materials.
1 Introduction
In recent decades, the optimal utilization of CO2 has been drawing continual attention from both industrial and academic communities, because it is not only mainly responsible for handling the greenhouse effect,1 but also an abundant, non-toxic and recyclable C1 resource. Therefore, an enormous amount of effort has been devoted to the catalytic conversion of CO2 into high value-added chemicals and reduction of greenhouse-gas emissions.2–8 The electrochemical reduction reaction of CO2 (CO2ER) can produce a variety of platform chemicals and liquid fuels through renewable electricity, such as formic acid (HCOOH), carbon monoxide (CO) and methanol (CH3OH). However, there are still many challenges for the large-scale application of CO2ER, including slow kinetics, low product selectivity, low Faraday efficiency and high overpotentials,6,9,10 and it is thus highly required to find suitable electrocatalysts to improve selectivity and efficiency of CO2ER.In the catalytic conversion of CO2, the heterogeneous catalysis stands out due to the better durability of catalyst used and reaction conditions,6,10,11 in which the conventional catalysts mainly include metals,12–14 alloys,15–17 single-atom catalysts (SACs),18–20 etc. Since the pioneering work on the SAC by Zhang and coworkers,21,22 the heterogeneous catalysis with the SACs has received great interest owing to its prominent electrocatalytic performance (e.g., high catalytic activity, stability, and selectivity) and the maximal utilization of metal atoms. Hence, SACs has been considered to be a promising alternative in various electrocatalytic reactions (e.g., CO2ER, NRR, HER, etc.).23–27 As important components of the SAC system, the single atom as the active site and its supported substrate are the key factors to influence the catalytic efficiency of CO2ER.
Recently, one of the most representative SAC substrates is the carbon-based two-dimensional (2D) material.28–32 For example, the N-doped graphene monolayer with a large specific surface area and a conjugated structure has been widely used as a substrate for SACs.29,31,33–35 Last year, Zhang et al. reported experimentally the catalytic activity of Fe-embedded N-doped graphene for CO2-to-CO reduction and the plausible reaction pathway, in combination with theoretical calculations.19 Zhou et al. theoretically studied the catalytic activity of Co-embedded N-doped graphene towards CO2ER, based on the predicted free-energy profile,36 and their results demonstrate that different Co-centered nanostructures can catalyze the electrochemical reduction of CO2 to CO. Besides, the N-doped graphene and N-doped nanotubes (CNT) have also been confirmed to possess good catalytic properties for CO2ER.37–39 On the other hand, the most common atomically dispersed active sites in SACs are transition-metal atoms, such as Fe, Co, Ni and Cu,20 and the corresponding products and catalytic efficiencies are usually metal dependent. Previous reports have revealed that Cu is a rather unique metal that produces CO as well as various hydrocarbons (such as alcohols), which has been widely applied in several types of catalysts.40–42
Very recently, Yang et al. have synthesized a highly stable CO2ER electrocatalyst, CuSAs/TCNFs with the single-atom-Cu active site, which can catalyze conversion of CO2 into CH3OH with a high Faraday efficiency of 44%.43 According to the results of Extended X-ray Absorption Fine Structure (EXAFS), the copper-centered Cu–N4 unit was proposed as the catalytic active site. Generally, the surface curvature of catalysts has a great effect on the selectivity of the product and the reaction paths, as shown in previous studies,30,44,45 For example, Chai et al.30 investigated the CO2ER catalyzed by the N-doped graphene/CNT by the first-principles calculations, and their results indicate that the surface curvature can effectively tune the CO2ER selectivity and the limiting potentials of specific products. Fan et al.45 explored the catalytic performance of Bi nanosheets and nanotubes in electrochemical reduction of CO2, and they found that the increase of curvature may enhance the activity of Bi catalyst towards the CO2 reduction to HCOOH over a wide potential range. On the contrary, the energy barrier for the CO product increases with the curvature.
Inspired by these important contributions, herein, we constructed the Cu- and Fe-embedded N-doped nanotube (Cu@N-CNT & Fe@N-CNT) and N-doped graphene (Cu@N-Gr & Fe@N-Gr) with the M–N4 (M = Cu and Fe) active site, and their structural and electronic properties, as well as the CO2ER catalytic performance of these single-atom Cu/Fe catalysts have been systematically investigated by first-principles calculations. Finally, the exerting effects of curvature on the selectivity and the limiting potentials have been discussed.
2 Computational details
2.1 Energy calculation
The binding energy (Eb) of a metal atom in M@N-Gr and M@N-CNT (M = Cu and Fe) can be defined as:| Eb = Etotal − (Esubstrate + EM) |
According to the computational hydrogen electrode (CHE) model proposed by Nørskov et al.,46 the Gibbs free energy change (ΔG) of each elementary step in the CO2ER is defined as:
| ΔG(U) = ΔG(0 V) + neU |
where ΔE is the electron energy difference directly obtained by DFT calculations, ΔZEP, ∫CpdT, and TΔS are the zero-point energy change, enthalpy change contributed by molecular vibration and entropy change at 298 K, respectively, and ΔGpH represents the free energy correction caused by variations in H+ concentration, which can be expressed as ΔGpH = kBT
![[thin space (1/6-em)]](https://www.rsc.org/images/entities/char_2009.gif) ln
ln![[thin space (1/6-em)]](https://www.rsc.org/images/entities/char_2009.gif) 10 × pH, and the pH value is set to be 0 in this work. As shown in Table S1,† the free energy of gaseous species is calculated at the standard atmospheric pressure of 1 bar, while the free energy of liquid species is obtained by using the corresponding vapor fugacity (f), based on the ideal gas-model calculations. According to previous studies,47 the chemical potential corrections of −0.09, −0.22, and −0.07 eV for H2O (aq), HCOOH (aq), and CH3OH (aq), respectively, have been considered in determination of the Gibbs free energy change.
10 × pH, and the pH value is set to be 0 in this work. As shown in Table S1,† the free energy of gaseous species is calculated at the standard atmospheric pressure of 1 bar, while the free energy of liquid species is obtained by using the corresponding vapor fugacity (f), based on the ideal gas-model calculations. According to previous studies,47 the chemical potential corrections of −0.09, −0.22, and −0.07 eV for H2O (aq), HCOOH (aq), and CH3OH (aq), respectively, have been considered in determination of the Gibbs free energy change.
To evaluate the influence of solvent on the reaction, we apply an implicit solvent model to mimic the solvation of H2O. In this case, ΔG can be expressed as:
2.2 Models and DFT calculations
Based on 5 × 3 graphene monolayer and (8, 0) carbon nanotubes doped with four N atoms, we constructed the Cu/Fe@N-Gr and Cu/Fe@N-CNT models by replacing a C2 moiety of graphene and CNT with the single Cu/Fe atom, as shown in Fig. 1. The structures of Cu/Fe@N-Gr and Cu/Fe@N-CNT were optimized by Perdew–Burke–Ernzerhof (PBE) exchange-correlation function within the generalized gradient approximation (GGA).48 The energy cutoff was set to be 450 eV, and the electronic energy and the force on each ion were converged to 10−5 eV and 0.01 eV Å−1, respectively. To consider van der Waals interaction, the dispersion corrected DFT-D3 method49 was used in all calculations. The k-points of the Brillouin zone were set to 3 × 3 × 1 and 1 × 1 × 4 for Cu/Fe@N-Gr and Cu/Fe@N-CNT, respectively. The projected density of states (PDOS) of Cu/Fe@N-Gr and Cu/Fe@N-CNT were also calculated under optimized geometries to deeply analyze the electronic properties. Furthermore, the implicit water solvent model in VASPsol50 was considered, and the electron transfer features were discussed by using the Bader charge analysis.51 All the above spin polarization density functional theory (DFT) calculations were carried out using the plane-wave code of Vienna ab initio simulation package (VASP).52,53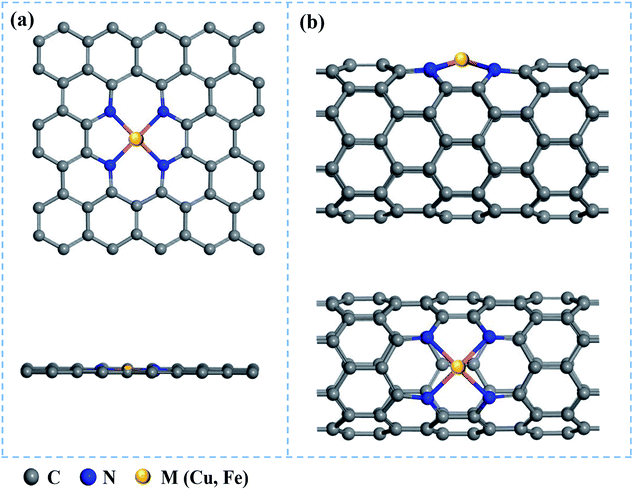 | ||
| Fig. 1 Top and main views of nanostructures (a) M@N-Gr and (b) M@N-CNT (M = Cu & Fe), where gray, blue, and yellow balls represent the C, N, and metal (Cu or Fe) atoms, respectively. | ||
3 Results and discussion
3.1 Electronic structure and stability of M@N-Gr and M@N-CNT (M = Cu & Fe)
The optimized Cu–N bond length of Cu@N-Gr is 1.93 Å (see Fig. S1†), which is in good agreement with the experimental value (1.94 Å) measured by the EXAFS.43 Due to the existence of curvature in CNT, the Cu–N bond length of Cu@N-CNT extends to about 2.02 Å. The calculated Fe–N bond length of Fe@N-Gr (1.89 Å) is in good agreement with the previously reported value (1.89 Å),19 while the Fe–N bond length of Fe@N-CNT increases to 1.95 Å. The projected density of states (PDOS) of Cu@N-Gr, Cu@N-CNT, Fe@N-Gr and Fe@N-CNT (Fig. S1†) show considerable overlap between the Cu/Fe(3d) and N(2p) orbital levels in both nanostructures, suggesting strong bonding interactions between Cu/Fe atom and adjacent pyridine–N atoms. It is well known that the inherent electronic structure of SACs determines their catalytic properties, in which the d-band center (εd) has been widely used to describe the surface activity.36,54–57 From Cu@N-Gr to Cu@N-CNT, the εd of Cu rises by about 0.55 eV (see Fig. S1†), indicating that Cu@N-CNT may has a single-atom-Cu site with higher activity, compared to Cu@N-Gr. As for Fe@N-Gr and Fe@N-CNT, the εd of Fe is less changed, and both d-band centers are higher than the εd of Cu in Cu@N-Gr and Cu@N-CNT.Fig. 2a shows the differential charge density of Cu@N-Gr, Cu@N-CNT, Fe@N-Gr and Fe@N-CNT, where yellow and blue regions denote increase and decrease of electron density, respectively. As Fig. 2 shows, for all nanostructures, the charge density around the Cu and Fe atoms decreases, while the charge density on the pyridine N increases, suggesting that the electron is transferred from the central Cu/Fe to the adjacent N atoms. The Bader charge analyses reveal that there are charge transfers of 0.93e− and 0.88e− from the Cu atom in Cu@N-Gr and Cu@N-CNT to its surrounding atoms, respectively, indicating that the Cu atom is positively charged (about +1), which is consistent with the experimentally measured valence state of the Cu atom.42 And the charges transferred by the Fe atom in Fe@N-Gr and Fe@N-CNT are 1.12e− and 1.09e−, respectively, more notable than those by the Cu atom. From the electron spin densities in Fig. 2b, it can be seen that the net spins are mainly localized on the metal (Cu & Fe) and N atoms. Obviously, these charge and spin populations indicate that both single metal atoms Cu and Fe have strong bonding interactions with the N-doping graphene and carbon nanotube, and the atomically dispersed Cu and Fe may be served as the active site in catalysis.
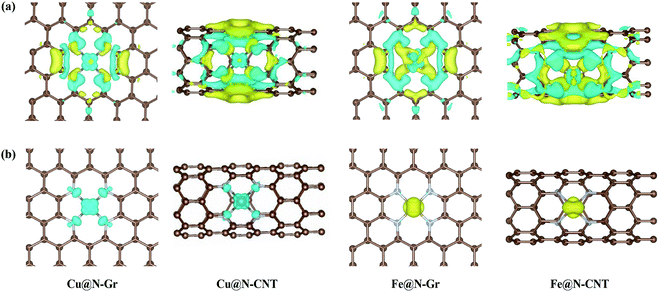 | ||
| Fig. 2 (a) The differential charge density (yellow and blue represent the electron accumulation and depletion) and (b) electron spin densities of Cu@N-Gr, Cu@N-CNT, Fe@N-Gr and Fe@N-CNT. | ||
Stability is one of the essential factors to evaluate the SAC performance. Herein, taking Cu@N-Gr and Fe@N-Gr as examples, the phonon spectra were calculated to confirm the dynamic stability of Cu/Fe nanostructures. As shown in Fig. S2,† none of Cu@N-Gr and Fe@N-Gr have imgainary phonon branch, indicating that both nanostructures are dynamically stable. Besides, the predicted binding energies (Eb) of Cu@N-Gr, Cu@N-CNT, Fe@N-Gr and Fe@N-CNT are −1.2, −0.4, −2.2 and −1.1 eV, respectively, i.e., both Cu and Fe embedding into the substrates are thermodynamically favorable, suggesting that Cu@N-Gr, Cu@N-CNT, Fe@N-Gr and Fe@N-CNT have relatively high thermodynamic stability.
3.2 CO2ER on M@N-Gr and M@N-CNT (M = Cu & Fe)
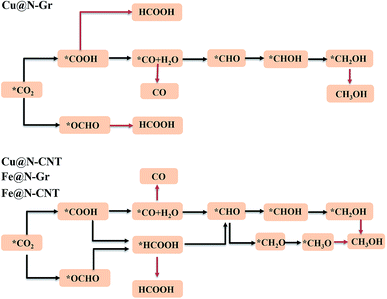
The electrochemical reduction reaction of CO2 catalyzed by Cu@N-Gr, Cu@N-CNT, Fe@N-Gr, and Fe@N-CNT has been explored by the first-principles calculations here. Based on the optimized stable intermediate configurations, we proposed two possible reaction pathways for four nanostructures (Fig. 3). First of all, the initial step of the CO2ER process—CO2 adsorption was explored. As shown in Fig. S3,† the adsorption of CO2 on Cu@N-Gr and Cu@N-CNT has a physisorbed linear configuration, in which the distances between Cu and CO2 in both adsorption configurations are slightly larger than 3 Å, which is similar to the situation on the Cu (111) surface.58 Similarly, the adsorption of CO2 on Fe@N-Gr is also physical adsorption, and the distance between CO2 and Fe is 3.4 Å. On the contrary, the CO2 adsorption on Fe@N-CNT shows a chemisorbed configuration with the Fe–CO2 bond length of 2.27 Å and the ∠OCO bond angle of 158°.Fig. 4 depicts the correlation relationship between the free energy changes (ΔG) for the formation of *COOH/*OCHO and *H at the Cu/Fe site, where the smaller the ΔG, the more favorable the process. As the results in Fig. 4 show, both Cu@N-Gr and Cu@N-CNT have higher selectivity towards CO2ER in both vacuum or aqueous solution, compared to HER, and the formation of *OCHO intermediate (CO2 + H+ + e− → *OCHO) should be dominant in the initial protonation. Similarly, both Fe@N-Gr and Fe@N-CNT have higher selectivity toward CO2ER than HER in aqueous solution, and the free energy changes in the initial protonation to form *OCHO and *COOH intermediates are very close. In addition, the solvation effect on the relative energies of the intermediates (*COOH/*OCHO) was also studied. As shown in Table S3,† the solvation energies (ΔEsol) of *COOH are −0.15 eV for Cu@N-Gr and −0.17 eV for Cu@N-CNT, respectively, while the corresponding ΔEsol values of *OCHO are −0.28 and −0.33 eV, indicating that there is relatively stronger solvent effect on the *OCHO intermediate for Cu@N-Gr and Cu@N-CNT, compared to *COOH. For Fe@N-Gr and Fe@N-CNT, the effects of solvation on the intermediates *COOH and *OCHO are similar, and the corresponding ΔEsol values varies from −0.08 to −0.15 eV. Accordingly, the solvent effect in CO2ER cannot be ignored. In the following discussion, the free energy changes involved are all solvent-based.
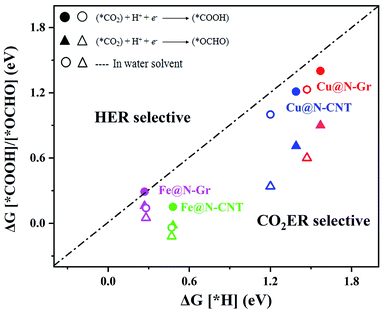 | ||
| Fig. 4 Comparison of the free energy changes (ΔG) for the first hydrogenation to *COOH or *OCHO in CO2ER and *H in HER in vacuum and water solvent. | ||
As shown in Fig. S4,† the PDOS and differential charge density of COOH/OCHO-adsorbed on Cu@N-Gr and Cu@N-CNT indicate that there are relatively strong orbital interactions of C/O(p) of *COOH/*OCHO with Cu(d) of Cu@N-Gr and Cu@N-CNT. Compared with the *COOH species, there are stronger charge-transfer interactions between *OCHO and Cu@N-Gr or Cu@N-CNT, and the formation of *OCHO is more favorable thermodynamically, as shown in Fig. S4 and S5.†
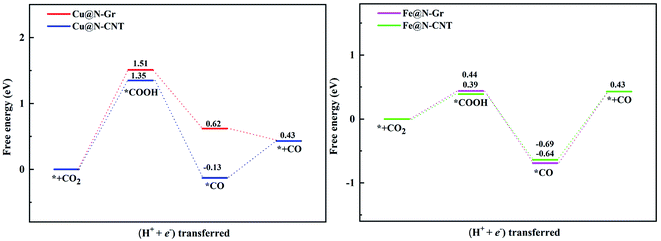
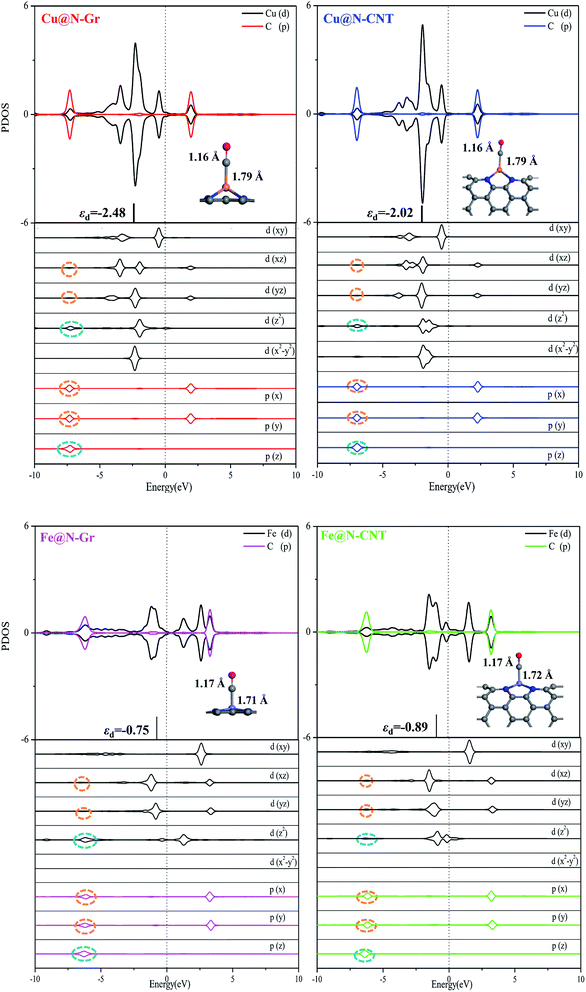
Followed by the proton-electron transfer to the *COOH species, the *CO is formed with the release of H2O. As Fig. 5 shows, the adsorbed state of *CO on the Fe-embedded nanostructure is much more stable than that on the Cu-embedded nanostructure, and its desorption is difficult accordingly. Here the *CO on Cu@N-Gr, Cu@N-CNT, Fe@N-Gr, and Fe@N-CNT generally has a vertical adsorption configuration through Cu/Fe–CO bonding interactions, as observed in previous studies,60,61 where the C–O bond length on the Cu- and Fe-embedded nanostructures slightly increases to 1.16 and 1.17 Å, respectively, compared to the free CO (1.15 Å), indicating that the CO bond is weakened to some extent. We note that 5σ and 2π* orbitals of CO are mainly contributed by pz and px/py of the C atom (Fig. S6†), respectively, and there are similar bonding interactions for the chemisorption of CO on all nanostructures, as shown in Fig. 6. The σ bonding interaction between C(pz) and Cu/Fe(dz2) and the weak back-donation bonding interaction between C(px/py) and Cu(dxz/dyz) account for the CO chemisorption on nanostructures. Although the bonding mechanism is similar for both systems, the Cu–CO (1.79 Å) and Fe–CO (1.72 Å) bonds have different strengths. The εd of Fe in Fe nanostructures is closer to the Fermi level than the d-band center of Cu, as shown in Fig. 6 and S1,† and thus there are stronger bonding interactions between Fe and CO, compared to *CO on Cu@N-Gr and Cu@N-CNT, resulting in stronger CO adsorption on Fe nanostructures with the binding free energies of −0.64 eV for Fe@N-CNT and −0.69 eV for Fe@N-Gr than that on Cu nanostructures with the binding free energies of −0.13 eV for Cu@N-CNT and 0.62 eV for Cu@N-Gr. Linear correlation between the *CO binding energy (Eb) and εd of the metal atom is shown in Fig. S7.† The present results show that the CO adsorption on the Cu/Fe-embedded nanostructures is enhanced with the increase of εd.
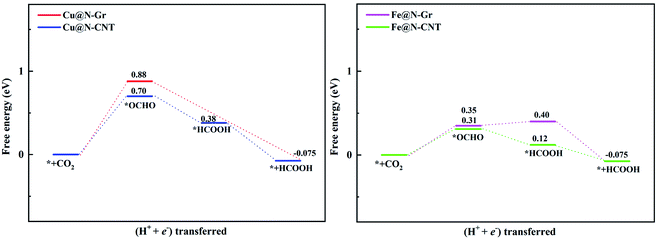
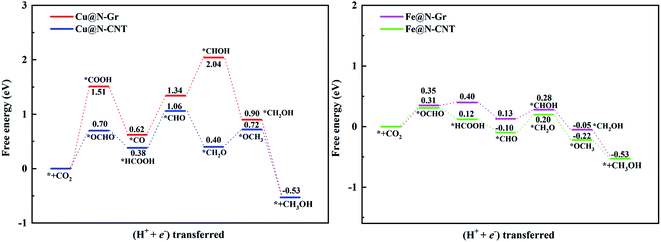
For the electrochemical reduction of CO2 to CH3OH on Cu@N-CNT, there are several plausible routes to CH3OH, as depicted in Fig. S8.† The pathway starting from the key intermediate *CO is the same as that on Cu@N-Gr, but the strong binding of *CO on Cu@N-CNT makes its initial hydrogenation, i.e., CO + H+ + e− → *CHO/*COH, requires relatively high free energies (see Fig. S8†), and thus the intermediate *CO may tend toward desorption to CO, compared to the initial hydrogenation through one electron reduction (see Fig. 5). We note that another pathway to generate CH3OH through intermediates *OCHO and *HCOOH on Cu@N-CNT is much favorable thermodynamically, as shown in Fig. S8† and Fig. 8. The formation of *CHO through the intermediate *HCOOH is much easier than that through the *CO species. Accordingly, the low-energy route for CO2ER to CH3OH on Cu@N-CNT, i.e., CO2 → *OCHO → *HCOOH → *CHO → *CH2O → *OCH3 → CH3OH, is different from that on Cu@N-Gr, as shown in Fig. 8. Clearly, the curvature of Cu@N-CNT can promote its catalytic activity and adjust the CO2ER selectivity. The optimized structures of reaction intermediates involved in CO2ER to CH3OH are shown in Fig. S9.†
Similar to CH3OH production on Cu@N-CNT, the *HCOOH intermediate on Fe@N-CNT and Fe@N-Gr has also been located, and their low-energy pathways to form CH3OH are: CO2 → *OCHO → *HCOOH → *CHO → *CHOH → *CH2OH → CH3OH for Fe@N-Gr and CO2 → *OCHO → *HCOOH → *CHO → *CH2O → *OCH3 → CH3OH for Fe@N-CNT. Here the limiting energy step for CO2ER to CH3OH on Fe nanostructures is different from that on Cu@N-CNT, and the corresponding ΔG of the limiting energy step is also smaller (Fig. 8). Such discrepancies in the low-energy mechanism for CO2ER to CH3OH on Cu@N-Gr, Cu@N-CNT, Fe@N-Gr and Fe@N-CNT can be mainly ascribed to the formation of key intermediate *HCOOH, and the presence of the stable *HCOOH on Cu@N-CNT, Fe@N-Gr and Fe@N-CNT provides a new channel to CH3OH, instead of *CO as the initial precursor for Cu@N-Gr.
As shown in Fig. S9,† the O–Cu and O–Fe distances of *HCOOH adsorbed on Cu@N-CNT, Fe@N-Gr and Fe@N-CNT are 2.28, 2.32, and 2.12 Å, respectively. The corresponding adsorption energies (Eads) are −0.38, −0.50, and −0.60 eV, indicating the relatively strong interactions between HCOOH and Cu@N-CNT, Fe@N-Gr and Fe@N-CNT, which are beneficial to the following catalytic reaction to yield CH3OH. Taking the *HCOOH intermediate on Cu@N-CNT as an example, the predicted differential charge density and PDOS of *HCOOH on Cu@N-CNT in Fig. S10† also reveal that the O atom of HCOOH and the Cu center have relatively strong bonding interactions, differing from the situation of Cu@N-Gr without the curvature.
3.3 The limiting potential
The limiting potentials (UL) of generating CO, HCOOH, and CH3OH on Cu@N-CNT and Cu@N-Gr in water solution are shown in Fig. S11,† and the corresponding rate-limiting steps and UL values are compiled into Table 1. Here the required limiting potentials to produce HCOOH and CH3OH on Cu/Fe nanostructures are generally lower than that for the CO product (except for CH3OH on Cu@N-Gr), and this is because the initial protonation is more conducive to the formation of *OCHO. For Cu@N-Gr, the production of CO and CH3OH possess the same limiting potential of −1.51 V, and corresponding rate-limiting step is CO2 + H+ + e−→ *COOH. For Cu@N-CNT, the UL values of CO, HCOOH and CH3OH are significantly lower than that of Cu@N-Gr. As Table 1 shows, the limiting potential difference for the same product on Cu@N-Gr and Cu@N-CNT is: CO ≈ HCOOH < CH3OH, suggesting that the curvature of Cu@N-CNT may improve the catalytic performance of CO2ER, especially for the selectivity of CH3OH.| Products | CO | HCOOH | CH3OH | |||
|---|---|---|---|---|---|---|
| RLS | UL | RLS | UL | RLS | UL | |
| Cu@N-Gr | CO2 + H+ + e− → *COOH | −1.51 | CO2 + H+ + e− → *OCHO | −0.88 | CO2 + H+ + e− → *COOH | −1.51 |
| Cu@N-CNT | CO2 + H+ + e− → *COOH | −1.35 | CO2 + H+ + e− → *OCHO | −0.70 | CO2 + H+ + e− → *OCHO | −0.70 |
| Fe@N-Gr | *CO → * + CO | −1.02 | CO2 + H+ + e− → *OCHO | −0.35 | CO2 + H+ + e− → *OCHO | −0.35 |
| Fe@N-CNT | *CO → * + CO | −1.07 | CO2 + H+ + e− → *OCHO | −0.31 | CO2 + H+ + e− → *OCHO | −0.31 |
For Fe@N-Gr and Fe@N-CNT, the UL values of CO, HCOOH and CH3OH are smaller than those on Cu nanostructures, the corresponding limit potential differences (Fe@N-Gr vs. Fe@N-CNT) are generally small, indicating that the curvature effect is less remarkable for Fe nanoparticles in comparison with the corresponding Cu-embedded N-doped carbon materials. We note that the UL values of CO on Cu@N-CNT, Fe@N-Gr, and Fe@N-CNT are larger than those of CH3OH, suggesting relatively high selectivity toward CH3OH, compared to Cu@N-Gr.
4 Conclusions
In summary, we have systematically investigated the catalytic activity and possible CO2ER pathways on the single Cu/Fe embedded N-doped graphene and carbon nanotube by means of first-principles calculations. Here the atomically dispersed metal catalysts of Cu@N-Gr, Cu@N-CNT, Fe@N-Gr and Fe@N-CNT are predicted to be stable, both thermodynamically and dynamically, and they exhibit higher selectivity toward CO2ER, compared to HER. Our calculations indicate that different initial hydrogenation steps account for CO2ER to CO, HCOOH, and CH3OH, respectively. The main reaction pathway for CO2ER to CO on Cu@N-Gr, Cu@N-CNT, Fe@N-Gr and Fe@N-CNT is composed of the consecutive hydrogenations, i.e., CO2 → *COOH → *CO → CO, where the energy limiting step is formation of the key intermediate *COOH for Cu@N-Gr, Cu@N-CNT and the desorption of CO for Fe@N-Gr and Fe@N-CNT. The *OCHO intermediate from the initial protonation and one electron reduction is responsible for the HCOOH product. The intermediates *COOH and *OCHO are the precursors to CH3OH on Cu@N-Gr and Cu@N-CNT and Fe nanostructures, respectively. The predicted limiting potentials for the formation of CO, HCOOH, and CH3OH reveal that Cu@N-CNT, Fe@N-Gr and Fe@N-CNT generally have higher activity towards CO2ER than Cu@N-Gr. For CO2ER to CO, HCOOH, and CH3OH on these single metal-atom embedded catalysts, Cu@N-Gr has higher selectivity to HCOOH, while Cu@N-CNT, Fe@N-Gr, and Fe@N-CNT have higher selectivity to both HCOOH and CH3OH. The present results show that the curvature of the N-doped carbon materials notably elevate the d-band center of single Cu atom and promote the catalytic performance of CO2ER, especially for the selectivity of CH3OH. On the contrary, the curvature has less influence on the εd of Fe, and the activity of the atomically dispersed Fe catalysts is changed indistinctively. As a consequence, the d-band center of metal atoms can be modified by the curvature of catalyst supports, but its exerting influence depends on the electronic structure of embedded single metal atoms.Conflicts of interest
There are no conflicts to declare.Acknowledgements
This work is supported by the National Science Foundation of China (21873078, 21673185, and 21933009).References
- R. Barker, Y. Hua and A. Neville, Int. Mater. Rev., 2017, 62, 1–31 CrossRef CAS.
- M. Halmann, Nature, 1978, 275, 115–116 CrossRef CAS.
- T. Yan, L. Wang, Y. Liang, M. Makaremi, T. E. Wood, Y. Dai, B. Huang, A. A. Jelle, Y. Dong and G. A. Ozin, Nat. Commun., 2019, 10, 1–10 CrossRef.
- X. Duan, J. Xu, Z. Wei, J. Ma, S. Guo, S. Wang, H. Liu and S. Dou, Adv. Mater., 2017, 29, 1701784 CrossRef.
- J. Qiao, b. Y. Liu, F. Hong and J. Zhang, Chem. Soc. Rev., 2014, 43, 631–675 RSC.
- L. Wang, W. Chen, D. Zhang, Y. Du, R. Amal, S. Qiao, J. Wu and Z. Yin, Chem. Soc. Rev., 2019, 48, 5310–5349 RSC.
- Y. S. Bae and R. Q. Snurr, Angew. Chem., Int. Ed. Engl., 2011, 50, 11586–11596 CrossRef CAS.
- J. Low, B. Cheng and J. Yu, Appl. Surf. Sci., 2017, 392, 658–686 CrossRef CAS.
- F. Hussin and M. K. Aroua, AIP Conf. Proc., 2019, 2124, 030017 CrossRef.
- P. Sebastián-Pascual, S. Mezzavilla, I. E. L. Stephens and M. Escudero-Escribano, ChemCatChem, 2019, 11, 3626–3645 CrossRef.
- X. Zhu and Y. Li, Wiley Interdiscip. Rev.: Comput. Mol. Sci., 2019, 9, e1416 CAS.
- A. A. Peterson and J. K. Nørskov, J. Phys. Chem. Lett., 2012, 3, 251–258 CrossRef CAS.
- M. Fields, X. Hong, J. K. Nørskov and K. Chan, J. Phys. Chem. C, 2018, 122, 16209–16215 CrossRef CAS.
- A. Bagger, W. Ju, A. S. Varela, P. Strasser and J. Rossmeisl, ACS Catal., 2019, 9, 7894–7899 CrossRef CAS.
- D. Ferrah, A. R. Haines, R. P. Galhenage, J. P. Bruce, A. D. Babore, A. Hunt, I. Waluyo and J. C. Hemminger, ACS Catal., 2019, 9, 6783–6802 CrossRef CAS.
- S. Kikkawa, K. Teramura, H. Asakura, S. Hosokawa and T. Tanaka, J. Phys. Chem. C, 2019, 123, 23446–23454 CrossRef CAS.
- E. Lam, J. J. Corral-Pérez, K. Larmier, G. Noh, P. Wolf, A. Comas-Vives, A. Urakawa and C. Copéret, Angew. Chem., Int. Ed. Engl., 2019, 131, 14127–14134 CrossRef.
- S. Back and Y. Jung, ACS Energy Lett., 2017, 2, 969–975 CrossRef CAS.
- H. Zhang, J. Li, S. Xi, Y. Du, X. Hai, J. Wang, H. Xu, G. Wu, J. Zhang and J. Lu, et al., Angew. Chem., Int. Ed. Engl., 2019, 131, 15013–15018 CrossRef.
- Y. Chen, S. Ji, C. Chen, Q. Peng, D. Wang and Y. Li, Joule, 2018, 2, 1242–1264 CrossRef CAS.
- X. Yang, A. Wang, B. Qiao, J. Li, J. Liu and T. Zhang, Acc. Chem. Res., 2013, 46, 1740–1748 CrossRef CAS.
- B. Qiao, A. Wang, X. Yang, L. F. Allard, Z. Jiang, Y. Cui, J. Liu, J. Li and T. Zhang, Nat. Chem., 2011, 3, 634–641 CrossRef CAS.
- F. Pan, B. Li, E. Sarnello, S. Hwang, Y. Gang, X. Feng, X. Xiang, N. M. Adli, T. Li and D. Su, et al., Nano Energy, 2020, 68, 104384 CrossRef CAS.
- X. Liu, Y. Jiao, Y. Zheng, M. Jaroniec and S. Z. Qiao, J. Am. Chem. Soc., 2019, 141, 9664–9672 CrossRef CAS.
- X. X. Wang, S. Hwang, Y. T. Pan, K. Chen, Y. He, S. Karakalos, H. Zhang, J. S. Su, D. Spendelow and G. Wu, Nano Lett., 2018, 18, 4163–4171 CrossRef CAS.
- M. D. Hossain, Z. Liu, M. Zhuang, X. Yan, G. L. Xu, C. A. Gadre, A. Tyagi, I. H. Abidi, C. J. Sun and H. Wong, et al., Adv. Energy Mater., 2019, 9, 1803689 CrossRef.
- K. Ithisuphalap, H. Zhang, L. Guo, Q. Yang, H. Yang and G. Wu, Small Methods, 2019, 3, 1800352 CrossRef.
- J. Zhao, J. Zhao, F. Li and Z. Chen, J. Phys. Chem. C, 2018, 122, 19712–19721 CrossRef CAS.
- Y. Ouyang, L. Shi, X. Bai, Q. Li and J. Wang, Chem. Sci., 2020, 11, 1807–1813 RSC.
- G. L. Chai and Z. X. Guo, Chem. Sci., 2016, 7, 1268–1275 RSC.
- S. Back, J. Lim, N. Y. Kim, Y. H. Kim and Y. Jung, Chem. Sci., 2017, 8, 1090–1096 RSC.
- Z. Zhang, J. Xiao, X. J. Chen, S. Yu, L. Yu, R. Si, Y. Wang, S. Wang, X. Meng and Y. Wang, et al., Angew. Chem., Int. Ed. Engl., 2018, 57, 16339–16342 CrossRef CAS.
- Y. Li, H. Su, S. H. Chan and Q. Sun, ACS Catal., 2015, 5, 6658–6664 CrossRef CAS.
- Z. Wang, J. Zhao and Q. Cai, Phys. Chem. Chem. Phys., 2017, 19, 23113–23121 RSC.
- Y. Jiao, Y. Zheng, P. Chen, M. Jaroniec and S. Z. Qiao, J. Am. Chem. Soc., 2017, 139, 18093–18100 CrossRef CAS.
- H. Zhou, X. Zou, X. Wu, X. Yang and J. Li, J. Phys. Chem. Lett., 2019, 10, 6551–6557 CrossRef CAS.
- G. Zhu, Y. Li, H. Zhu, H. Su, S. H. Chan and Q. Sun, ACS Catal., 2016, 6, 6294–6301 CrossRef CAS.
- X. Zhang, Z. Wu, X. Zhang, L. Li, Y. Li, H. Xu, X. Li, X. Yu, Z. Zhang and Y. Liang, et al., Nat. Commun., 2017, 8, 1–8 CrossRef.
- Q. Fan, P. Hou, C. Choi, T. S. Wu, S. Hong, F. Li, Y. L. Soo, P. Kang, Y. Jung and Z. Sun, Adv. Energy Mater., 2020, 10, 1903068 CrossRef CAS.
- Q. Wu, W. Wei, X. Lv, Y. Wang, B. Huang and Y. Dai, J. Phys. Chem. C, 2019, 123, 31043–31049 CrossRef CAS.
- Y. Ni, L. Miao, J. Wang, J. Liu, M. Yuan and J. Chen, Phys. Chem. Chem. Phys., 2020, 22, 1181–1186 RSC.
- Z. Jiang, W. Sun, H. Shang, W. Chen, T. Sun, H. Li, J. Dong, J. Zhou, Z. Li and Y. Wang, et al., Energy Environ. Sci., 2019, 12, 3508–3514 RSC.
- H. Yang, Y. Wu, G. Li, Q. Lin, Q. Hu, Q. Zhang, J. Liu and C. He, J. Am. Chem. Soc., 2019, 141, 12717–12723 CrossRef CAS.
- P. Prabhu, V. Jose and J. M. Lee, Adv. Funct. Mater., 2020, 30, 1910768 CrossRef CAS.
- K. Fan, Y. Jia, Y. Ji, P. Kuang, B. Zhu, X. Liu and J. Yu, ACS Catal., 2019, 10, 358–364 CrossRef.
- J. K. Nørskov, J. Rossmeisl, A. Logadottir, L. Lindqvist, J. R. Kitchin, T. Bligaard and H. Jónsson, J. Phys. Chem. B, 2004, 108, 17886–17892 CrossRef.
- Y. Feng, W. An, Z. Wang, Y. Wang, Y. Men and Y. Du, ACS Sustainable Chem. Eng., 2019, 8, 210–222 CrossRef.
- J. P. Perdew, K. Burke and M. Ernzerhof, Phys. Rev. Lett., 1996, 77, 3865 CrossRef CAS.
- S. Grimme, J. Antony, S. Ehrlich and H. Krieg, J. Chem. Phys., 2010, 132, 154104 CrossRef.
- K. Mathew, V. S. C. Kolluru, S. Mula, S. N. Steinmann and R. G. Hennig, J. Chem. Phys., 2019, 151, 234101 CrossRef.
- G. Henkelman, A. Arnaldsson and H. Jónsson, Comput. Mater. Sci., 2006, 36, 354–360 CrossRef.
- G. Kresse and J. Hafner, Phys. Rev. B: Condens. Matter Mater. Phys., 1993, 47, 558–561 CrossRef CAS.
- G. Kresse and J. Furthmüller, Phys. Rev. B: Condens. Matter Mater. Phys., 1996, 54, 11169–11186 CrossRef CAS.
- B. Hammer and J. K. Nørskov, Adv. Catal., 2000, 45, 71–129 CAS.
- A. A. Peterson and J. K. Nørskov, J. Phys. Chem. Lett., 2012, 3, 251–258 CrossRef CAS.
- G. Zhu, Y. Li, H. Zhu, H. Su, S. H. Chan and Q. Sun, ACS Catal., 2016, 6, 6294–6301 CrossRef CAS.
- M. Mavrikakis, B. Hammer and J. K. Nørskov, Phys. Rev. Lett., 1998, 81, 2819–2822 CrossRef.
- M. Favaro, H. Xiao, T. Cheng, W. A. Goddard III, J. Yano and E. J. Crumlin, Proc. Natl. Acad. Sci. U. S. A., 2017, 114, 6706–6711 CAS.
- D. Voiry, H. S. Shin, K. P. Loh and M. Chhowalla, Nat. Rev. Chem., 2018, 2, 0105 CrossRef CAS.
- S. S. Sung and R. Hoffmann, J. Am. Chem. Soc., 1985, 107, 578–584 CrossRef CAS.
- H. Zhong, L. Wen, J. Li, J. Xu, M. Hu and Z. Yang, Powder Technol., 2016, 303, 100–108 CrossRef CAS.
Footnote |
| † Electronic supplementary information (ESI) available. See DOI: 10.1039/d0ra08857a |
| This journal is © The Royal Society of Chemistry 2020 |


