 Open Access Article
Extensive removal of thallium by graphene oxide functionalized with aza-crown ether†
Shu-Xin Pan ab,
Ting-Zheng Xie
 *ac,
Tang-Fu Xiao*ab and
Jie-Hui Xieac
aKey Laboratory for Water Quality and Conservation of the Pearl River Delta, Ministry of Education, Guangzhou University, Guangzhou 510006, China. E-mail: xietingzheng@gzhu.edu.cn; tfxiao@gzhu.edu.cn
bSchool of Environmental Science and Engineering, Guangzhou University, Guangzhou 510006, China
cInstitute of Environmental Research at Greater Bay, Guangzhou University, Guangzhou 510006, China
First published on 17th December 2020
Abstract
Thallium (Tl) is a highly toxic heavy metal, and its pollution and remediation in aquatic environments has attracted considerable attention. To reduce or remove Tl pollution in the environment, various strategies have been applied. Graphene oxide (GO) has abundant oxygen-containing functional groups, indicating its high application potential for pollution remediation via methods involving binding to metal ions or positively charged organic molecules or electrostatic interaction and coordination. However, the adsorption of Tl to GO occurs via physical adsorption, for which the adsorption efficiency is low. Therefore, herein, we report a new method to effectively remove Tl pollution in water. We combined GO with aza-crown ether, which enhanced the electronegativity and ability to bind metal ions. The functionalized graphene oxide (FGO) demonstrated high efficiency through a wide pH gradient of 5–10, with a dominant Tl(I) adsorption capacity (112.21 mg g−1) based on the Langmuir model (pH 9.0, adsorbent concentration of 0.8 g L−1). The adsorption of Tl(I) during removal fit a pseudo-second-order kinetic model well. The mechanisms of Tl removal involve physical and chemical adsorption. In summary, our study provides a new method for the detection and treatment of Tl-containing wastewater by using FGO.
1. Introduction
Thallium (Tl) is one of the 13 priority metal pollutants,1 with an average upper continental crust abundance of 0.75 mg kg−1.2 As Tl is an element associated with various metal sulfide ores and coal, Tl pollution may come from emissions and solid waste from various smelting and mining activities.3,4 In the aquatic environment, there are two main states of Tl, Tl(I) and Tl(III). Tl(I) accounts for the majority of Tl, while Tl(III) exists in only strongly oxidizing or strongly acidic conditions.5–8 Moreover, the toxicity of Tl(III) is much higher than that of Tl(I).9,10 The US EPA regulates that the Tl content in drinking water must be less than 2 μg L−1.11 Many methods for Tl removal from wastewater, such as chemical oxidation coprecipitation,12 ion exchange,13,14 extraction,15 enhanced filtration16 and adsorption, have been proven to be effective. However, the above mentioned approaches may also have certain disadvantages, such as incomplete removal, low selectivity, high costs or the production of large amounts of toxic byproducts.17 Among these methods, adsorption is the most popular method due to its simple procedure, fast reaction speed, low cost and high efficiency. Therefore, it is critical to select suitable adsorption materials. To date, researchers have performed meaningful work in this area, including the development of efficient, stable and renewable adsorbents. Many Tl(I) adsorbents have been reported and have mainly been composed of carbon nanotubes, NiFe2O4@C, and MnO2. However, these nanomaterials still have some shortcomings; for instance, Tl(I) must be oxidized to Tl(III) for suitable adsorption efficiency.Coordination compounds are traditionally defined as compounds formed by ions or molecules that can provide lone pair electrons or multiple nonlocal electrons through a certain space configuration with atoms or ions containing empty orbitals. At present, researchers have focused on ligand materials suitable for Tl because Tl removal is an area of concern.18 Due to the inherent two-dimensional characteristics of the hexagonal carbon network19 of graphene oxide (GO), large-specific-surface-area materials with strong affinity for charged chemicals are formed from GO. Three σ bonds are formed through sp2 hybridization of the electron orbitals of carbon atoms, while π bonds are formed with Pz orbitals that are not involved in the hybridization and are parallel to the graphene layer. GO has excellent electrical, mechanical, optical, and thermal properties and good dispersion in water due to its characteristic structure.20 Recently, it has become popular as an application material due to its excellent high charge transfer and high stability. However, because of the low reactivity of GO, heavy metals physically adsorb to GO, and the adsorption efficiency is low, which limits the practical application of graphene as an adsorption material. The most widely used method for GO functionalization involves a ring opening reaction with nucleophiles containing oxygen or nitrogen.21 Because macrocyclic ligands can form complexes with different metal ions or anions, it is widely used in catalysis, metal separation, molecular recognition, sensors and other applications.22–25 Among the various functionalities, crown ethers have a strong nucleophilic structure and rigidity that result in an affinity for alkali and alkaline earth metal ions, and aza-crown ethers have a highly nucleophilic structure and affinity for soft metal ions,26 where ligands can be customized for various metal cations. In this study, we functionalized GO with aza-crown ethers. FGO is prepared by nucleophilic attack. The amino group of the aza-crown ethers molecule react easily with the carbon ring on the surface of GO. New oxygen-rich properties27 and mechanical properties28 can be introduced into GO coordinated to aza-crown ethers. In particular, Valt et al. (2019) reported that FGO adsorbs Cr(III), Cu(II), Ni(II) well, but its ability to remove Tl is still unclear. Therefore, the synthesis of FGO with the ability to remove Tl from wastewater is significant in the search for new approaches to cleanup Tl-contaminated wastewater.
In this study, we used GO and aza-crown ether as raw materials to prepare FGO for Tl(I) removal from synthetic wastewater. The effects of pH, temperature and adsorbent dosage on the adsorption of Tl(I) were studied. The adsorption kinetics and adsorption isotherm models also investigated. The composition and surface structure of FGO and its mechanism of Tl(I) adsorption were characterized by SEM, TEM, FT-IR spectroscopy and XPS. In addition, quantum chemistry was applied to further understand the reaction mechanism. Density functional theory (DFT) calculations were performed with the Gaussian 09 suite of programs to calculate related parameters after the coordination reaction.
2. Materials and methods
2.1 Chemical reagents
Aza-18-crown ether-6 and GO were purchased from Aladdin Reagent Co., Ltd. (Shanghai, China). Tetrabutylammonium hydroxide (TBAOH) was obtained from SAAN Chemical Reagent Co., Ltd. (Shanghai, China), and NaOH and HNO3 were obtained from Sinopharm Chemical Reagent Co., Ltd. (Shanghai, China). A Tl(I) stock solution (1000 mg L−1) was prepared by dissolving TlNO3 (99.9%, Aldrich, USA) in deionized water. All chemicals and reagents were analytical grade and used as received from the suppliers, without further purification.2.2 Preparation of FGO
According to Fig. 1, 100 mg of GO powder was added to 10 mL of deionized water in a beaker, ultrasonicated for 30 min at room temperature, and stirred to obtain a clear homogeneous brown dispersion. Aza-18-crown ether-6 (50 mg) and TBAOH (10 mL) were added to the GO solution, and then add deionized water to 70 mL. In this reaction mechanism, TBAOH is a deprotonated nucleophile, which increases the nucleophilicity of GO and thus the rate of nucleophilic substitution.28 The mixture was transferred into a sealed Teflon autoclave (100 mL), reacted at 100 °C for 24 h and thermalized to room temperature. The reaction mixture was washed with deionized water, and after ultrasonic treatment, the solids were suspended on a nylon membrane (0.22 μm pore diameter) and filtered. Then, the solids were freeze-dried under vacuum to obtain FGO.292.3 Analytical methods
For the adsorption experiments, the solution with Tl(I) concentration (10 mg L−1) can be adsorbed by the adsorbent concentration (0.8 g L−1) that could generate a sufficient Tl signal during characterization. The concentration of Tl(I) was analyzed by an atomic absorption spectrometer (AAS, iCE 3000, Thermo Scientific, USA). Samples for solid-phase analysis were dried at −90 °C for 48 h in a vacuum freeze dryer, and sent for characterization with a Ziploc bag. FT-IR spectra were obtained with a Tensor27 system (Bruker, Germany) to identify chemical bonds. XPS spectra were obtained by X-ray photoelectron spectroscopy (XPS; Escalab 250xi, Thermo Fisher, UK), which can explain the composition of functional groups and molecular contents of the adsorbents. In all XPS spectra, the reference of binding energy was set to C 1s peak at 284.6 eV.30 The morphology of the GO and FGO were characterized by SEM (SU8220, Japan).31 TEM (JEOL-2010, Japan) combined with energy dispersive spectrometry (EDS, Oxford) was used to characterize the fine structure of the FGO before and after adsorption.322.4 Adsorption experiments
Batch adsorption experiments were carried out in a centrifugal tube at a speed of 250 rpm on a shaker with controllable temperature function. Added 0.08 g L−1 adsorbent into a 30 mL centrifugal tube with Tl(I) solution at 10 mg L−1, and then kept sufficient reaction for 30 min, the supernatant was filtered through a disposable syringe filter (0.22 μm). The reaction was controlled at room temperature. All experiments were repeated three times, and the results were reported as the mean of standard deviation. And the results were reported as the mean values with standard deviations. The Tl(I) adsorption capacity (qe) and Tl(I) removal rate (%) of FGO were obtained by eqn (1) and (2), respectively.33,34
 | (1) |
 | (2) |
During the experiments exploring factors potentially influencing Tl(I) removal, such as the reaction pH, reaction temperature and adsorbent concentration, ensured a single variable, others unchanged. In the isotherm experiment, we chosed an hour as reaction time, reaction pH of 9.0, and absorbed dose of 0.8 g L−1 to test the initial Tl(I) concentrations of different gradients. In the kinetic experiment, samples were gained after a series of reaction time (0, 2, 4, 6, 8, 10, 15, 30, 60, 30, 120, 240 min).
2.5 DFT study on adsorption
DFT calculations were carried out at the B3LYP level of theory by using Gaussian 09 calculation software.35 DFT is used frequently because of its higher accuracy and much shorter processing time than those of many other methods. In this experiment, the mixed basis set (M06/genecp) was used for the elements in the FGO, and the LanL2DZ basis set was used for Tl. According to the simulated configuration, the most likely optimized structure of FGO and Tl could be predicted (which means that the initial interaction position of the ligand material and Tl cation were taken into account in the process of geometric optimization) and the corresponding vibration frequency analysis. To comprehensively analyze the adsorption of FGO to Tl, the electrostatic potential diagram output by the Gaussian program can directly reveal the major adsorption position but cannot accurately show the main reaction site. Therefore, Multiwfn software was used for this purpose.Electrostatic potential has different definitions in different fields depending on the function of real space.36,37 The definition of the quantum system is as follows:
 | (3) |
The electrostatic potential of the molecule at r is equal to the electrostatic interaction energy produced from the unit positive charge when located at r (assuming that the appearance of the unit positive charge will not cause any effect other than the electrostatic interaction). The electrostatic potential consists of the contribution of the positive charge carried by the nucleus and the negative charge carried by the electron. If the electrostatic potential at r is positive, then the electrostatic potential is mainly controlled by the nucleus; if negative, then the contribution of electrons is dominant.38 Near the nucleus, including the valence layer region, the electrostatic potential is positive because the electrostatic potential is affected by the positive charge of the nucleus, while on the molecular surface, the contributions of the electrons and nucleus can compete with each other. The nonuniformity of the electron density distribution leads to positive and negative electrostatic potentials on the molecular surface.39,40
The adsorption energy refers to the adsorption of the target substance on the material surface, and the total energy in the system decrease upon adsorption. If the adsorption energy is negative, it is an exothermic reaction with an increase in entropy. As the numerical value becomes more negative, the formation of the complex becomes more stable and easier. The adsorption energy is defined as follows:
| Eads = Etotal − (Eadsorbate + Esurface) | (4) |
3. Results and discussion
3.1 Factors influencing Tl(I) removal
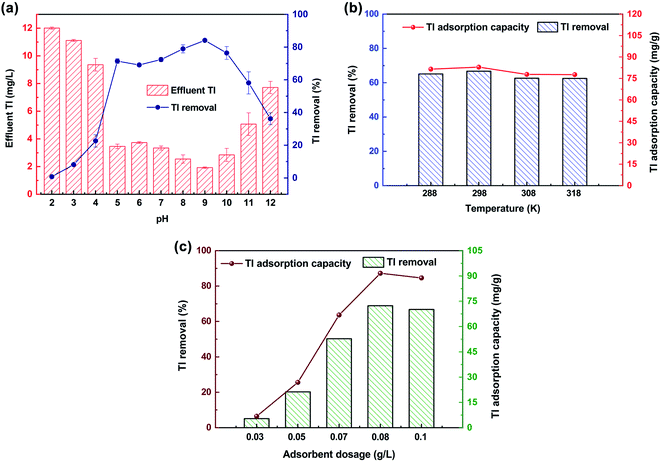
There was no obvious effect on the removal of Tl by GO, but after functionalization with aza-crown ether, FGO showed good adsorption characteristics. The pH value of the solution will affect the surface charge of the adsorbent and the form of heavy metal ions,41 therefore FGO can be an important factor for Tl(I) removal. When the pH increased from 2 to 9, the Tl(I) removal continuously and steadily increased from 0.2–85.88% (Fig. 2a). A higher adsorption capacity of Tl corresponded to higher pH in solution at this stage, which was probably due to the enhancement of the surface complexation capacity, resemble to the behaviour through the adsorption of Tl(I) by MnO2 or Fe3O4.42,43 Under acidic conditions, the lower the pH is, the easier it is to desorb Tl complexed to the surface of FGO and return it to solution. The concentration of Tl increased when the pH reached 10 because the competitive adsorption between the cations and Tl.44 High Tl(I) removal was achieved at a reaction temperature of 288–318 K, and no significant changes to the material were observed at these temperatures under the conditions studied (Fig. 2b). This shows that this method of removing Tl(I) with FGO has few limitations and high operability. The amount of adsorbent is a significant aspect of an adsorption method, if the dosage of adsorbent is too high, the cost is prohibitive and unreasonable, while if the concentration is too low, Tl(I) can not be removed effectively.45 The results show that the FGO concentration can greatly affect the Tl(I) removal rate (Fig. 2c). The adsorption efficiency of Tl(I) reached a stable level when the concentration of FGO was 0.8 g L−1. In conclusion, FGO is a very reliable adsorbent for Tl(I) removal, considering the cost and performance.3.2 Tl(I) removal kinetics
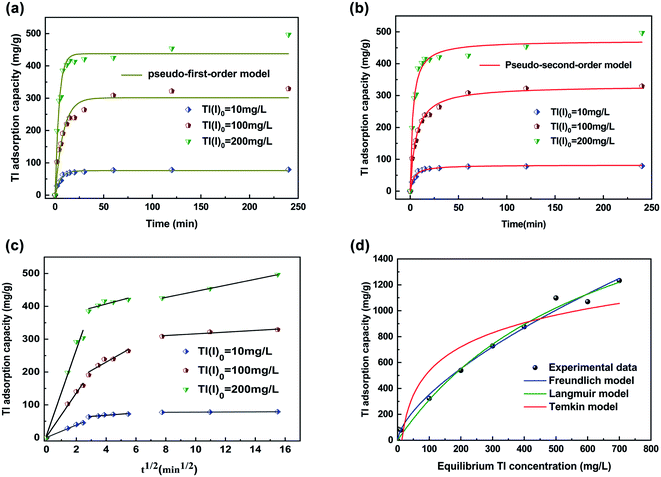
Adsorption kinetics is an important index to determine the Tl(I) removal rate of FGO.46 The removal of Tl(I) is rapid in the first 30 min, which is due to lots of binding sites available and the effect of concentration gradient force in the initial stage. As the reaction progresses, the number of binding sites and the concentration of adsorbate decrease gradually, reaching adsorption equilibrium.47 It took 30, 120 and 240 min to reach adsorption equilibrium for Tl(I)0 concentrations of 10, 100 and 200 mg L−1, respectively, which explained why a higher initial concentration of adsorbate resulted in a larger concentration gradient.48 The higher the concentration of Tl(I)0, the more binding sites that are required for adsorption, and more time it takes to achieve adsorption equilibrium. The pseudo-first-order and pseudo-second-order kinetic models are in close agreement with the Tl(I) removal process in this work (R2 value > 0.97) (Fig. 3a and b; Table S1†). However, the R2 values fitted by the pseudo-second-order kinetic model were higher than 0.98, and the calculated adsorption capacity is similar to the actual, so the adsorption of Tl(I) could be better described by this kinetic model. It shows that the adsorption of Tl(I) belongs to physical and chemical adsorption. The Weber Morris model (intragranular diffusion model) provides another perspective for evaluating the removal of Tl(I) and its rate determining steps (Fig. 3c).49 Adsorption usually involves three steps: membrane diffusion, intragranular diffusion and equilibrium adsorption.50 The core step to removing Tl(I) was film diffusion and intragranular diffusion, and the rates Kp1 and Kp2 were higher than Kp3 (Table S2†). It was obvious that the removal of Tl(I) was first achieved by a very fast outer membrane diffusion step and then proceeded via fast intraparticle diffusion, followed by a slow equilibrium adsorption step.3.3 Tl(I) removal isotherms
The adsorption isotherm model describes the adsorption properties and equilibrium data between adsorbent and adsorbed material in detail, and describes the interaction mechanism at constant temperature.51 The maximum adsorption capacity of FGO was 2368.59 mg g−1 when removing Tl(I) from solution (Fig. 3d; Table S3†). Among these models, the Langmuir model (0.991) had the highest R2 value, followed by the Freundlich (0.990) and Temkin (0.88) models. Therefore, the Langmuir equation was the best model to describe the adsorption process of FGO. The high value of the Freundlich constant (n = 1.5) indicated that the removal rate of Tl by FGO was fast. Therefore, the removal of Tl(I) by this FGO method involved chemical adsorption and physical adsorption.3.4 Tl(I) removal mechanisms
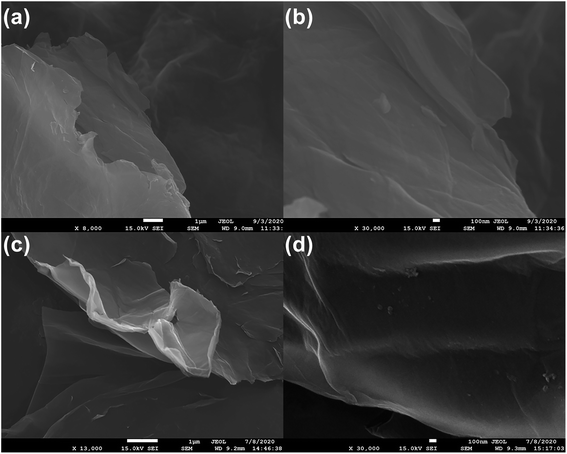
The SEM images revealed that the original GO was a thin sheet that was wrinkled with many folds, closely approximating the results of52 and reflecting the ultrathin characteristics of the GO film (Fig. 4a and b). The SEM images also revealed that the aza-crown particles were successfully fabricated on the GO surface (Fig. 4c and d), because the FGO sheets fold each other and had many ripples, which may be related to the newly added surface functional groups. It was reported that the presence of such particles on a GO film enhance the charge accumulation ability.53Pleated FGO flakes with particles can be observed in the TEM images (Fig. 5a). The particles can be inferred to be crown ether groups with sizes between 30 and 70 nm. The composition of the original sample (including C, O, N, Tl) was analyzed by EDS. It can be seen from Fig. 5b and c that the aza crown is successfully coordinated to GO because the GO sheet is rich in oxygen and nitrogen. It can be seen from Fig. 5i that FGO was saturated with Tl. Fig. 5j and k shows that before FGO adsorption, no Tl was present, but Fig. 5k indicates that after FGO adsorption, a large amount of Tl was present. It was proven that FGO had a good adsorption capacity for Tl.
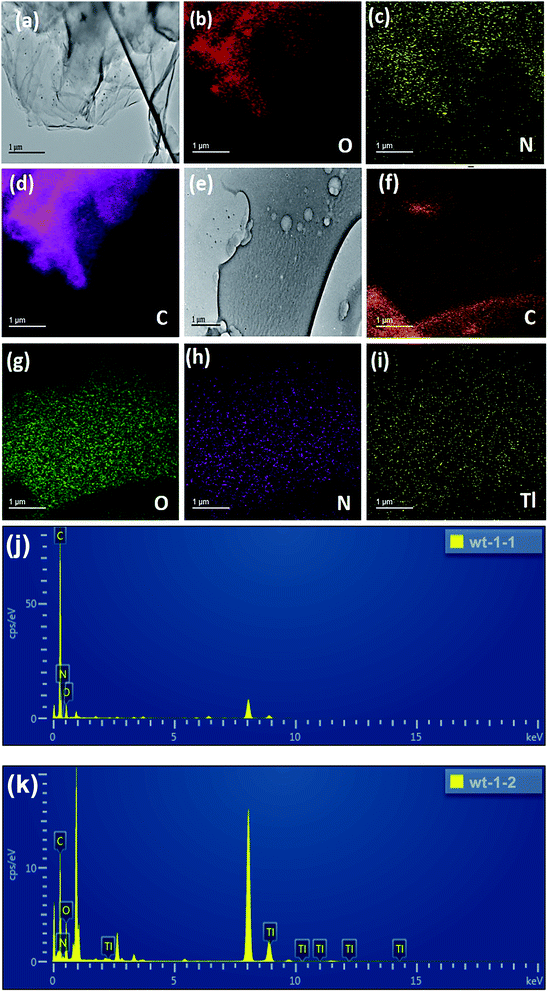 | ||
| Fig. 5 TEM characterization for particles formed on FGO: (a–d) before reaction, (e–i) after reaction with Tl(I), (j and k) EDS profile. | ||
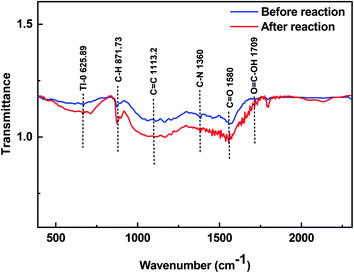
Fig. 6 shows the FT-IR analysis of FGO. Before adsorption, a peak at 871.73 cm−1 was observed, which may be attributed to the stretching of C–H in aromatic hydrogen.54 The peaks at 1113.2 cm−1 and 1580 cm−1 might be attributed to C![[double bond, length as m-dash]](https://www.rsc.org/images/entities/char_e001.gif) C and C
C and C![[double bond, length as m-dash]](https://www.rsc.org/images/entities/char_e001.gif) O stretching. A peak at 1360 cm−1 was also observed, corresponding to C–N stretching vibrations,28 and a peak with a small fluctuation at 1709 cm−1 belonged to O
O stretching. A peak at 1360 cm−1 was also observed, corresponding to C–N stretching vibrations,28 and a peak with a small fluctuation at 1709 cm−1 belonged to O![[double bond, length as m-dash]](https://www.rsc.org/images/entities/char_e001.gif) C–OH.55 After adsorption, a new peak appeared at 625.89 cm−1, which was due to the addition of Tl–O, indicating that the hydrogen ion exchange between Tl(I) and oxygen-containing functional groups on the surface of FGO may also promote the removal of Tl(I).
C–OH.55 After adsorption, a new peak appeared at 625.89 cm−1, which was due to the addition of Tl–O, indicating that the hydrogen ion exchange between Tl(I) and oxygen-containing functional groups on the surface of FGO may also promote the removal of Tl(I).
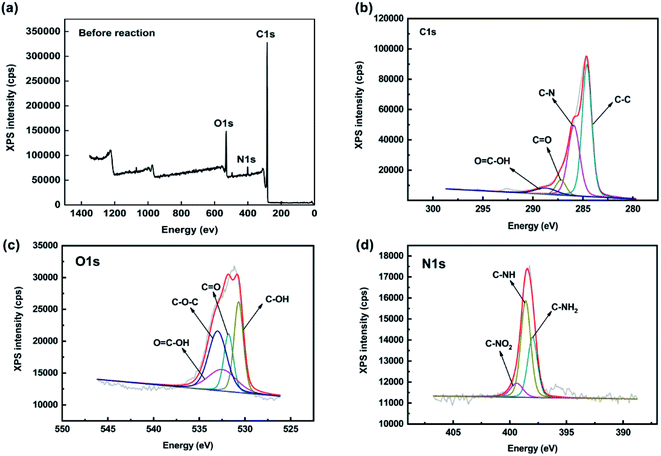
To further investigate the Tl(I) adsorption mechanism, XPS was carried out to determine the chemical state of FGO before and after adsorption. The XPS spectra of FGO and reaction with Tl(I) are shown in Fig. 7. In the C 1s spectrum, there is a C–C peak at approximately 284.6 eV and O![[double bond, length as m-dash]](https://www.rsc.org/images/entities/char_e001.gif) C–OH peak at 288.7 eV. The shoulder peak at 285.9 eV originates from the combination of C–N bonds, and there is a peak at 287.2 eV belonging to C
C–OH peak at 288.7 eV. The shoulder peak at 285.9 eV originates from the combination of C–N bonds, and there is a peak at 287.2 eV belonging to C![[double bond, length as m-dash]](https://www.rsc.org/images/entities/char_e001.gif) O. The O 1s spectrum contained peaks at 531.8 eV and 532.5 eV corresponding to C–OH and C
O. The O 1s spectrum contained peaks at 531.8 eV and 532.5 eV corresponding to C–OH and C![[double bond, length as m-dash]](https://www.rsc.org/images/entities/char_e001.gif) O bonds, respectively, a peak at 530.7 eV corresponding to O
O bonds, respectively, a peak at 530.7 eV corresponding to O![[double bond, length as m-dash]](https://www.rsc.org/images/entities/char_e001.gif) C–OH and at peak at 533 eV corresponding to C–O–C. There are three N 1s peaks at 399.4 eV, 398.6 eV and 398 eV, indicating that the aza-crown ether was well coordinated to GO. The peak position can be attributed to the primary amine N atom, in aza-crown ether, and the nitrogen atom in the primary amine had a strong nucleophilic property and was accompanied by imine N atoms and nitro.
C–OH and at peak at 533 eV corresponding to C–O–C. There are three N 1s peaks at 399.4 eV, 398.6 eV and 398 eV, indicating that the aza-crown ether was well coordinated to GO. The peak position can be attributed to the primary amine N atom, in aza-crown ether, and the nitrogen atom in the primary amine had a strong nucleophilic property and was accompanied by imine N atoms and nitro.
After the adsorption of Tl(I), the Tl peak appeared. As the XPS of Tl 4f, two peaks were observed in Fig. 8e, which are generally defined as spin orbit splitting: 4f7/2 and 4f5/2, and the spin–orbit splitting is 4.4 eV,56 and the double peaks of Tl2O were observed at 118.4 eV and 122.82 eV, with a distance between them of 4.42 eV.57 The peak areas of carbon and oxygen did not change significantly (Fig. 8b and c), which indicated that the two elements did not change their valence and composition in the process of Tl adsorption. It should be noted that after adsorption, the N 1s peak has a larger new peak area at 407.4 eV (Fig. 8d), which should be the nitrate carried by TlNO3. Tl accounted for 18.3% of the elemental composition after adsorption, indicating that the material had an excellent adsorption capacity for Tl.29
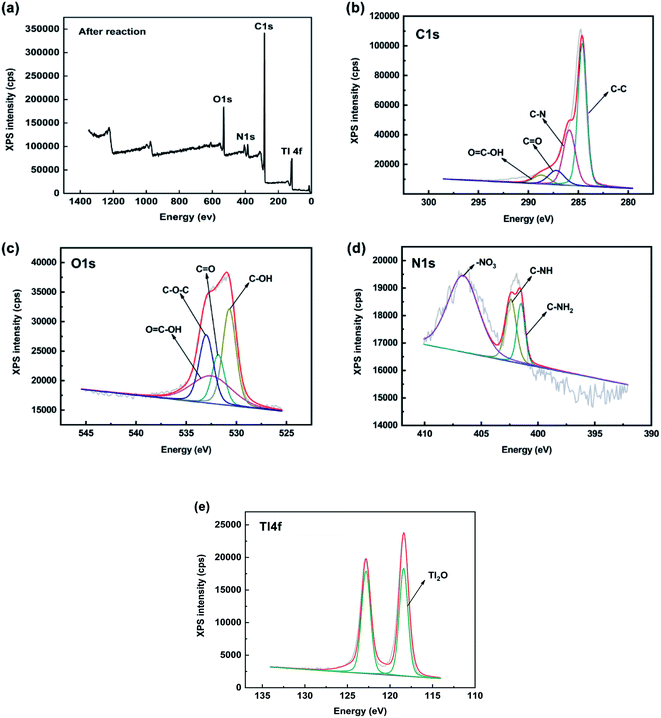 | ||
| Fig. 8 Map showing after adsorption with Tl(I) the XPS spectra of C 1s, O 1s, N 1s and Tl 4f in FGO. | ||
3.5 Quantitative molecular surface analysis of FGO
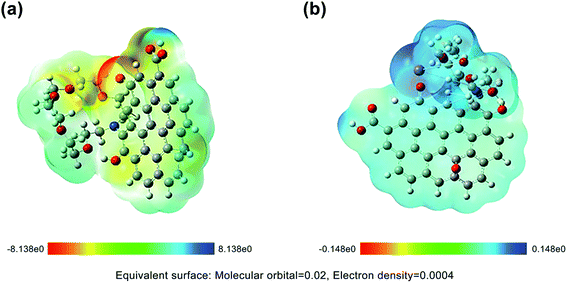
Thallium is essentially an electrophilic reagent, and Tl(I) usually tends to form Tl–Tl, Tl–C, and Tl–O interactions, which reflects its behavior as both a Lewis acid and Lewis base.58 It can be seen from Fig. 9a that the electrostatic potential on the aza-crown ether group in FGO was relatively negative. When the aza-crown ether adsorbed Tl (Fig. 9b), it preferentially coordinated with the metal ions. In particular, Vmin was attracted to the most negative area of V(r) and could easily approach the following three characteristic molecules: (1) lone pair atoms, such as O and N, and (2) the π region, such as in the aromatic system and above the double bond of related carbon atoms, (3) strained carbon–carbon bonds.59Fig. 10a shows a strong negative potential region, which was related to the lone pair electronic structure of the epoxy of aza-crown ether. The Vmin value was −57.16 kcal mol−1, and the weak negative regions of V(r) can be observed above and below the aromatic ring. It is well known that the substituents of coordination compounds can greatly affect the reactivity of the carbon rings in GO; thus, these substituents also have a significant impact on the electrostatic potential of GO. The N and O on the aza-crown ether ligand enhance the negative potential above and below the carbon rings in GO. Even these ligands had stronger negative potentials for nitrogen and oxygen after functionalization.
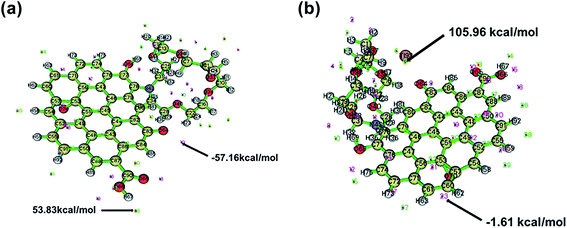 | ||
| Fig. 10 Extreme distribution of electrostatic potential of FGO: (a) before reaction, (b) after reaction with Tl. | ||
3.6 Adsorption energy of FGO
The interaction energy of structure a and structure b in the complex after FGO adsorbed Tl was calculated as the enthalpy of Tl(I) adsorption by FGO minus the enthalpy of isolated FGO molecules and isolated Tl(I) ions. The adsorption energy was −254.8153 kJ mol−1. An adsorption energy below 10–30 kJ mol−1 indicates physical adsorption, which is weak; an adsorption energy above 50–960 kJ mol−1 indicates chemical adsorption, and the larger the value is, the stronger the adsorption. It can be seen from Table 1 that the adsorption of Tl(I) by FGO occurred via chemical adsorption, and the adsorption was strong.4. Conclusions
In this work, FGO was used to explore the adsorption capacity of Tl(I). The results showed that at 0.08 g L−1 FGO and the optimal pH, the adsorption efficiency was 85.88%, and the corresponding adsorption capacity was 112.21 mg g−1. Through extensive characterization by a variety of characterization techniques and quantum chemical structural simulation, the adsorption sites of FGO were determined after adsorption of Tl(I). In fact, FGO is a highly specific surface material with strong affinity for charged chemical species, good electrical conductivity and corresponding selectivity and a rapid response to different kinds of heavy metals. Therefore, FGO can be used as a material for adsorbing heavy metals and to make related sensors for metal analysis.Conflicts of interest
There is no competing financial interest.Acknowledgements
The work was funded by the Natural Science Foundation of China (No. 41830753, U1612442). Constructive comments and suggestions from both Dr Junhua Chen at Guangdong Institute of Eco-environmental Science & Technology, China and two anonymous reviewers are greatly appreciated.References
- L. H. Keith and W. A. Telliard, Environ. Sci. Technol., 1979, 13, 416–423 Search PubMed.
- T. Yanagi, Lect. Notes Earth Sci., 2011, 136, 77–102 Search PubMed.
- M. U. Anagboso, A. Turner and C. Braungardt, J. Geochem. Explor., 2013, 125, 1–7 Search PubMed.
- T. Wojtkowiak, B. Karbowska, W. Zembrzuski, M. Siepak and Z. Lukaszewski, J. Geochem. Explor., 2016, 161, 42–48 Search PubMed.
- F. Sabermahani, N. M. Mahani and M. Noraldiny, Toxin Rev., 2017, 36, 154–160 Search PubMed.
- H. Li, Y. Chen, J. Long, D. Jiang, J. Liu, S. Li, J. Qi, P. Zhang, J. Wang, J. Gong, Q. Wu and D. Chen, J. Hazard. Mater., 2017, 333, 179–185 Search PubMed.
- S. O. Adio, M. Asif, A.-R. I. Mohammed, N. Baig, A. A. Al-Arfaj and T. A. Saleh, Process Saf. Environ. Prot., 2019, 121, 254–262 Search PubMed.
- J. Liu, X. Luo, Y. Sun, D. C. W. Tsang, J. Qi, W. Zhang, N. Li, M. Yin, J. Wang, H. Lippold, Y. Chen and G. Sheng, Environ. Int., 2019, 126, 771–790 Search PubMed.
- V. Cheam, Water Qual. Res. J. Can., 2001, 36, 851–878 Search PubMed.
- B. Campanella, A. D’Ulivo, L. Ghezzi, M. Onor, R. Petrini and E. Bramanti, Chemosphere, 2018, 196, 1–8 Search PubMed.
- T. Xiao, J. Guha, D. Boyle, C.-Q. Liu, B. Zheng, G. C. Wilson, A. Rouleau and J. Chen, Environ. Int., 2004, 30, 501–507 Search PubMed.
- W. Liu, P. Zhang, A. G. L. Borthwick, H. Chen and J. Ni, J. Colloid Interface Sci., 2014, 423, 67–75 Search PubMed.
- K. Brajter, J. Chromatogr. A, 1974, 102, 385–390 Search PubMed.
- L. Albert and H. Masson, US Pat., US5296204A, 1994 Search PubMed.
- E. Makrlik, M. Bures, P. Vanura and Z. Asfari, J. Mol. Liq., 2016, 218, 473–477 Search PubMed.
- X. Huangfu, C. Ma, J. Ma, Q. He, C. Yang, J. Zhou, J. Jiang and Y. Wang, Chemosphere, 2017, 189, 1–9 Search PubMed.
- I. Duru, D. Ege and A. R. Kamali, J. Mater. Sci., 2016, 51, 6097–6116 Search PubMed.
- Q. Wang, M. H. Wang, K. F. Wang, Y. Liu, H. P. Zhang, X. Lu and X. D. Zhang, Biomed. Mater., 2015, 10, 032001 Search PubMed.
- S. Petrescu, S. Avramescu, A. M. Musuc, F. Neatu, M. Florea and P. Ionita, Mater. Res. Bull., 2020, 122, 110643 Search PubMed.
- M. Herrera-Alonso, A. A. Abdala, M. J. McAllister, I. A. Aksay and R. K. Prud’homme, Langmuir, 2007, 23, 10644–10649 Search PubMed.
- W. R. Collins, E. Schmois and T. M. Swager, Chem. Commun., 2011, 47, 8790–8792 Search PubMed.
- A. Bianchi, M. Micheloni and P. Paoletti, Coord. Chem. Rev., 1991, 110, 17–113 Search PubMed.
- H. Lee and S. S. Lee, Org. Lett., 2009, 11, 1393–1396 Search PubMed.
- G. G. Talanova, Ind. Eng. Chem. Res., 2000, 39, 3550–3565 Search PubMed.
- S. M. Blair, J. S. Brodbelt, A. P. Marchand, K. A. Kumar and H. S. Chong, Anal. Chem., 2000, 72, 2433–2445 Search PubMed.
- Y. V. Fedorov, O. A. Fedorova, S. N. Kalmykov, M. S. Oshchepkov, Y. V. Nelubina, D. E. Arkhipov, B. V. Egorova and A. D. Zubenko, Polyhedron, 2017, 124, 229–236 Search PubMed.
- V. A. Shubert, C. W. Mueller and T. S. Zwier, J. Phys. Chem. A, 2009, 113, 8067–8079 Search PubMed.
- M. Valt, B. Fabbri, A. Gaiardo, S. Gherardi, D. Casotti, G. Cruciani, G. Pepponi, L. Vanzetti, E. Iacob, C. Malagu, P. Bellutti and V. Guidi, Mater. Res. Express., 2019, 6 Search PubMed.
- R. Ballesteros-Garrido, M. de Miguel, A. Domenech-Carbo, M. Alvaro and H. Garcia, Chem. Commun., 2013, 49, 3236–3238 Search PubMed.
- X. Li, D. Tang, F. Tang, Y. Zhu, C. He, M. Liu, C. Lin and Y. Liu, Mater. Res. Bull., 2014, 56, 125–133 Search PubMed.
- N. Wang, Z. Su, N. Deng, Y. Qiu, L. Ma, J. Wang, Y. Chen, K. Hu, C. Huang and T. Xiao, Sci. Total Environ., 2020, 717, 137090 Search PubMed.
- M. Yin, J. Sun, Y. Chen, J. Wang, J. Shang, N. Belshaw, C. Shen, J. Liu, H. Li, W. Linghu, T. Xiao, X. Dong, G. Song, E. Xiao and D. Chen, Environ. Pollut., 2019, 244, 174–181 Search PubMed.
- X. Liuyang, H. Yang, S. Huang, Y. Zhang and S. Xia, J. Environ. Chem. Eng., 2020, 8, 104474 Search PubMed.
- J. Ji, G. Chen, J. Zhao and Y. Wei, Fuel, 2020, 282, 118715 Search PubMed.
- C. Lee, W. Yang and R. G. Parr, Phys. Rev. B: Condens. Matter Mater. Phys., 1988, 37, 785–789 Search PubMed.
- T. Lu and F. Chen, J. Mol. Graphics Modell., 2012, 38, 314–323 Search PubMed.
- T. Lu and F. Chen, J. Comput. Chem., 2012, 33, 580–592 Search PubMed.
- J. S. Murray and P. Politzer, Wiley Interdiscip. Rev.: Comput. Mol. Sci., 2011, 1, 153–163 Search PubMed.
- H. Weinstein, P. Politzer and S. Srebrenik, Theor. Chim. Acta., 1975, 38, 159–163 Search PubMed.
- K. D. Sen and P. Politzer, J. Chem. Phys., 1989, 90, 4370–4372 Search PubMed.
- R. Zhao, X. Li, B. Sun, M. Shen, X. Tan, Y. Ding, Z. Jiang and C. Wang, Chem. Eng. J., 2015, 268, 290–299 Search PubMed.
- H. Li, X. Li, T. Xiao, Y. Chen, J. Long, G. Zhang, P. Zhang, C. Li, L. Zhuang and K. Li, Chem. Eng. J., 2018, 353, 867–877 Search PubMed.
- H. Li, X. Li, Y. Chen, J. Long, G. Zhang, T. Xiao, P. Zhang, C. Li, L. Zhuang and W. Huang, J. Cleaner Prod., 2018, 199, 705–715 Search PubMed.
- X. Li, H. Li, P. Zhang, K. Li and M. Lin, Chin. J. Environ. Eng., 2018, 12, 720–730 Search PubMed.
- H. Li, J. Xiong, T. Xiao, J. Long, Q. Wang, K. Li, X. Liu, G. Zhang and H. Zhang, Process Saf. Environ. Prot., 2019, 127, 257–266 Search PubMed.
- J. Sun, X. Zhang, A. Zhang and C. Liao, J. Environ. Sci., 2019, 80, 197–207 Search PubMed.
- Y. Li, H. Li, F. Liu, G. Zhang, Y. Xu, T. Xiao, J. Long, Z. Chen, D. Liao, J. Zhang, L. Lin and P. Zhang, J. Hazard. Mater., 2020, 386, 121900 Search PubMed.
- W. Zou, R. Han, Z. Chen, J. Zhang and J. Shi, Colloids Surf., A, 2006, 279, 238–246 Search PubMed.
- E. Nyankson, J. Adjasoo, J. K. Efavi, R. Amedalor, A. Yaya, G. P. Manu, K. Asare and N. A. Amartey, J. Chem., 2019, 2019, 1–13 Search PubMed.
- N. Saman, N. A. Ahmad Kamal, J. W. P. Lye and H. Mat, Adv. Powder Technol., 2020, 31, 3205–3214 Search PubMed.
- M. A. Al-Ghouti and D. A. Da'ana, J. Hazard. Mater., 2020, 393, 122383 Search PubMed.
- S. R. Nayak, K. N. Mohana and M. B. Hegde, J. Fluorine Chem., 2019, 228, 109392 Search PubMed.
- N. Sharma, V. Sharma, S. K. Sharma and K. Sachdev, Mater. Lett., 2019, 236, 444–447 Search PubMed.
- B. Li, L. Yang, C. Q. Wang, Q. P. Zhang, Q. C. Liu, Y. D. Li and R. Xiao, Chemosphere, 2017, 175, 332–340 Search PubMed.
- N. C. D. Nath, I.-Y. Jeon, M. J. Ju, S. A. Ansari, J.-B. Baek and J.-J. Lee, Carbon, 2019, 142, 89–98 Search PubMed.
- K. Kishimoto, Y. Nose, Y. Ishikawa, M. N. Fujii and Y. Uraoka, J. Alloys Compd., 2016, 672, 413–418 Search PubMed.
- M. P. Kumar, T. Kesavan, G. Kalita, P. Ragupathy, T. N. Narayanan and D. K. Pattanayak, RSC Adv., 2014, 4, 38689–38697 Search PubMed.
- E. Mirzadeh, K. Akhbari and J. White, Inorg. Chem. Commun., 2018, 92, 95–100 Search PubMed.
- J. S. Murray and P. Politzer, Electrostatic Potentials: Chemical Applications, American Cancer Society, 2002 Search PubMed.
- E. Makrlík, D. Sýkora, S. Böhm, P. Vaňura, V. Církva, J. Storch and M. Polášek, J. Mol. Struct., 2015, 1100, 150–153 Search PubMed.
- M. Polášek, E. Makrlík, J. Kvíčala, V. Křížová and P. Vaňura, J. Mol. Struct., 2018, 1153, 78–84 Search PubMed.
- E. Makrlík, S. Böhm, P. Vaňura and P. Ruzza, J. Mol. Struct., 2014, 1064, 107–110 Search PubMed.
Footnote |
| † Electronic supplementary information (ESI) available. See DOI: 10.1039/d0ra09193f |
| This journal is © The Royal Society of Chemistry 2020 |


