 Open Access Article
The spin–orbit–phonon coupling and crystalline elasticity of LaCoO3 perovskite
Guo-Jiun Shu *ab,
Pei-Chieh Wub and
F. C. Chou
 cdef
cdef
aDepartment of Materials and Mineral Resources Engineering, National Taipei University of Technology, Taipei 10608, Taiwan. E-mail: gjshu@mail.ntut.edu.tw
bInstitute of Mineral Resources Engineering, National Taipei University of Technology, Taipei 10608, Taiwan
cCenter for Condensed Matter Science, National Taiwan University, Taipei 10617, Taiwan
dNational Synchrotron Radiation Research Center, Hsinchu 30076, Taiwan
eTaiwan Consortium of Emergent Crystalline Materials, Ministry of Science and Technology, Taipei 10622, Taiwan
fCenter of Atomic Initiative for New Materials, National Taiwan University, Taipei 10617, Taiwan
First published on 26th November 2020
Abstract
Based on an integrated study of magnetic susceptibility, specific heat, and thermal expansion of single-crystal LaCoO3 free from cobalt and oxygen vacancies, two narrow spin gaps are identified before and after the phonon softening of gap size ΔE ∼ 0.5 meV in a CoO6-octahedral crystal electric field (CEF) and the thermally activated spin gap Q ∼ 25 meV, respectively. Significant excitation of Co3+ spins from a low-spin (LS) to a high-spin (HS) state is confirmed by the thermal activation behavior of spin susceptibility χS of energy gap Q ∼ 25 meV, which follows a two-level Boltzmann distribution to saturate at a level of 50% LS/50% HS statistically above ∼200 K, without the inclusion of a postulated intermediate spin (IS) state. A threefold increase in the thermal expansion; coefficient (α) across the same temperature range as that of thermally activated HS population growth is identified, which implies the non-trivial spin–orbit–phonon coupling caused the bond length of Co3+(LS↔HS)–O fluctuation and the local lattice distortion. The unusually narrow gap of ΔE ∼ 0.5 meV for the CoO6 octahedral CEF between eg–t2g indicates a more isotropic negative charge distribution within the octahedral CEF environment, which is verified by the Electron Energy Loss Spectroscopy (EELS) study to show nontrivial La–O covalency.
I. Introduction
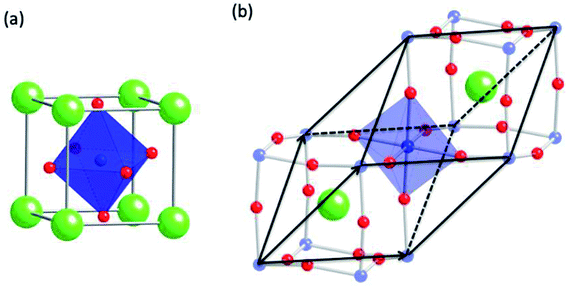
Following extensive research into ABO3-type transition metal oxide perovskites in the 1950s,1,2 among the series LaTO3 (T = Cr, Mn, Fe, Co, Ni), LaCoO3 was demonstrated to exhibit rich magnetic and structural properties. For example, LaCoO3 does not possess the expected high-symmetry cubic structure found in most perovskites, but has a pseudo-cubic distortion best described with the rhombohedral space group R![[3 with combining macron]](https://www.rsc.org/images/entities/char_0033_0304.gif) c (no. 167) up to temperatures of ∼650 K,3 as illustrated in Fig. 1. In addition, the magnetic susceptibility χ(T) of LaCoO3 shows both thermal activation behavior and Curie–Weiss paramagnetic behavior arising presumably from the excitation of nonmagnetic Co3+ ions ([Ar]3d6) sitting in the CoO6 octahedral CEF, which has been attributed to a thermally activated two-level spin state transition of Co3+ from the low-spin (LS = t62ge0g) state with S = 0 to the high-spin (HS = t42ge2g) state with S = 2,4,5 although orbital ordering for the intermediate-spin (IS = t52ge1g) state with S = 1 has also been proposed.6,7 Many conflicting reports about the spin state of LaCoO3 have been made based on the DFT calculations, susceptibility model fittings, and spectroscopic studies since.4,8–15
c (no. 167) up to temperatures of ∼650 K,3 as illustrated in Fig. 1. In addition, the magnetic susceptibility χ(T) of LaCoO3 shows both thermal activation behavior and Curie–Weiss paramagnetic behavior arising presumably from the excitation of nonmagnetic Co3+ ions ([Ar]3d6) sitting in the CoO6 octahedral CEF, which has been attributed to a thermally activated two-level spin state transition of Co3+ from the low-spin (LS = t62ge0g) state with S = 0 to the high-spin (HS = t42ge2g) state with S = 2,4,5 although orbital ordering for the intermediate-spin (IS = t52ge1g) state with S = 1 has also been proposed.6,7 Many conflicting reports about the spin state of LaCoO3 have been made based on the DFT calculations, susceptibility model fittings, and spectroscopic studies since.4,8–15
In their pursuit of a deeper understanding of the “transitional” nature of d-orbital electrons-from a localized to an itinerant character-in the transition metal perovskites, Goodenough and co-workers16–19 have raised many fundamentally important questions closely related to LaCoO3, such as (1) why is it difficult to obtain phases having more than 50% of Co4+ through A-site substitution? (2) What is the origin of the localized spins showing “Curie tail” behavior below ∼30 K? (3) Does disproportionation of Co3+ into Co2+–Co4+ occur? (4) Is there an ordered configuration of LS and HS? In addition, does the IS state really exist in LaCoO3? To answer these questions conclusively, mixed valence of cobalt due to nonstoichiometry must first be ruled out, especially the oxygen vacancy.
By focusing on reducing the localized impurity spin contribution in the growth of single-crystal LaCoO3, we have obtained vacancy-free single crystals using the optical traveling solvent floating-zone method following a high-oxygen-pressure and high-temperature post-annealing procedure. In particular, the vacancy-free sample shows no low-temperature χ(T) Curie tail, but saturates to a constant as T → 0 K, which is in sharp contrast to the behavior resulting from cobalt and/or oxygen vacancy defects that has been reported in nearly all early publications.7,20,21 Integrated data analysis of the magnetic susceptibility χ(T), specific heat CP(T), and thermal expansion coefficient α(T) without complications arising from impurity spins and mixed valence leads to the conclusive identification of an HS population distribution across the two energy gaps of ΔE ∼ 0.5 meV and Q ∼ 25 meV before and after phonon softening.
Current findings on defect-free LaCoO3 are able to resolve most of the controversies raised in the literature, including the debate about the existence of an IS state and orbital ordering. In addition, the finding of three times increase of thermal expansion coefficient above the thermally activated phonon softening range strongly suggests that the nontrivial spin–orbit–phonon coupling is responsible for the pseudo-cubic symmetry of the ABO3-type perovskite due to constant Co–O bond length fluctuation at room temperature.
II. Experimental details
Single crystal LaCoO3 was grown using optical floating-zone growth method through direct melting and re-crystallization for its congruent melt nature with a melting point of 1750 °C. In the preparation of polycrystalline LaCoO3 feed rod, Co and O loss is unavoidable during high temperature treatment in the air at ambient pressure, which is evidenced by the commonly found Al2CoO4 precipitate in blue color at the bottom of alumina annealing tray (shown in Fig. 2). It is found that a 5% Co excess in the precursor is required to compensate for the loss of Co for treatment above 990 °C. For the high pressure oxygen annealing process, the as-grown single crystal was mixed with Co3O4 powder in molar ratio of 1![[thin space (1/6-em)]](https://www.rsc.org/images/entities/char_2009.gif) :
:![[thin space (1/6-em)]](https://www.rsc.org/images/entities/char_2009.gif) 1 sealed in a thick wall 310S stainless steel tubing with added KClO4 oxidant. The sealed tubing was annealed at 1200 °C for one week. The quantitative chemical analysis has been applied to the as-prepared and annealed crystal samples with electron probe micro-analysis (EPMA) and the oxygen/nitrogen combustion analyzer (EMGA-920, Horiba).
1 sealed in a thick wall 310S stainless steel tubing with added KClO4 oxidant. The sealed tubing was annealed at 1200 °C for one week. The quantitative chemical analysis has been applied to the as-prepared and annealed crystal samples with electron probe micro-analysis (EPMA) and the oxygen/nitrogen combustion analyzer (EMGA-920, Horiba).
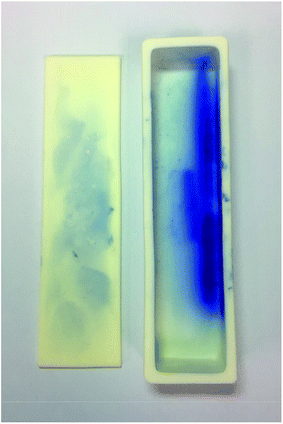 | ||
| Fig. 2 After LaCoO3 crystal is annealed at 800 °C in the argon atmosphere, a blue color residue is coated, which indicates the formation of Al2CoO4. | ||
The magnetic susceptibility, specific heat, and thermal expansion coefficient of single crystal LaCoO3−δ samples were measured using SQUID-VSM (QD-USA) in both AC and DC modes, Physical Property Measurement System (PPMS, QD-USA) with a pulsed heating method, and a capacitance-type device in the PPMS platform between 2 to 600 K, respectively. In particular, the linear thermal expansion coefficient α = (1/L0)dL/dT of single-crystal samples was measured directly with a newly designed capacitance-type device incorporated into the PPMS.
The electron energy-loss spectroscopy (EELS) spectra were acquired using Transmission Electronic Microscope (TEM) with a JEOL 2100F field emission gun operated at 200 kV, which equipped with a Gatan image filter (GIF, Tridiem 863) of energy resolution ∼0.85 eV. The TEM specimen was prepared with focused ion beam (FIB, Tescan GAIA). The single scattering STEM-EELS spectra were deconvoluted from the raw data with subsequent Kramers–Kronig Analysis (KKA), and the calculation of effective electron number (neff) was conducted with the Digital Micrograph EELS package which was written on the basis of ref. 22.
III. Results and discussions
A. Crystal nonstoichiometry
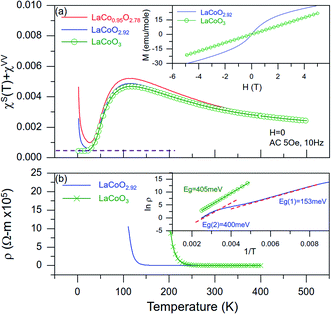
The chemical analysis results of the as-prepared and annealed crystal samples are summarized in Table 1. Both the Co and O vacancies have been controlled through the initial 5% Co excess adjustment and the post high-pressure high-temperature annealing process. The magnetic susceptibilities χ(T) and the isothermal magnetization M(H) at 2 K are compared in Fig. 3 to show the impact of nonstoichiometry on the physical properties. It is noted that samples with either Co or O vacancies shows clear Curie-tail behavior for χ(T) at low temperature, which indicates the existence of localized spins from defects. Additional field scan of isothermal magnetization M(H) at 2 K [inset of Fig. 3(a)] has provided solid evidence that the impurity spin of Curie-tail behavior is consistent to the paramagnetic behavior of S = 1/2 from the isolated spins following the Brillouin function. The total number of spin per mole is estimated from the intercept of M (2 K, H → 0) for LaCoO2.92 to be N ∼ 3.4%, which is consistent to the vacancy level of δ ∼ 0.08 within error, i.e., each oxygen vacancy roughly generates an additional spin 1/2. In contrast, the vacancy-free sample shows no Curie-tail in χ(T) and its isothermal magnetization at 2 K shows the constant paramagnetic background without contribution from the additional S = 1/2 spins being aligned by the increasing field.| La (at%) | Co (at%) | O (at%) | f. u. (±0.01) | |
|---|---|---|---|---|
| La:Co | 21.14(2) | 20.08(5) | 58.77(3) | LaCo0.95O2.78 |
| Excess Co | 20.36(8) | 20.36(4) | 59.26(6) | LaCoO2.92 |
| Excess Co + HP | 19.96(6) | 19.99(6) | 60.00(9) | LaCoO3.00 |
Yan et al.23 proposed that the low temperature upturn could be coming from the ferromagnetic (FM) behavior of the HS state in their study. However, our results have ruled out the FM interpretation in several aspects: (1) the upturn behavior is removed entirely after high pressure oxygen annealing, which supports the explanation of oxygen vacancy-induced PM behavior, (2) no FM phase transition is identified below ∼20 K from Cp(T) data to support the existence of a FM phase transition, (3) the size of LaCoO3 single crystal grown by the FZ method is large enough to obtain a crack-free single crystal sample for the susceptibility measurement by slicing, which significantly reduced the surface-to-bulk ratio. Thus, the surface contribution can be neglected entirely in this study. On the other hand, Pimental et al.,24 pointed out that higher concentration point defects would prevent the valence number of Co ions to reach the perfect +3 valence. Although they proposed that antiferromagnetic coupling between Co3+/Co4+ may induce a weak canted-spin ferromagnetic moment, which lacks microscopic model, it's challenging to apply their interpretation to explain our observations based on current experimental results.
Besides the magnetic property difference shown in Fig. 3(a), an obvious difference between the as-prepared and annealed samples is revealed on the transport behavior also. The onset of metal-to-insulator transition is shown shifted from ∼175 K to ∼275 K after the post-annealing, and the Arrhenius plot shown in the inset of Fig. 3(b) suggests that besides the intrinsic gap of ∼400 meV for both, the sample with oxygen vacancies has an additional gap opening of ∼153 meV, which is probably related to the formation of a defect-generated impurity band.
B. Direct measurement of χVV and spin gap Q
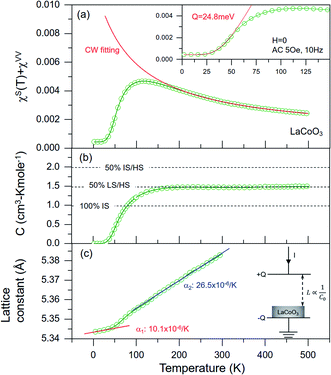
Both homogeneous DC and AC spin susceptibilities of pulverized LaCoO3 (δ ∼ 0) crystal samples without Co/O vacancies were measured, and Fig. 4(a) shows χ(T) data using an AC field of 5 Oe/10 Hz from 2 to 500 K after the core diamagnetic correction (χcore = χLa + χCo + 3χO = −0.66 × 10⁻⁴ cm3 mol−1)25 to| χ(T) = χimp(T) + χcore + χVV + χS(T) |
Co3+([Ar]3d6) in the CoO6 octahedral CEF of LaCoO3 is expected to remain in the nonmagnetic ground state of the LS (t62ge0g) configuration with S = 0 below ∼30 K. The dramatic increase in χS(T) between ∼30 and ∼100 K [see Fig. 4(a)] has often been attributed to the increasing number of Co3+ ions being excited to a state of nonzero spin,28 but the question next is what types of excited spin state of corresponding populations are distributed. Without complications arising from the Curie tail correction, the thermal activation behavior of exp(−Q/kBT) is fitted reliably for χS(T) below ∼50 K to show a spin gap of Q ∼ 24.8 meV [inset of Fig. 4(a)], which is comparable to the values estimated using DC magnetic susceptibility (25 meV),29 ultrasound (11 meV),11 and optical absorption (19 meV) on samples of unknown Co or O vacancy level.30
C. Boltzmann distribution of HS
For LaCoO3 of δ ∼0, the 1/χS vs. T linear dependence between ∼200–500 K implies a typical PM behavior following the Curie–Weiss law. The Curie-Weiss law fitting of χS(T) = C/(T − Θ) for χVV + χS(T) data between 200 and 500 K [Fig. 4(a)] used a constant fitting parameter of χVV = 4.2 × 10⁻⁴ cm3 mol−1 read directly from T → 0 K, which satisfactorily returns a Curie constant C = 1.476(5) cm3 mol−1 and a Weiss temperature Θ = −131.7(8) K. The magnitude and sign of Θ corresponds to the minimum thermal energy required to break the antiferromagnetically coupled spins.31 If we follow the conventional data analysis method by assuming there is only one type of spin specie that is responsible for the PM state described by the Curie-Weiss law, the Curie constant C = N0μeff2/3kB is contributed from the single spin specie of effective moment μeff = 3.436 μB.Because the LS(t62ge1g), IS(t52ge1g), and HS(t42ge2g) states have S = 0, 1, and 2, respectively, g = 2.42 for IS and g = 1.39 for HS are calculated from  under the single specie spin-only assumption. The observation of g > 2 for the first row transition metal element of 3d6 filling could be attributed to the incomplete orbital quenching,32 mostly from the unpaired electrons in the triply degenerate t2g (dxy/dyz/dzx) orbitals which are operable with 90° orbital rotation. However, the degree of orbital contribution to the effective moment remains unknown theoretically, not to mention that the g < 2 value for HS cannot be explained in this context. In addition, the three-fold degeneracy of t2g for the octahedral CEF splitting of LaCoO3 must have been lifted by the pseudo-cubic distortion already. In order to extract more meaningful information from the measured Curie constant, we propose to use a multi-component spin-only model analysis that has been proven successful in the interpretation of the magnetic property of NaxCoO2 before.33
While the Curie constant represents the sum of all nonzero spins in the PM state without distinguishing the actual spin species of corresponding populations, there are multiple possible distributions of spin size/population that are consistent with the experimental value of
where the effective moments μi2 = g2Si(Si + 1)μB2 (i = 1, 2, 3) correspond to LS, IS, and HS states, respectively. To analyze Curie constant with multiple spin species spin-only model, i.e., g = 2 in the high-temperature PM regime (for T > |Θ|∼132 K) of the full thermally activated stage, the theoretical Curie constants of four possible excited spin distributions for Co3+ are calculated to be C = 0.999, 1.999, 2.998, and 1.499 cm3 mol−1 for mixtures of 100% IS, 50% IS/50% HS, 100% HS, and 50% LS/50% HS, respectively, as indicated by the dashed lines shown in Fig. 4(b).
It is interesting to note that the high-temperature saturated value of the Curie constant follows the 50% LS/50% HS distribution perfectly. The 50% LS/50% HS statistical distribution at high temperature is illustrated clearly in Fig. 3(b) by the plot of the temperature dependence of the Curie constant C(T) = N(T)μeff2/3kB = χS(T)x(T − Θ) derived from the Curie–Weiss behavior of χS(T), where
D. Phonon softening and crystalline elasticity
Because of the close relationship between spin state and crystal lattice, there have been a number of detailed investigations reported on the structural properties of nominally stoichiometric LaCoO3 using temperature-dependent X-ray and neutron diffraction techniques.8,35 with the aim of obtaining a more precise determination of this relationship. Instead of using a diffraction technique for the averaged lattice parameters, we have extracted the linear thermal expansion coefficient α = (1/L0)dL/dT of a single-crystal sample directly with a newly designed capacitance-type device incorporated into the PPMS, as illustrated schematically in the inset of Fig. 4(c). L(T) data were extracted from measurements of the capacitance C0 = ε0A/L between 5 and 300 K, which are consistent with the lattice parameters obtained from high-resolution neutron diffraction data with L0 calibrated to the room-temperature lattice parameter.35 The α values calculated from the slope of L(T) for T ≥ 135 K (α2 ∼ 26.5 × 10⁻⁶ K−1) are nearly three times larger than those extracted from T ≤ 30 K (α1 ∼ 10.1 × 10⁻⁶ K−1). It is also interesting to see that the variation of α(T) is consistent with the temperature dependence of χ(T) [Fig. 4(a) and Table 2] in three ranges: α is low for T ≤ 30 K, corresponding to the T-independent χVV; α is high between Weiss temperature |Θ| ∼ 132 K and Debye temperature θD ∼ 512 K, corresponding to the PM behavior of HS spins saturating to the 50% LS/50% HS level; and α behaves nonlinearly between ∼30 and |Θ| ∼ 132 K, corresponding to the growing thermally activated HS population. A strong spin–orbit–phonon coupling is hinted on crossing the temperature range of thermally activated phonon softening.| T ≤ 30 K | 30 ≤ T ≤ |θ| ∼ 132 K | |θ| ≤ T ≤ θD | T ≥ θD ∼ 521 K | |
|---|---|---|---|---|
| α(T) | α1 ∼ 10.1 × 10⁻⁶ K−1 | Nonlinear | α2 ∼ 26.5 × 10⁻⁶ K−1 | |
| χ(T) | χcore + χVV | χS(T) ∝ exp(−Q/T) | χS(T) ∼ C/(T − Θ) | |
| HS% | ∼0 | Boltzmann distribution | ∼50% LS/50% HS | |
| Cp | Celp + Cphp(T) | Phonon softening | Celp(T) + [Cphp − ΔCphp](T) | Dulong–Pettit limit |
The bond length of Co3+(LS↔HS)–O fluctuation had been observed by Zhang et al. with resonance ultrasound spectroscopy.35 Their discussion about the relaxation processes in terms of thermally activated Debye-like freezing processes is exactly in line with our proposed model for interpretation in this study. Although most of the early works treated the spin states of LS and HS to be a simple thermal activation process for the electrons excited to the unoccupied CEF state, Zhang et al. had examined elastic and inelastic oscillation modes to demonstrate not only spin–spin relaxation but also spin-lattice relaxation dynamically and randomly. The proposed complex local Jahn–Teller deformation with concomitant local FM field is consistent with our proposed symmetry breaking related to the Co3+ size variation in time and positions. Although the thermal expansion coefficient (α) goes down to zero at 0 K theoretically without considering the quantum nature of the solid state, the observation of α changes three times in the two regimes in our experiments is consistent with the high resolution synchrotron X-ray results reported by Bull and Knight.36
E. Magnetic specific heat contribution from HS
The specific heats of LaCoO3 between 2 and 300 K were measured with the PPMS using a pulsed heating method, and those between 300 and 600 K were measured with a differential scanning calorimeter (DSC) (STA 449F3, NETZSCH), as shown in Fig. 5(a). The Dulong–Petit limit 3RZ = 3 × 8.314 J (mol K)−1 × 5 = 124.71 J (mol K)−1 (Z = 5 for LaCoO3) is approached above ∼500 K to be near the Debye temperature θD. The total speci_c heat includes electronic (Celp), phonon (Cphp), and magnetic (Cmagp) contributions. Although no long-range magnetic ordering has been identified in LaCoO3, except for the spin-gapped ground state below ∼30 K, the magnetic contribution Cmagp(T) in the PM regime should not be excluded, because each spin in the excited HS state must carry magnetic energy higher than its ground LS state. Since the phonon contribution Cphp(T) is expected to be reduced after the phonon is softened above ∼30 K, the loss of Cphp(T)[ΔCphp(T)]could be transferred to Cmagp(T) owing to the strong spin–orbit-phonon coupling to reflect the HS population growth, i.e.,| Cp(T) = Celp(T) + Cphp(T) |
| Cp(T) = Celp(T) + [Cphp − ΔCphp](T) |
| ΔCphp(T) → Cmagp(T) |
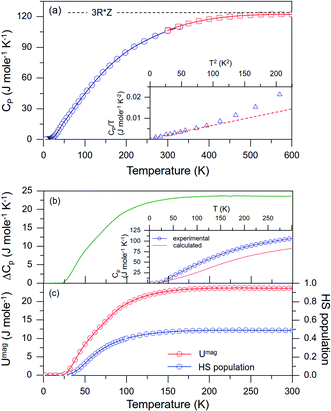 | ||
Fig. 5 (a) Specific heat of LaCoO3 from 2 to 600 K, where the Dulong–Petit limit is indicated. The value for Celp(T) is extracted from T < 10 K as shown in the inset. (b) Significant difference between the measured total Cp(T) and the Debye model calculated Cphp(T) is found. The difference ΔCphp(T) is attributed to the gain of Cmagp(T). (c) The magnetic internal energy calculated from  shows a similar temperature dependence to the HS population growth being saturated at the 50% LS/HS level, as estimated independently from the Curie constant data shown in Fig. 4(b). shows a similar temperature dependence to the HS population growth being saturated at the 50% LS/HS level, as estimated independently from the Curie constant data shown in Fig. 4(b). | ||
Although it is common to extract the β and Sommerfeld coefficient γ values from the low-temperature limit of Cp (T ≤ 10 K) through the approximations of Celp ∼ γT and Cphp ∼ βT3 (γ ∼ 0.3447 mJ mol−1 K−2 and β ∼ 0.068626 mJ mol−1 K−4), Cphp(T) data after the phonon softening [Cphp − ΔCphp](T) above _30 K are not accessible this way. However, we may use the available β value before phonon softening (and thus without magnetic contribution) to construct a Cphp(T) spectrum using the Debye model for the whole temperature range as a baseline. The expected loss of Cphp(T) after phonon softening [ΔCp(T)]is proposed to be the Cmagp(T) gain after phonon softening with HS excitation, i.e., Cmagp(T) = ΔCphp(T) for T ≫ 30 K, which can then be estimated by subtracting the “Debye model constructed Cphp(T) before phonon softening and without magnetic contribution” from the experimental total Cp(T).
It should be noted that each data point of Cphp(T) described by the Debye model is non-analytical and can only be obtained through numerical evaluation of the Debye integral using θD/T as the upper bound, and the only parameter θD ∼521 K is derived from β ∼ 12π4RZ/5θD3 for T ≤ 10 K before phonon softening. The phonon contribution of Cphp(T) at each temperature could be described with37
Celp(T) + Cphp(T) calculated using the low-temperature estimate of γ and β(θD) is shown together with the experimental total Cp(T) in the inset of Fig. 4(b). Although LaCoO3 has been categorized as an insulator according to its large calculated band gap and the value of γ seems negligible, Celp(T)∼γTcannot be ignored in the high T range within the Fermi–Dirac statistics [see inset of Fig. 5(a)], otherwise the magnitude of Cmagp(T) would be underestimated. As shown in Fig. 5(b), a significant difference is found between the calculated Celp(T) + Cphp(T) without magnetic contribution and the experimental values of total Cp(T) for T ≥ 30 K, which can be attributed to the loss of Cphp(T) after phonon softening, or equivalently, to the gain of Cmagp(T) = ΔCphp(T) as a result of strong spin–orbit-phonon coupling. The magnetic internal energy Umag(T) can then be evaluated from Cmagp(T) through the integral of
It is gratifying to find that a similar temperature dependence is found for the HS population growth from the χ(T) data analysis independently [Fig. 4(b)], as if the total Umag were coming from the population growth of spins at the HS state carrying a fixed amount of excited energy, i.e., ΔE between eg–t2g. We may trace the magnitude of ΔE using the magnitude of Umag(300 K) from the population of HS (50% LS/50% HS at 300 K) based on the assumption that each Co3+ at HS state contributes ΔE to the magnetic system. ΔE is estimated to be ∼0.488 meV from Umag(300 K) = 23.5 J mol−1 via
| Umag = 1/2NA (mol−1) × ΔE (eV) × 1.6 × 10⁻¹⁹ (J eV−1) |
The difference between the experimentally measured total Cp(T) and the theoretically estimated phonon contribution of Cphp(T) following the Debye model [see Fig. 5(b)] could be partly coming from the imperfect description of Debye model. However, we find that the reliability and accuracy of Debye model has been demonstrated by the universality of the scaled experimental Cp values collapsed on the theoretical Cp(T)/R vs. T/θD model,40 which covers samples of chemical bonding types ranging from ionic, metallic, to covalent bondings. We have plotted the experimental Cp(T) data of LaCoO3 in the scaled form of Cp(T)/R vs. T/θD (θD = 521 K) as shown in Fig. 6. The universality is clearly demonstrated by the collapsed data points of several compounds with different chemical bonding types after scaling,40 which also overlap with the scaled theoretical Debye model nearly perfectly. The universality of scaled reduced temperature T/θD also suggests that the phonon softening induced ΔCphp–to–Cmagp transfer is absorbed by the parameter of θD completely as θD > |θ (see Table 2), which is consistent to the definition of θD as the upper bound of the normal mode for lattice vibration.37 It is also noteworthy to find that the ratio of Debye temperature (θD) to melting point (m.p.) for LaCoO3 (θD/m.p. = 521/1750 ∼0.3) is only half of that for diamond as a typical rigid covalent compound (θD/m.p. = 2230/3700 ∼0.6), which once again reacts the unique elastic nature of crystallinity for LaCoO3.
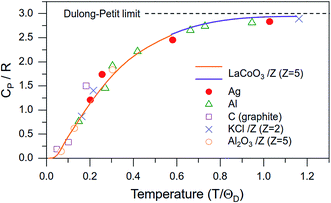 | ||
| Fig. 6 The reliability of phonon specific heat estimated with the Debye model is confirmed by the scaling of the experimental data of LaCoO3 in Cp(T)/R vs. T/θD, where several representative compounds of different chemical bonding types (reproduced following ref. 43) collapse onto the same scaling relationship. | ||
F. Band gaps and spin gaps
The resistivity as a function of temperature for two representative nonstoichiometric and stoichiometric samples are compared in Fig. 3(b). The onset of sharp resistivity increase as a signature of metal-to-insulator transition for sample with oxygen vacancies is reduced significantly, presumably as a result of the carrier doping created by the oxygen vacancy. According to the Arrhenius plot shown in the inset of Fig. 3(b), besides the high temperature larger activation gap of ∼400 meV extracted between 200–400 K for both, the sample with oxygen vacancy shows additional activation gap of ∼150 meV at lower temperature between 80–200 K, which is consistent to a band picture of larger intrinsic CB–VB band gap ∼400 meV plus a smaller gap ∼150 meV across the impurity band above VB (p-type doping) or below CB (n-type doping). Based on the Seebeck measurement results (not shown),41 the carrier doping from oxygen vacancy is confirmed to be p-type, and a schematic band picture is proposed as shown in Fig. 7. The band gap near ∼150 meV is close to that reported by English et al. on a sample having similar Curie-tail behavior.42 On the other hand, the larger gap of ∼400 meV is consistent to the optical gap size extracted from the synchrotron X-ray reflectivity spectrum and that calculated using the density functional theory (DFT) under GGA+U approximation.44,45 Mostly importantly, the oxygen vacancy-free sample shows single gap of ∼400 meV, in contrast to the sample having oxygen vacancy to show two gaps, including the intrinsic CB–VB gap of ∼400 meV and an additional smaller gap between IB–VB of ∼150 meV.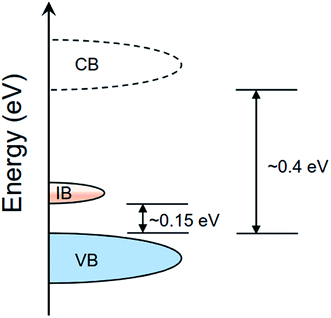 | ||
| Fig. 7 A proposed band picture of LaCoO3−δ with an oxygen-deficiency induced p-type impurity band (IB) between the valence band (VB) and conduction band (CB). | ||
Besides the band gaps extracted from the thermal activation behavior of resistivity shown above, two more narrow gaps, including the CEF gap ΔE ∼ 0.5 meV estimated from the magnetic internal energy Umag gain [Fig. 5(c)] due to increasing HS population, and the spin gap Q ∼ 25 meV extracted from the thermal activation behavior of χ(T) [Fig. 4(a)], are closely related to the quantum nature being reflected on the spin state. The band gaps and spin gaps deducted from this work and those reported in the literature are summarized in Table 3. The difference between ΔE and Q is not just one order of magnitude on size, the former is so small that allows spontaneous HS excitation of quantum nature even for T → 0 K. The narrow ΔE is also responsible for the temperature-independent paramagnetic contribution of χVV as an orbital Zeeman effect for the whole temperature range,46 mostly because the dominant contribution of χVV must be coming from the narrow CEF gap ΔE of the energy spectrum in the denominator of the second order perturbation for χ = ∂2E/∂H2 as
 is the Zeeman operator.32 In particular, the thermally activated gap Q must have little contribution to χVV for its much larger gap size and thus little contribution to the perturbation.
It must be stressed that the size of actual CEF-induced energy splitting is often unknown theoretically,47 let alone its additional fine splitting due to the octahedral CEF distortion, e.g., the Jahn–Teller effect. Current work using LaCoO3 sample without low temperature Curie-tail behavior provided a unique opportunity to obtain a reliable χVV value which is contributed from the quantum fluctuation across the extremely narrow CEF gap ΔE. On the other hand, the thermally activated gap Q is reflected on the HS population growth with the assistance of phonon softening mechanism, which indicates energy transfer from the external thermal energy to the system magnetic energy by way of spin–orbit–phonon coupling, as also reflected on the tripled thermal expansion coefficient α(T) across the same temperature range [see Fig. 4(c)]. We might view the phenomenon of phonon softening as a prerequisite for the HS population growth that requires longer (Co–O)HS; otherwise, the stronger Coulomb repulsion among electrons would suppress the HS excitation in a rigid lattice of shorter (Co–O)LS bond length.
G. EELS study: why is the CEF gap so small?
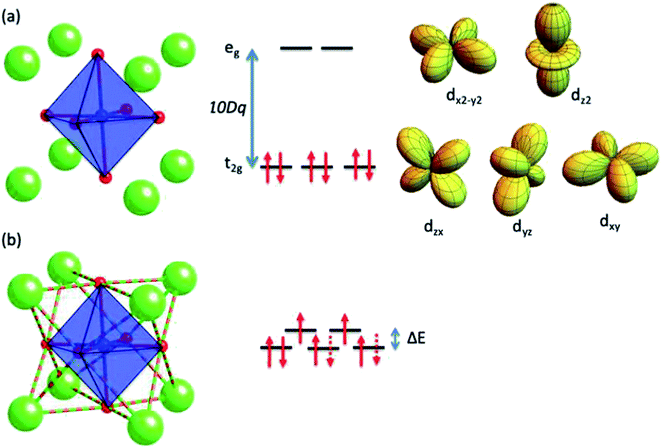
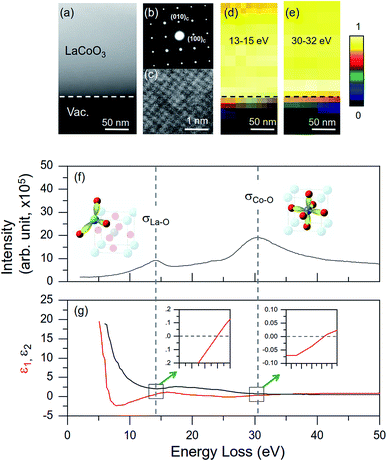
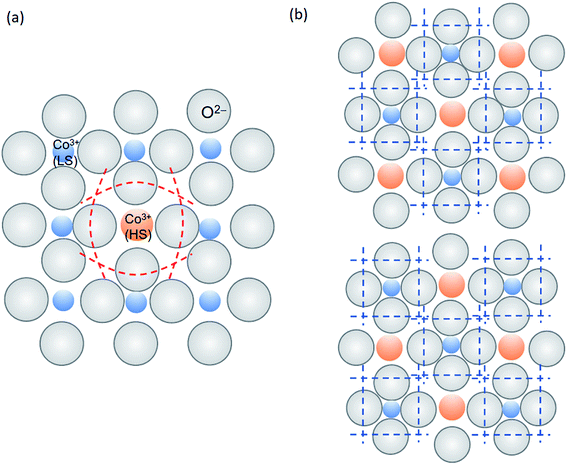
Because the CEF splitting for Co3+ ion sitting in the center of a slightly distorted CoO6 octahedral environment remains unknown and has only been deduced to be near 1 eV,32,48 the actual CEF-induced eg–t2g splitting is not likely to be any one of the gaps summarized in Table 3. However, we argue that the actual eg–t2g splitting corresponds to the narrow gap of ΔE ∼ 0.5 meV for LaCoO3, and the thermal activation gap Q for HS excitation is achieved through thermal-strain-magnetic energy exchange with the help of a strong spin–orbit–phonon coupling after the phonon softening. It is reasonable to interpret the Hund's rule for the HS configuration that two electrons are excited to the eg level so that the Coulomb repulsion among electrons in 3d-orbitals is minimized (see Fig. 8). The softened phonon of expanded average interatomic distance is preferable for the HS state of larger ionic size, which has been confirmed by the study thermal expansion as shown in Fig. 4(c). This direction of interpretation basically follows the developmental concepts of small polaron and the breathing type distortion of ligands consistently.5,17,43 The immediate question following would be: why is the CEF splitting (ΔE) so small for LaCoO3?Since the origin of an octahedral CEF splitting is coming from the static electric field created by the uneven electron distribution of six ligands surrounding the Co center, a more isotropic environment of negative effective charge of ligands is expected to reduce the CEF size significantly. On examining the ligands surround the Co center of LaCoO3, although Krapek et al. have proposed that Co–O covalency is responsible for the size reduction of the effective moment for the HS state,49 the covalency of Co–O is not sufficient to assist a more isotropic negative charge distribution, as illustrated by the six dp hybridized orbitals still pointing toward the six neighboring oxygens (see Fig. 8). The most likely source to create less effective negative charge of oxygen ligands is that partial valence electrons of O2− is pulled away from the region along the six Co–O bonding directions and re-distribute more evenly toward the eight La–O bonding directions, as illustrated in Fig. 8(b). It is likely that the La–O bonding is different to the more ionic nature of Na–O and Sr–O in NaCoO2 and SrCoO3−δ,50,51 i.e., the La–O covalency may not be ignored anymore in LaCoO3. In the study of LaCoO3, the impact of Sr substitution to the La site has been examined repeatedly in the literature.16,45,52 However, the possibility of Sr substitution induced oxygen vacancy has often been ignored, which complicates the Co spin state interpretation due to the intertwined factors among local strain, electron count, and vacancy ordering. In order to examine the possibility of La–O covalency, the EELS spectrum of LaCoO3 has been explored for the evidence of plasmonic resonance coming from the paired covalent electrons among La–O.
The STEM-EELS study results of LaCoO3 are shown in Fig. 9. In contrast to the X-ray photoemission spectroscopy (XPS) which reveals the information of the excitation from the occupied states of valence band, the electron energy-loss spectroscopy (EELS) can provide the information of excitation from both the valence and conduction bands.53 The EELS spectrum contains the excitations of valence electrons in collective modes, including surface and volume plasmons, single-particle excitations, inter-band transitions, and low-lying core-level ionizations.22 Fig. 9(a) and (c) shows the low magnification and atomic resolved high-angle annular dark field (HAADF) images in scanning TEM (STEM), respectively. Fig. 9(b) shows the electron diffraction pattern correlated to Fig. 9(a). Indeed, the atomic resolved HAADF image recorded along [001] direction revealed a pseudo-cubic symmetry which is consistent with literature report.54 Although the ferroelastic domain walls in LaCoO3 had widely observed in literature,55,56 however, our HP-LaCoO3 single crystal exhibits high crystal quality including the crystallinity and domain-free in this study. The EELS spectrum for LaCoO3 [Fig. 9(f)] reveals several spectral features of incident beam energy loss at ∼13.9, ∼30.4 eV, and the ∼63.3 eV (not shown) from Co M2,3 edge excitation. Within the framework of macroscopic dielectric-response theory,22,53 we derived the frequency-dependent dielectric function (ε = ε1 + iε2) of LaCoO3 by performing the Kramers–Kronig Analysis (KKA) as shown in Fig. 9(g). Since ε1 passes through zero at ∼13.9 and ∼30.4 eV with accompanied decrease of ε2, which gives rise to the maxima of the volume loss function Im − 1/ε(ω) and the absorptions near ∼13.9 and ∼30.4 eV show characteristics of volume-plasmon excitations and also confirm with highest intensity localized in bulk interior in Fig. 9(d) and (e), respectively, performed by spectrum imaging.53,57 The physical origin of the volume plasmons near ∼13.9 and ∼30.4 eV are proposed coming from the collective plasmonic resonance of valence electrons among La–O and Co–O, respectively. The EELS evidence of nontrivial La–O covalency supports the scenario that the reduced and isotropic effective negative charge of oxygen ligands is responsible for the significantly reduced octahedral CEF gap size of ΔE ∼ 0.5 meV for LaCoO3.
H. The implication of crystalline elasticity
It is reasonable to assume that the bond length of (Co–O)HS is slightly longer than that of (Co–O)LS for electron filling in the higher eg energy level of HS (t42ge2g) state, which could lead to direct correlation between the magnetic and phonon energies via spin–orbit–phonon coupling, as shown in Fig. 4 and the published high resolution lattice parameters.8,35 In particular, when a 3d-electron is excited from t2g to the higher eg level, concomitant local distortion must occur (see Fig. 10),26 and a local breathing mode is established between the magnetic Zeeman energy and the phonon energy of ferroelectric origin.17 The dilute distribution of HS spins below ∼30 K exhibits a low α with a rigid and homogeneous distribution of shorter (Co–O)LS bonds. As the HS population grows with increasing temperature, the initial randomly distributed low population of HS would create high strain to the lattice, until nearly half of the Co ions are excited to the HS state at high temperature.A more homogeneous magnetic-phonon energy exchange is achieved for the 50% HS/50% LS distribution of minimum lattice strain with well-defined threefold increase of α (see Fig. 4). The reduction of rigidity is prerequisite for the 50%(Co–O)HS/50%(Co–O)LS statistical distribution under thermal fluctuations, which is also reflected on the increase of electron entropy.58
Yamaguchi et al. have proposed that eg orbital ordering (OO) may exist in the Co3+ IS state (t52ge1g) of LaCoO3 having lifted orbital degeneracy in eg,7 i.e., the electron in eg prefers to occupy either dx2−y2 or dz2 orbital in an ordered pattern (see Fig. 8), which has also been applied to explain the observed split Co–O stretching mode as local distortion arising from the Jahn–Teller effect. Comparing these two proposed model interpretations for the local distortion due to Co–O bond length fluctuation, the controversial IS state could be explained equally well by either the OO of an IS state, or the 50% LS/50% HS statistical distribution in time average. Above all, the distinction between HS and IS is not possible in the high temperature metallic phase anyway.49
IV. Conclusion
In conclusion, based on an integrated study of the magnetic susceptibility, specific heat, and thermal expansion of a single crystal LaCoO3 nearly free of cobalt and oxygen vacancies, we propose a consistent interpretation of strongly correlated spin state and crystal lattice for the pseudo-cubic LaCoO3 perovskite. The puzzling deviation of the crystal symmetry from cubic to rhombohedral symmetry as a relaxed pseudo-cubic structure is related to the LS/HS spin state transition with corresponding statistically distributed (Co–O)LS–(Co–O)HS bond length fluctuation.Data availablity
The data that support the findings of this study are available from the corresponding author upon reasonable request.Conflicts of interest
There are no conflicts to declare.Acknowledgements
We appreciate the help from Dr Sz-Chian Liou from AIM Lab., Maryland NanoCenter, Institute for Research in Electronic and Applied Physics, University of Maryland, College Park, to supply the EELS experiments and helpful discussions. FCC acknowledges funding support from MOST-Taiwan under project numbers 106-2119-M-002-035-MY3 and 108-2622-8-002-016, AI-MAT project number 108L900903 from the Ministry of Education in Taiwan, and Academia Sinica (AS-iMATE-108-11). GJS acknowledges support from MOST-Taiwan under project number MOST-108-2112-M-027-002-MY3.References
- H. L. Yakel, Acta Crystallogr., 1955, 8, 394 CrossRef CAS.
- W. C. Koehler and E. O. Wollan, J. Phys. Chem. Solids, 1957, 2, 100 CrossRef CAS.
- M. A. Senaris-Rodriguez and J. B. Goodenough, J. Solid State Chem., 1995, 116, 224 CrossRef CAS.
- M. W. Haverkort, et al., Phys. Rev. Lett., 2006, 97, 176405 CrossRef CAS.
- S. W. Biernacki, Phys. Rev. B: Condens. Matter Mater. Phys., 2006, 74, 184420 CrossRef.
- M. A. Korotin, S. Y. Ezhov, I. V. Solovyev, V. I. Anisimov, D. I. Khomskii and G. A. Sawatzky, Phys. Rev. B: Condens. Matter Mater. Phys., 1996, 54, 5309 CrossRef CAS.
- S. Yamaguchi, Y. Okimoto and Y. Tokura, Phys. Rev. B: Condens. Matter Mater. Phys., 1997, 55, R8666 CrossRef CAS.
- P. G. Radaelli and S.-W. Cheong, Phys. Rev. B: Condens. Matter Mater. Phys., 2002, 66, 094408 CrossRef.
- C. Zobel, M. Kriener, D. Bruns, J. Baier, M. Gruninger, T. Lorenz, P. Reutler and A. Revcolevschi, Phys. Rev. B: Condens. Matter Mater. Phys., 2002, 66, 020402 CrossRef.
- G. Vanko, J. P. Rue, A. Mattila, Z. Nemeth and A. Shukla, Phys. Rev. B: Condens. Matter Mater. Phys., 2006, 73, 024424 CrossRef.
- S. N. Thant, K. Toshiaki, K. Yoshihiko, S. Masaru and A. Kichizo, J. Phys. Soc. Jpn., 2006, 75, 084601 CrossRef.
- R. Schmidt, J. Wu, C. Leighton and I. Terry, Phys. Rev. B: Condens. Matter Mater. Phys., 2009, 79, 125105 CrossRef.
- G. Maris, Y. Ren, V. Volotchaev, C. Zobel, T. Lorenz and T. T. M. Palstra, Phys. Rev. B: Condens. Matter Mater. Phys., 2003, 67, 224423 CrossRef.
- Y. Kobayashi, T. S. Naing, M. Suzuki, M. Akimitsu, K. Asai, K. Yamada, J. Akimitsu, P. Manuel, J. M. Tranquada and G. Shirane, Phys. Rev. B: Condens. Matter Mater. Phys., 2005, 72, 174405 CrossRef.
- R.-P. Wang, A. Hariki, A. Sotnikov, F. Frati, J. Okamoto, H.-Y. Huang, A. Singh, D.-J. Huang, K. Tomiyasu, C.-H. Du, J. Kunes and F. M. F. de Groot, Phys. Rev. B: Condens. Matter Mater. Phys., 2018, 98, 035149 CrossRef CAS.
- J. B. Goodenough, J. Phys. Chem. Solids, 1958, 6, 287 CrossRef CAS.
- J. B. Goodenough, Czech J. Phys., 1967, 17, 304 CrossRef CAS.
- J. B. Goodenough, Phys. Rev., 1967, 164, 785 CrossRef CAS.
- J. B. Goodenough, J. Appl. Phys., 1966, 37, 1415 CrossRef CAS.
- N. Biskup, J. Salafranca, V. Mehta, M. P. Oxley, Y. Suzuki, S. J. Pennycook, S. T. Pantelides and M. Varela, Phys. Rev. Lett., 2014, 112, 087202 CrossRef.
- K. Asai, A. Yoneda, O. Yokokura, J. M. Tranquada, G. Shirane and K. Kohn, J. Phys. Soc. Jpn., 1998, 67, 290 CrossRef CAS.
- R. F. Egerton, Electron Energy-Loss Spectroscopy in the Electron Microscope, Springer Science, 2011 Search PubMed.
- J. –Q. Yan, J. –S. Zhou and J. B. Goodenough, Phys. Rev. B: Condens. Matter Mater. Phys., 2004, 70, 014402 CrossRef.
- B. Pimentel, R. J. Caraballo-Vivas, N. R. Checca, D. L. Rocco and M. S. Reis, J. Alloys Compd., 2019, 796, 331–337 CrossRef CAS.
- E. du Tremolet de Lacheisserie, D. Gignoux, and M. Schlenker, Magnetism: II-Materials and Applications, Springer US, 2012 Search PubMed.
- T. Kyomen, Y. Asaka and M. Itoh, Phys. Rev. B: Condens. Matter Mater. Phys., 2005, 71, 024418 CrossRef.
- M. Itoh, M. Sugahara, I. Natori and K. Motoya, J. Phys. Soc. Jpn., 1995, 64, 3967 CrossRef CAS.
- K. Asai, P. Gehring, H. Chou and G. Shirane, Phys. Rev. B: Condens. Matter Mater. Phys., 1989, 40, 10982 CrossRef CAS.
- K. Knizek, Z. Jirak, J. Hejtmanek and P. Novak, J. Phys.: Condens. Matter, 2006, 18, 3285 CrossRef CAS.
- R. Marx and H. Happ, Phys. Status Solidi B, 1975, 67, 181 CrossRef CAS.
- G. J. Shu, J. C. Tian, C. K. Lin, M. Hayashi, S. C. Liou, W. T. Chen, D. P. Wong, H. L. Liou and F. C. Chou, New J. Phys., 2018, 20, 058002 CrossRef.
- N. W. Ashcroft and N. D. Mermin, Solid State Phys., 2011, 643–725 Search PubMed.
- G. J. Shu and F. C. Chou, Phys. Rev. B: Condens. Matter Mater. Phys., 2016, 93, 140402 CrossRef.
- G. J. Shu, S. C. Liou, S. K. Karna, R. Sankar, M. Hayashi and F. C. Chou, Phys. Rev. Mater., 2018, 2, 044201 CrossRef CAS.
- Z. Zhang, J. Koppensteiner, W. Schranz, D. Prabhakaran and M. A. Carpenter, J. Phys. Condens. Matter, 2011, 23, 14501 Search PubMed.
- C. L. Bull and K. S. Knight, Solid State Sci., 2016, 57, 38 CrossRef CAS.
- C. Kittel, Introduction to Solid State Physics, Wiley, 1996 Search PubMed.
- C. He, H. Zheng, J. F. Mitchell, M. L. Foo, R. J. Cava and C. Leighton, Appl. Phys. Lett., 2009, 94, 102514 CrossRef.
- S. Noguchi, S. Kawamata, K. Okuda, H. Nojiri and M. Motokawa, Phys. Rev. B: Condens. Matter Mater. Phys., 2002, 66, 094404 CrossRef.
- N. Manini, Introduction to the Physics of Matter, Springer, 2015 Search PubMed.
- M. Dragan, S. Enache, M. Varlam and K. Petrov, in Cobalt Compounds and Applications, IntechOpen, 2019 Search PubMed.
- S. R. English, J. Wu and C. Leighton, Phys. Rev. B: Condens. Matter Mater. Phys., 2002, 65, 220407 CrossRef.
- E. Iguchi, K. Ueda and W. H. Jung, Phys. Rev. B: Condens. Matter Mater. Phys., 1996, 54, 17431 CrossRef CAS.
- T. Arima, Y. Tokura and J. B. Torrance, Phys. Rev. B: Condens. Matter Mater. Phys., 1993, 48, 17006 CrossRef CAS.
- S. Zhang, N. Han and X. Tan, RSC Adv., 2015, 5, 760 RSC.
- R. M. White, Quantum theory of magnetism, Magnetic Properties of Materials, Springer Berlin Heidelberg, Berlin, Heidelberg, vol. 32, 2007 Search PubMed.
- D. C. Johnston, Phys. Rev. Lett., 1989, 62, 957 CrossRef CAS.
- P. M. Raccah and J. B. Goodenough, Phys. Rev., 1967, 155, 932 CrossRef CAS.
- V. Krapek, P. Novak, J. Kunes, D. Novoselov, D. M. Korotin and V. I. Anisimov, Phys. Rev. B: Condens. Matter Mater. Phys., 2012, 86, 195104 CrossRef.
- G. J. Shu and F. C. Chou, Phys. Rev. B: Condens. Matter Mater. Phys., 2013, 88, 155130 CrossRef.
- A. Munoz, C. de la Calle, J. A. Alonso, P. M. Botta, V. Pardo, D. Baldomir and J. Rivas, Phys. Rev. B: Condens. Matter Mater. Phys., 2008, 78, 054404 CrossRef.
- C. N. R. Rao, M. M. Seikh, and C. Narayana, in Spin Crossover in Transition Metal Compounds II, Springer Berlin Heidelberg, Berlin, Heidelberg, 2004, pp. 1–21 Search PubMed.
- H. Raether, Excitation of Plasmons and Interband Transitions by Electrons, Springer, 2006 Search PubMed.
- R. F. Klie, J. C. Zheng, Y. Zhu, M. Varela, J. Wu and C. Leighton, Phys. Rev. Lett., 2007, 99, 047203 CrossRef CAS.
- J. C. Walmsley, A. Bardal, K. Kleveland, M. –A. Einarsrud and T. Grande, J. Mater. Sci., 2000, 35, 4251–4260 CrossRef CAS.
- N. Orlovskaya, N. Browning and A. Nicholls, Acta Mater., 2003, 51, 5063–5071 CrossRef CAS.
- S. C. Liou, M.-W. Chu, R. Sankar, F.-T. Huang, G. J. Shu, F. C. Chou and C. H. Chen, Phys. Rev. B: Condens. Matter Mater. Phys., 2013, 87, 085126 CrossRef.
- B. Chakrabarti, T. Birol and K. Haule, Phys. Rev. Mater., 2017, 1, 064403 CrossRef.
| This journal is © The Royal Society of Chemistry 2020 |

