 Open Access Article
Improved H2 utilization by Pd doping in cobalt catalysts for reductive amination of polypropylene glycol†
Kyungjun
Kim
ab,
Dong Woo
Kang
 a,
Youngheon
Choi
b,
Wanggyu
Kim
b,
Hyunjoo
Lee
 a and
Jae W.
Lee
 *a
*a
aDepartment of Chemical and Biomolecular Engineering, Korea Advanced Institute of Science and Technology (KAIST), Daejeon 34141, Republic of Korea. E-mail: jaewlee@kaist.ac.kr
bLOTTE CHEMICAL R&D Center, Daejeon 34110, Republic of Korea
First published on 22nd December 2020
Abstract
Cobalt based catalysts having enhanced H2 dissociation and desorption were synthesized by inserting a trace amount of palladium. These catalysts were used for the reductive amination of polypropylene glycol (PPG) to polyetheramine (PEA). The catalytic activity toward PEA was significantly increased by incorporating an extremely low content of palladium (around 0.01 wt%) into cobalt based catalysts. The Pd inserted cobalt catalysts promoted reduction of cobalt oxide to cobalt metal and inhibited formation of cobalt nitride in the reductive amination. The Pd inserted cobalt catalysts not only enhanced hydrogen dissociation but also accelerated hydrogen desorption by increasing the electron density of cobalt through interaction between cobalt and palladium. These play a critical role in reducing cobalt oxide or cobalt nitride to cobalt metal as an active site for the reductive amination. Thus, the Pd inserted cobalt catalysts provide improved catalytic performance toward PEA production by maintaining the cobalt metal state.
1. Introduction
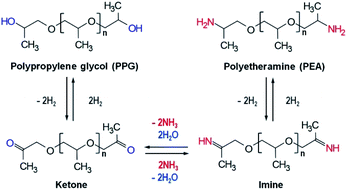
Polyetheramine (PEA) has been employed as curing, coating, and composite agents in various industries due to its good flexibility and reactivity.1 It is anticipated that the considerable growth in the wind renewable energy industry will boost the demand for PEA as an element of wind turbine blade composites. PEA is usually synthesized through reductive amination of an alcohol like polypropylene glycol (PPG) with a suitable amount of ammonia under a hydrogen atmosphere.1,2 This reaction comprises three steps: dehydrogenation of alcohol to ketone, amination of ketone to imine, and hydrogenation from imine to amine,3–7 as shown in Scheme 1. Transition metals such as cobalt and nickel were mainly used for reductive amination and metallic cobalt and nickel were known to be the active species.1,7–10 Thus, the presence of metallic species is an important factor to determine high activity toward amine.One critical issue in the reductive amination from alcohol to amine such as in the PEA synthesis is to circumvent the formation of cobalt nitride that has been considered to disturb the reductive amination.7 For the reductive amination, it was reported that cobalt nitride resulting from the reaction of cobalt metal and ammonia is responsible for the declined catalytic activity.7,11 Many research groups thus have tried to reduce the formation of cobalt nitride by increasing hydrogen partial pressure.11,12 For the PEA synthesis, however, it is known that high pressure (around 200 bar) and temperature (around 220 °C) are required,13 and it is not appropriate to further increase the PEA reaction pressure by introducing more hydrogen.
Our prior study presented a way to decrease the formation of cobalt nitride by inserting Y2O3 as a basic site into Co–Pd/molecular sieve 13X catalysts, which showed enhanced catalytic performance toward PEA compared to the Y2O3-free catalyst.1 The current study focused on a trace amount of Pd into the cobalt catalysts to find more precisely the role of Pd in PEA reaction in the Co catalyst. For the first time, this work will demonstrate how the Pd incorporation prevents cobalt nitride formation and improves reactivity toward PEA. In a prior work on the reductive amination of dodecanol, a significant amount of palladium was used (5 wt% Pd/C).14 When phenol,15 n-octanol16 and benzyl alcohol17 were used for the reductive amination, a considerable amount of palladium was also added (5 wt% Pd/C, 1.5 wt% Pd/Al2O3 and 2.3 wt% Pd/molecular sieve, respectively). It is necessary to reduce the amount of the precious metal (Pd) as much as possible due to its high cost. The catalysts proposed in this study showed not only dramatically enhanced catalytic activity toward the amine but also promoted reduction of cobalt oxide to cobalt metal and inhibited cobalt nitride formation by incorporating a trace amount of Pd metal (around 0.01 wt%) into cobalt catalysts.
It was reported that a key requirement to develop an efficient hydrogenation catalyst is to improve the release of hydrogen.18 It was observed that H2 desorption occurs at low temperature from isolated Pd atoms in Au(111) and the Au catalyst provided the least stable chemisorption state, giving a desorption ability.19 The facile H2 desorption would help the subsequent reactions of hydrogen with other species.
Furthermore, catalysts often have a high activation barrier for hydrogen dissociation, which restricts the catalytic activity.18,19 Facile dissociation of molecular hydrogen thus has often been considered as a primary requirement for efficient hydrogenation catalysts.18 It is known that additional energy is required for molecular hydrogen to be dissociated into atomic hydrogen when using a transition metal such as copper or silver, whereas the noble metals such as Pt and Pd require relatively low activation energy. For example, the activation energy for the dissociation of H2 is around 0.02 eV for Pd(111), but for Cu(111) it is about 0.76 eV.20 Cobalt catalysts show greater chemical adsorption of hydrogen at an elevated temperature than at room temperature.21–23 In order to enhance the H2 activation ability, noble metal-modified catalysts have often been prepared. The addition of Pd to cobalt helped activation of hydrogen but the amount of Pd introduced to cobalt was quite high (atomic ratio of Pd to Co is higher than 33%).24 The Pd–Au bimetallic catalysts also showed facile H2 dissociation and catalyzed hydrogen-involved reactions.18 The Pd–Cu catalysts were found to have a low energy barrier for hydrogen dissociation and high selectivity to styrene from phenylacetylene through hydrogenation with only 0.18 atomic percent of Pd.25 However, it was reported that it is normally difficult to develop a catalyst facilitating both H2 dissociation and desorption simultaneously.18,19,26 Thus, efforts have been made to solve this problem by developing effective catalysts that have a weak bond with atomic hydrogen as well as an easy H2 dissociation.18,27 Tuning d orbitals of the transition metals is required in order to control the balance between H2 adsorption and desorption.26
To this end, this work will elucidate how the insertion of a small amount of Pd improved both H2 desorption and dissociation on the Pd inserted cobalt catalysts, which results in not only the improvement of the reduction of cobalt oxide but also the inhibition of the formation of cobalt nitride. This can be an answer regarding why Pd incorporated cobalt catalysts showed even better catalytic performance than Co or Pd sole catalysts. In order to elucidate how the interaction between Co and Pd significantly affected the catalytic activity toward PEA, various kinds of analyses were carried out. X-ray photoelectron spectroscopy (XPS) will be utilized to check how much cobalt nitride is formed in each catalyst. H2 temperature programmed reduction (TPR) will reveal how well cobalt oxide is reduced to cobalt metal. H2 temperature programmed adsorption (TPA) will be employed to evaluate how the addition of a trace amount of Pd enhances the H2 dissociation ability of Pd inserted cobalt catalysts. Also, H2 temperature programmed desorption (TPD) will confirm how well hydrogen is desorbed from the catalyst surface. From these results, it will be shown that the enhanced H2 dissociation and desorption ability play an important role in improving reductive amination of PPG through the reduction of cobalt oxide and the circumvention of cobalt nitride formation, which will also beneficially lower the amount and pressure of introduced hydrogen.
2. Experimental
2.1. Preparation of catalysts
44.035 g of Co(NO3)2·6H2O (ACROS) and Pd(NO3)2·2H2O (KOJIMA) in a fixed amount (0 g, 0.009 g, 0.019 g, 0.037 g and 0.056 g) were used for the preparation of bimetallic Co–Pd catalysts. Each precursor was dissolved with 200 mL and 10 mL, respectively, of deionized water (DIW). These solutions were placed in a glass-reactor equipped with an agitator. An additional 200 mL of DIW was then introduced with the precursor solution. 195 g of 15 wt% Na2CO3 (Sigma-Aldrich) aqueous solution was used as a precipitation agent and dropped continually to the precursor solution for 1.5 h, followed by an aging step for 1.5 h. After the filter cake was washed ten times by DIW (9.0 L), drying and calcination steps were carried out at 120 °C for 15 h and at 600 °C for 4 h, respectively. These catalysts were denoted as Co–Pd(x), where the weight percent (x) was equal to 0, 0.01, 0.02, 0.04, and 0.06 when the amount of the palladium precursor was 0, 0.009 g, 0.019 g, 0.037 g, and 0.056 g, respectively.For Pd on the molecular sieve 13X (Pd/MS) catalyst, Pd(NO3)2·2H2O 0.056 g (KOJIMA) was dissolved in 10 mL of DIW and then this solution was sprayed evenly on 12 g of MS 13X for impregnation of Pd on MS 13X. Drying and calcination steps were applied identically to those in the preparation method of Co–Pd catalysts. For the Pd catalyst, Pd(NO3)2·2H2O 0.50 g (KOJIMA) was placed in a vial and 3.5 mL of DIW was introduced to dissolve the precursor. Then, 2.0 g of 15 wt% Na2CO3 (Sigma-Aldrich) aqueous solution was dropped continually into the Pd precursor solution with shaking for 1.5 h, followed by the aging step for an additional 1.5 h. The filter cake was then washed ten times with DIW (100 mL). The drying and calcination process used the same preparation method as used for the Co–Pd catalysts. For the comparison purpose, we also prepared Co–Y2O3–Pd catalysts and Co–Y2O3–Pd/MS catalysts by following the same procedure in our prior work.1
2.2. Characterization of catalysts
Catalysts were characterized to confirm the elemental composition with inductively coupled plasma optical emission spectroscopy (PerkinElmer Optima 8300). The surface area of the catalysts was determined by N2 adsorption–desorption at a liquid nitrogen temperature of 77.30 K by BEL Japan Belsorp Max. High resolution powder X-ray diffraction (Malvern Panalytical Empyrean) was used to confirm the crystalline phases of the catalysts. To check if cobalt nitride was formed, X-ray photoelectron spectroscopy (XPS) was employed on a Thermo VG Scientific K-alpha. H2-temperature programmed desorption (TPD) was also carried out to measure the amount of hydrogen desorbed from the catalysts. Temperature programmed reduction (TPR) was utilized to confirm how well cobalt oxide was reduced to cobalt metal. In addition, H2-temperature programmed adsorption (TPA) was employed on a BEL Japan Belcat. The formation of amine was confirmed from Fourier Transform Infrared Spectrometry (FT-IR) with ZnSe windows through a transmission method on Thermo Scientific Nicolet iS50. Each IR spectrum for the PEA products was obtained through the average of 64 scans, excluding the background spectrum.2.3. Reductive amination test
2.4. Density functional theory calculation
All the computational calculations were performed with Quantum Espresso software packages.28 The Perdew–Burke–Ernezerhof (PBE) exchange-correlation function with spin-polarization was applied, and the projector-augmented wave method (PAW)29,30 was used to describe the interaction between the ionic core and valence electrons with a kinetic energy cutoff of 500 eV. The initial configuration of cobalt was chosen with a hexagonal closed packed (hcp) structure from the XRD analysis, having lattice parameters of a = 0.2507 nm and c = 0.4069 nm.31 From the initial structure, a four-layered p(3 × 3) supercell was constructed to model the Co(0001) surface, and the structure of Co–Pd was modeled by replacing one single Co atom with a Pd atom in the supercell. The Monkhorst–Pack method32 was used to sample the Brillouin zone with 6 × 6 × 1 k-points grid, and the Methfessel–Paxton method33 was applied to describe the electron distribution near the Fermi level with a smearing width of σ = 0.2 eV. To calculate the H2 adsorption energy on the metal surfaces, a 15 Å vacuum-layer was added to avoid imaginary interaction of the slab. The bottom two layers of the slab were fixed, and the upper two layers and the adsorbates were relaxed during the calculation. A vibrational frequency analysis was performed on adsorbed hydrogen atoms in the optimized structure, and zero-point energy corrections were included for the resulting adsorption energies.3. Results and discussion
3.1. Catalytic activity of Pd inserted cobalt catalysts
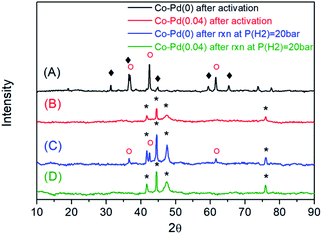
The elemental composition of the as-prepared Co–Pd catalysts was determined from ICP-OES (Table 1). With an increasing amount of the palladium precursor, the palladium content in the catalysts increased. From the XRD data in Fig. 1, it was found that for the Pd-free (Co–Pd(0)) catalyst, the Co3O4 and CoO phases still remained (Fig. 1A) after the catalyst activation step, while the Co catalysts containing Pd were fully reduced to cobalt metal (Fig. 1B and S1†) from the Co3O4 phase (refer to Fig. S2†). After the amination at P(H2) = 20 bar, the Co–Pd(0) catalyst had a CoO phase that was not fully reduced from that in Fig. 1C. For Co–Pd(0.04), no CoO peak appeared in the XRD data, indicating that the Co metal phase existed after the reductive amination, as shown in Fig. 1D. The crystal size was similar to each other from the XRD data in Fig. 1C and D and in Table 1 (for more data, refer to Fig. S2–S4†). Also, the marked difference in the particle size by Pd addition was not found in the TEM images (Fig. S5†). The amount of Pd included was around 0.01 to 0.04 wt% by ICP-OES in Table 1, and was too small for the Pd peak to be observed in XRD (Fig. 1). The catalyst BET surface area was not much different in the catalysts as given in Table 1.| Catalysts | Contents of Co/Pda (wt%) | S BET b (m2 g−1) | D Co c (nm) | |
|---|---|---|---|---|
| Co | Pd | |||
| a Determined by ICP-OES analysis for the fresh catalysts. b BET surface area for fresh catalysts. c The Co crystal size of the fresh catalysts was estimated by XRD patterns. | ||||
| Co–Pd(0) | 78.90 | — | 5.2 | 34.7 |
| Co–Pd(0.01) | 75.37 | 0.0102 | 8.1 | 34.2 |
| Co–Pd(0.02) | 77.49 | 0.0211 | 9.5 | 34.4 |
| Co–Pd(0.04) | 76.58 | 0.0369 | 8.4 | 33.6 |
Reductive amination for the production of PEA was carried out to test the activity of each catalyst prepared depending on the amount of Pd. Fig. 2A shows that the total amine yield at P(H2) = 10 bar rose with an increasing amount of Pd except for the case of the Co–Pd(0.04) catalyst. It was quite noticeable that the addition of a trace amount of Pd (just around 0.01 wt%) into the Co catalyst (Co–Pd(0.01)) brought dramatically improved the catalytic activity toward PEA. The amine yield was nearly the same as that when the amount of Pd was 0.02 wt%. Fig. 2A shows that the primary amine selectivity of the Co–Pd catalysts was maintained despite that the selectivity normally decreased with the increasing yield. The primary amine can attack the partially positive carbon in the intermediates of ketone or imine, which leads to the formation of secondary amine (Scheme S1†).4
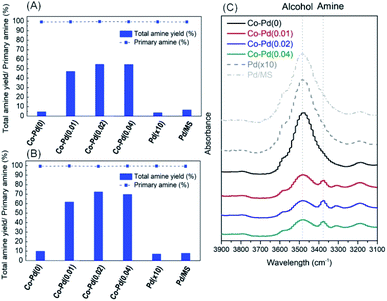 | ||
| Fig. 2 Catalytic performance of Co catalysts with varying Pd amounts under P(H2) = 10 bar (A), under P(H2) = 20 bar (B), and IR results for the PEA product at P(H2) = 20 bar by Co–Pd catalysts (C). | ||
It is known that the catalytic activity in reductive amination is enhanced by increasing the hydrogen pressure, because the formation of metal nitride is prevented under H2 enriched conditions.7,11,34 When the hydrogen pressure rose to P(H2) = 20 bar, the amine yield at P(H2) = 20 bar (Fig. 2B) was higher than that at P(H2) = 10 bar (Fig. 2A). This result was ascribed to the inhibition of cobalt nitride formation by increasing the hydrogen partial pressure, which led to the enhanced amine yield.1 This enhanced catalytic activity was further confirmed by the FT-IR analysis, as shown in Fig. 2C and any intermediates such as ketone and imine were not found (Fig. S6†). The addition of a trace amount of Pd into the cobalt catalysts mostly brought an increase in the formation of amine (about 3378 cm−1) while the amount of alcohol (about 3478 cm−1) was diminished.35–37
However, when using a pure Pd catalyst with a 10 times higher amount of Pd than Co–Pd(0.04) for the PEA reaction, the catalytic activity was severely low, as shown in the Pd(×10) results in Fig. 2. Also, when impregnated Pd on MS 13X (the same Pd amount as in Co–Pd(0.04)) was used for the PEA reaction to increase the dispersion of Pd, the catalyst performance was quite low as well. These results support that cobalt or palladium as a sole component does not show good catalytic activity for the PEA reaction, whereas when these two components are combined together, the activity toward PEA can be dramatically improved even with a trace amount of Pd. It indicates that adding a trace amount of Pd is more efficient for enhancing the amine yield towards PEA (the dramatic yield increase from 5% for Co–Pd(0) to 47% for Co–Pd(0.01) in Fig. 2A) rather than just increasing the hydrogen pressure (the yield increase from 5 to 10% for Co–Pd(0) in Fig. 2A and B).
The catalytic activity toward PEA was also remarkably increased by inserting a trace amount of Pd to Co–Y2O3–Pd catalysts and Co–Y2O3–Pd/MS catalysts that were studied in our previous work (refer to Fig. S7 and Table S1†).1 The incorporation of a trace amount of Pd (around 0.02 wt%) to Co–Y2O3–Pd and Co–Y2O3–Pd/MS improved the PEA yield (about 72% and 95%, respectively), whereas the PEA yield in the Pd-free catalysts was around 21% and 41%, respectively. It was confirmed that the addition of a trace amount of Pd to cobalt based catalysts brought a dramatically improved catalytic activity toward PEA in Fig. 2 (also refer to Fig. S7†). Thus, it will be important to understand how Pd insertion affects the catalytic activity. In the next section, the positive influence of the addition of Pd into the catalysts on improving the reactivity toward PEA will be discussed.
3.2. Improved reduction ability of catalyst
Temperature programmed reduction (TPR) was employed to determine how well the Pd inserted cobalt catalysts were reduced from cobalt oxide to cobalt metal. It is known that Co3O4 phase is reduced to cobalt metal through the CoO phase.38–40 As shown in Fig. 3, for the Co–Pd(0) catalyst, the first peak at around 333 °C appeared and the second peak was seen at about 393 °C. The reduction peak of Co3O4 to CoO and CoO to Co was similar to the first peak (around 333 °C) and the second peak (around 393 °C) in the TPR data, respectively.40 It was reported that PdO was reduced to Pd metal at around 120 °C in a Pd/Co3O4 catalyst41 but a reduced peak was not found at that temperature because the Pd amount was extremely small. In Fig. 3, the reduction temperature of each catalyst was shifted to the lower temperature with the increasing Pd amount for both of the reduction peaks. For the Co–Pd(0.04) catalyst, the first peak was shifted from about 333 °C to 233 °C and the second peak was shifted to 308 °C from 393 °C, to the direction of low temperature compared to the Pd-free case.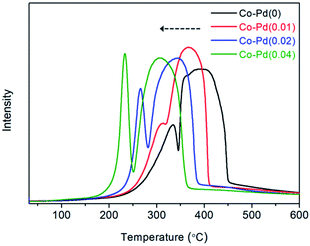 | ||
| Fig. 3 Catalytic H2-TPR of calcined Co–Pd catalysts. Measurement conditions: ramping rate 10 °C min−1, 5.0% H2/Ar 30 sccm. | ||
The peak shift of the Co–Pd catalysts to the low temperature in TPR means that the Pd-inserted catalysts were more easily reduced than the Pd-free catalyst. This TPR result was in good agreement with the XRD data (Fig. 1), which showed the difference in the degree of catalyst reduction depending on the presence of Pd. The Co–Pd(0.04) catalyst was completely reduced to cobalt metal after the catalyst reduction (activation) whereas the inactive cobalt oxide phase still remained for the Co–Pd(0) catalyst, as shown in Fig. 1A and B.
The cobalt metal is an active site for the hydrogenation and dehydrogenation steps in the reductive amination.7,34 When the reduced spent catalyst to the cobalt metal was used to confirm the catalyst activity in a long term test, the catalyst activity lasted for a long time over at least 15 cycles.1 As shown in Fig. 3, the addition of Pd to the Co catalysts led to improved catalyst reduction to the Co metal, which could positively affect the hydrogenation and dehydrogenation steps, consequently enhancing the catalytic activity toward PEA as shown in Fig. 2.
3.3. Inhibited formation of cobalt nitride
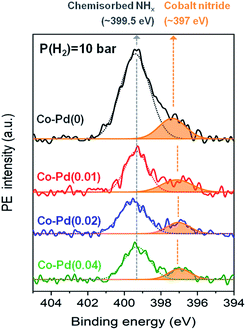
Cobalt nitride is considered to be an inactive species for reductive amination.7,12 Ammonia strongly adsorbs on the cobalt metal during the reaction, which can form cobalt nitride and decrease the catalytic activity of hydrogenation and dehydrogenation in the reductive amination.7,34 In Fig. 2, the PEA amine yield for the Pd-free Co–Pd(0) catalyst was shown to be significantly low compared to the Co–Pd catalysts, thus it is necessary to determine what factors influence this decrease in the catalytic activity. In order to check if decreasing the Pd amount affected the formation of the cobalt nitride, XPS analyses were conducted for the spent catalyst after the reaction. N 1s peaks in each sample were compared to estimate the relative amount of formed cobalt nitride by dividing the N 1s peak area by the normalized Co 2p peak area (771 eV to 812 eV). Each Co peak area was almost the same after normalization of the peaks (refer to Fig. S8†). Fig. 4 shows that the Pd-incorporated Co catalysts had a smaller amount of total nitrogen adsorbed than the Pd-free cobalt catalyst at P(H2) = 10 bar in the XPS N 1s data. It is known that the peak at around 397 eV is assigned to cobalt nitride42,43 and the peak at around 399.5 eV indicates nitrogen from NHx or N2 chemisorbed on the catalyst.44–46 As shown in Fig. 4, cobalt nitride remarkably appeared at around 397 eV for the Co–Pd(0) catalyst, whereas the peak intensity of cobalt nitride gradually decreased with the addition of more Pd to the catalysts at P(H2) = 10 bar. Thus, this result in XPS N 1s supports Pd plays an important role in inhibiting the formation of cobalt nitride through the efficient hydrogen utilization. Also, XPS N 1s data had a very close relation to the result of the catalytic activity test for PEA, which showed an increase in the PEA amine yield with the increasing Pd amount in Fig. 2.Besides, the peak representing chemically adsorbed NHx at around 399.5 eV of the Co–Pd(0) catalyst was larger than any other Co–Pd catalysts at P(H2) = 10 bar as shown in Fig. 4. It was also due to the less efficient hydrogen utilization for the Pd-free Co–Pd(0) catalyst. NH3 occupied the surface of the catalyst by depleting hydrogen and a large amount of NH3 was chemically adsorbed on the Co–Pd(0) catalyst as well, judging from the peak at around 399.5 eV in XPS N 1s (refer to Fig. S9†). Note that the Co–Pd(0) catalyst has slightly smaller amount of cobalt nitride (around 397 eV) at P(H2) = 0 bar (Fig. S9†) than at P(H2) = 10 bar (Fig. 4), which was ascribed to more residual cobalt oxide found at P(H2) = 0 bar than at P(H2) = 10 bar (refer to Fig. S3 and S10†).
When increasing hydrogen partial pressure to P(H2) = 20 bar, the formation of cobalt nitride was diminished compared to that of P(H2) = 10 bar (Fig. 4 and refer to Fig. S11†). However, an increase in the hydrogen pressure did not lead to complete removal of the cobalt nitride formation, especially for Co–Pd(0) catalyst, showing the peak for residual cobalt nitride at around 397 eV (refer to Fig. S11†). It is thus necessary to come up with an alternative way to decrease the formation of cobalt nitride, and the addition of Pd to the cobalt catalyst provides a means of inhibiting cobalt nitride formation. The Co–Pd(0) catalyst at P(H2) = 20 bar (Fig. S11†) still had large cobalt nitride formation in spite of having an insufficient cobalt metal source (XRD in Fig. 1A and C), whereas the cobalt catalysts including Pd showed relatively a small amount of cobalt nitride. Also the amount of cobalt nitride in the Co–Pd(0) catalyst formed at P(H2) = 20 bar was larger than that of the Co–Pd(0.02) and Co–Pd(0.04) catalysts at P(H2) = 10 bar in Fig. 4. The reductive amination of polypropylene glycol (PPG) is known to require high reaction pressure for the PEA synthesis.13,47 Thus, excess introduction of hydrogen is not an effective way of preventing the formation of cobalt nitride. Hydrogen could be more effectively utilized in the Pd inserted cobalt catalysts than in a pure Co catalyst, as shown in Fig. 4. Thus it will be worthwhile to investigate how a small amount of Pd can inhibit the formation of cobalt nitride and consequently enhance the catalytic activity toward PEA.
3.4. Origin of Pd effect
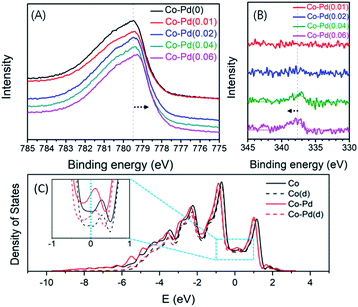
XPS was employed to check if there was a change in the electron density of Co contributed by Pd addition in the fresh bimetallic Co–Pd catalysts calcined at 600 °C. Fig. 5A shows that with an increasing Pd amount, the binding energy of the core electrons in Co was shifted to low binding energy in the XPS Co 2p results. For example, the binding energy of the core level electrons in Co 2p for the Co–Pd(0) catalyst was 779.49 eV, but the binding energy for Co–Pd(0.01), Co–Pd(0.02), Co–Pd(0.04), and Co–Pd(0.06) catalysts was 779.43 eV, 779.40 eV, 779.37 eV, and 779.29 eV, respectively. It is known that this chemical shift in the core level can be caused by the change in the electron density of the valence band electrons.48,49 It reflects that the electron density of the valence electrons for Co becomes higher by increasing the Pd amount.
The XPS results showed that there was a chemical shift to low binding energy of the core level electrons in Co 2p by increasing the Pd amount, which was attributed to the increase in the electron density contributed by the valence electrons in Co such as 3d74s2. In addition, it was noted for the Co–Pd(0.04) and Co–Pd(0.06) catalysts that the chemical shift by 0.45 eV to the high binding energy direction appeared in the XPS Pd 3d results, as shown in Fig. 5B, while the binding energy in Co 2p moved to the negative direction. The chemical shift in Co 2p and Pd 3d occurred in the opposite direction to each other. The peak of Pd 3d in XPS was not seen in the other catalysts such as Co–Pd(0.01) and Co–Pd(0.02) because the amount of palladium was extremely low (around 0.01 and 0.02 wt%, respectively). The metal–metal bond between Cu and Pd can lead to a flow of electron density from Pd to Cu50 and the photoelectron binding-energy for Cu and Pd was shifted to negative and positive, respectively.51,52 It was confirmed that the chemical shift in both Co and Pd was caused by the interaction between Co and Pd, causing the electrons to move from Pd to Co from the XPS data, as shown in Fig. 5.
These XPS results were confirmed further by DFT calculations. As shown in Fig. 5C, it is clear that almost every density of states comes from d orbitals of Co in both catalysts. However, near the Fermi level, the density of states for d orbitals of Co in the Co–Pd catalyst slightly increased with the addition of trace amounts of Pd, suggesting that the Co–Pd catalyst has higher electron density and more electrons could be moved than the pure Co catalyst. These calculation results further support that the electron density near the Fermi level in the valence band increased with the incorporation of a trace amount of Pd into the Co catalyst, corresponding to the core level shift in the Co 2p peaks of the XPS results.
It is known that with increasing d-orbital occupancy, H2 desorption can easily occur because the occupied d-band will have fewer empty orbitals available for bonding with hydrogen.53–55 According to the KUBAS interaction, filled electrons in the σ bond of the H–H union are donated to the vacant metal d orbital and then electrons in a filled d orbital of metal are back-donated to an unfilled anti-bonding orbital (σ*) of hydrogen.56,57
The decreased electron transfer from the σ bond of hydrogen to the empty orbital of metal thus can cause weak binding of hydrogen with metal. In addition, if the back donation to σ* increases, it can facilitate breakup of the molecular hydrogen bond into two atomic hydrogens, forming two M–H bonds.57 Fig. 5 shows that the electron density in Co was increased by the addition of Pd from the XPS results and the electronic calculation results. Thus, it is expected that hydrogen can be desorbed easily because H2 is weakly bonded to cobalt through the reduction in the empty orbital in Co. Also, molecular hydrogen easily splits to form two atomic hydrogens due to the overpopulation of electrons in σ* of hydrogen through the strong back donation from cobalt.
Fig. 6A presents the H2-TPD results to confirm whether the addition of Pd into Co has the effect of lowering hydrogen adsorption energy. H2 adsorption was carried out at around 130 °C, which had the highest H2 adsorption amount, and it was found that the peak temperature of H2 desorption in each Co–Pd catalyst gradually decreased with an increasing Pd amount. For the Co–Pd(0.04) catalyst, the desorption temperature was about 20 °C lower than the Co–Pd(0) catalyst. In addition, a H2-TPD test was also carried out for the Co–Pd catalysts reduced from cobalt nitride to reflect the actual experiment condition. Cobalt nitride, which was formed at 230 °C in the presence of NH3, was reduced to cobalt metal at the lower temperature than 220 °C in the presence of H2 (refer to Fig. S13†). For these Co–Pd catalysts reduced from cobalt nitride, H2 was adsorbed at 130 °C and then H2-TPD was implemented by using Ar as a carrier gas. The desorption peak was further shifted (refer to Fig. S14†) compared to that of the H2-TPD results in Fig. 6A with an increasing amount of Pd.
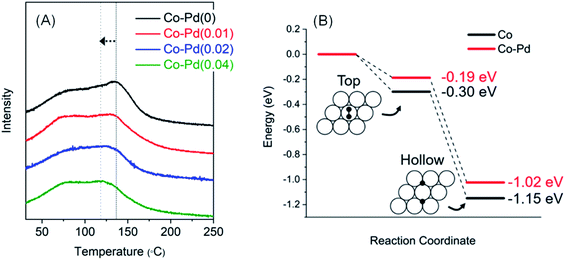 | ||
| Fig. 6 H2-TPD for Co–Pd catalysts that H2 was adsorbed at 130 °C. Pretreatment and measurement conditions are the same as in Fig. S12† (A), DFT calculation result for zero point energy corrected H2 adsorption energies on Co and Co–Pd(0001) surfaces. White and black circles indicate cobalt and hydrogen atom, respectively (B). | ||
For the Co–Pd(0.04) catalyst, its desorption temperature was about 28 °C lower than that of the Co–Pd(0) catalyst (Fig. S14†), meaning that H2 can be more quickly desorbed from the metal surface. From these results in Fig. 6A (also refer to Fig. S14†), Pd helped lower the H2 desorption temperature compared to the Pd-free Co catalyst. The adsorption energy decreased with increasing occupancy of d-orbital in the metal because the filled d-orbital has fewer vacant orbitals that can receive electrons from the σ bond of the H–H union.53–55 It thus causes weak binding of H2 with the metal. For the Co–Pd catalyst, since Co had high electron density by Pd, it had less empty orbitals available for bonding with hydrogen, resulting in easy H2 desorption from Co.
Also, DFT simulations were carried out to verify the origin of facile hydrogen desorption in the Co–Pd catalysts. For the calculation, both the top and hcp/fcc hollow site adsorption are considered, and the adsorption energies of a hydrogen molecule on the metal surfaces are calculated by using the following equation:
| ΔEads = Eslab+adsorbates − (Eslab + EH2) | (1) |
The resulting adsorption energies using the p(3 × 3) supercell of Co and Co–Pd(0001) surfaces are shown in Fig. 6B. The zero point energy corrected adsorption energies for Co(0001) are −0.30 and −1.15 eV at the top and hcp/fcc hollow sites, which are slightly different by ∼0.1 eV from the results of prior studies,58,59 but similar to another result.60 However, when a trace amount of Pd was added to Co, the adsorption energies are calculated as −0.19 and −1.02 eV, which are 0.11 and 0.13 eV lower than the pure Co catalyst. These results indicate that hydrogen atoms are more weakly bound and can be desorbed more quickly from the Co–Pd surface than Co. It therefore can be considered that the fast desorption kinetics of hydrogen from the metal surface may contribute to high catalytic activity of the Co–Pd catalyst, which mainly originates from weaker binding of hydrogen atoms than in the pure Co catalyst.
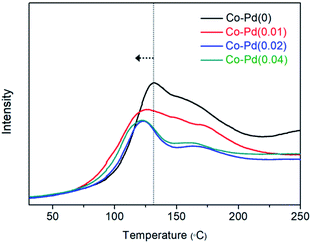
Fig. 7 also shows that H2 adsorption for the Co–Pd catalysts containing Pd proceeded at lower temperature than that for Co–Pd(0) from the peak temperature positions. While the peak temperature for Co–Pd(0) was around 131 °C, the peak temperature for the Co–Pd catalysts containing Pd was about 121 °C, around 10 °C lower than that for the Co–Pd(0) catalyst. It is known that molecular hydrogen can be adsorbed and desorbed at extremely low temperature below 30 K.18,61 These adsorption peaks in Fig. 7 therefore do not indicate molecular hydrogen adsorption but rather dissociative hydrogen adsorption. In addition, the shift to lower temperature of hydrogen adsorption for the Co–Pd catalysts means that atomic hydrogen was more easily adsorbed through the H2 dissociation process than that of the Co–Pd(0) catalyst. Because atomic hydrogen adsorption should come with the dissociation of molecular hydrogen, the Co–Pd catalysts containing Pd were able to efficiently activate the dissociation of H2.
This shift to lower temperature of hydrogen adsorption was prominently found in the Co–Pd catalysts containing cobalt nitride (refer to Fig. S15†). In the actual PEA reaction, H2 can be adsorbed on the cobalt metal that is reduced from cobalt nitride as-formed. In order to reflect the actual experiment conditions, a H2 adsorption test was also carried out for the Co–Pd catalysts having cobalt nitride formed through introducing 5.0% NH3/He to the reduced cobalt at 230 °C for 0.5 h (refer to Fig. S13† to confirm whether cobalt nitride was formed). Separately, it was confirmed that cobalt nitride was already reduced to cobalt metal under the H2 environment at temperature lower than 220 °C for the Co–Pd(0) catalyst (Fig. S13†). Thus the peaks existed above 220 °C (Fig. S15†) indicate hydrogen adsorption.
For the Co–Pd(0) catalyst, the main peak attributed to the H2 adsorption on cobalt metal appeared at around 300 °C, but the other catalysts including Pd had a main peak assigned to H2 adsorption at about 242–254 °C. Under the condition that cobalt nitride can be formed, the addition of a trace amount of Pd to the cobalt catalysts brought a remarkable shift of the peak for H2 adsorption to lower temperature by higher than 60 °C, indicating that Pd addition was able to help dissociate molecular hydrogen efficiently.
From the results in Fig. 7 (refer to Fig. S15†), this improved H2 dissociation ability may be ascribed to the well-known spillover effect by precious metals such as Pd and Pt.18 However, there were still some questions regarding whether extremely low Pd amounts actually enabled large amounts of H2 to be dissociated enough via only the spillover effect. It was found that these results from the H2-temperature programmed adsorption test were in close agreement with the chemical shift to lower binding energy of Co 2p in XPS with increasing Pd amounts. Pd addition into Co caused an increase in the electron density of valence electrons of Co, which means that Co was quite capable of back-donating electrons to the anti-bonding orbital of hydrogen, resulting in easy hydrogen dissociation into two atomic hydrogens. The Co catalysts containing Pd activated molecular hydrogen, as found in the results of atomic hydrogen adsorption, at lower temperature than the Pd-free cobalt catalyst.
It is known that the catalysts that bind H weakly often have a high activation barrier for H2 dissociation,18,19,26 which means it is difficult to meet the two requirements of facile H2 adsorption and desorption. Because the catalysts with improved H2 desorption ability have weak binding energy through receiving a relatively small amount of electrons from hydrogen,53–55 they can back donate just a small amount of electrons to the anti-bonding orbital (σ*) of hydrogen, which will have difficulty in dissociating hydrogen.56,57 For the Co–Pd catalysts, although fewer electrons were donated to Co from the σ bond in the H–H union, Co was able to properly donate electrons to the anti-bonding orbital of H2 to dissociate molecular hydrogen while compensating for the deficient electrons ascribed to receiving fewer electrons from H2 because Co has relatively high electron density by Pd.
Thus, it was confirmed from the H2 adsorption test (Fig. 7) that the Co–Pd catalysts were able to enhance the H2 dissociation ability in spite of the poor environment of accepting fewer electrons from H2. Pd added in a small quantity not only enabled the Co–Pd catalysts to have a facile H2 desorption ability but also helped back-donate electrons for the improved H2 dissociation. Therefore, the fast adsorption–desorption kinetics from Fig. 6 and 7 will play an important role in utilizing hydrogen for reducing inactive species such as cobalt oxide and cobalt nitride to cobalt metal as an active site.
In this work, non-supported bimetallic Co–Pd catalysts were mainly studied to investigate the effect of a trace amount of Pd in Co catalysts on reductive amination. In order to develop more economical catalytic system, the amount of active materials should be reduced by an increased metal dispersion through various kinds of support. Also, if a precious metal such as Pd can be replaced by another non-precious metal, it can help develop a novel catalyst for the competitive reductive amination.
4. Conclusions
The cobalt catalysts including extremely trace amounts of Pd showed enhanced catalytic activity toward PEA compared to the Pd-free cobalt catalyst. Addition of Pd into Co helped remarkably reduce cobalt oxide to the active cobalt metal and suppressed the formation of cobalt nitride inactive to the PEA synthesis. The insertion of a trace amount of Pd in Co thus could be an alternative way of efficiently decreasing cobalt nitride, rather than increasing the reaction pressure. The reducing ability and the inhibited cobalt nitride formation were elucidated by the following two factors. First, the addition of Pd resulted in improving H2 desorption. The Pd inserted cobalt catalyst showed low H2 desorption temperature compared to the Pd-free cobalt catalyst, which was ascribed to low adsorption energy due to the increase of occupancy in the Co valence orbital. Second, the Pd inserted cobalt catalysts showed an enhanced effect of activating hydrogen through increment of the electron density in valence electrons of Co, which resulted in strengthening back-donation of electrons to the anti-bonding orbital in hydrogen. Increasing back-donation to the anti-bonding orbital caused molecular hydrogen to break up into two atomic hydrogens, and this effect accompanied lowering hydrogen adsorption temperature. The facile H2 desorption and enhanced H2 activation are key properties for the Pd-inserted cobalt catalysts. These features will play a remarkable role in reducing cobalt oxide to cobalt metal and suppressing cobalt nitride formation by employing dissociated hydrogen desorbed on the surface of the Pd inserted cobalt catalysts, which will enhance the PEA yield and help in lowering the hydrogen pressure in the PEA reaction.Conflicts of interest
There are no conflicts to declare.Acknowledgements
The DFT work is supported by the Global PhD Fellowship Program (NRF-2019H1A2A1076070) and the Energy Clouds Program (NRF-2019M3F2A1072237) funded by National Research Foundation of Korea.Notes and references
- K. Kim, Y. Choi, H. Lee and J. W. Lee, Appl. Catal., A, 2018, 568, 114–122 CrossRef CAS
.
- L. Ma, L. Yan, A. H. Lu and Y. Ding, RSC Adv., 2018, 8, 8152–8163 RSC
.
- E. Boz, N. Tüzün and M. Stein, RSC Adv., 2018, 8, 36662–36674 RSC
.
- K. Kim, D. W. Kang, H. G. Im, Y. Choi and J. W. Lee, ACS Omega, 2020, 5, 26545–26550 CrossRef CAS
.
- Y. Kita, S. Kai, L. B. Supriadi Rustad, K. Kamata and M. Hara, RSC Adv., 2020, 10, 32296–32300 RSC
.
- C. R. Ho, V. Defalque, S. Zheng and A. T. Bell, ACS Catal., 2019, 9, 2931–2939 CrossRef CAS
.
- G. Sewell, C. O. Connor and E. Van Steen, Appl. Catal., 1995, 125, 99–112 CrossRef CAS
.
- K. I. Shimizu, K. Kon, W. Onodera, H. Yamazaki and J. N. Kondo, ACS Catal., 2013, 3, 112–117 CrossRef CAS
.
- J. H. Park, E. Hong, S. H. An, D. H. Lim and C. H. Shin, Korean J. Chem. Eng., 2017, 34, 2610–2618 CrossRef CAS
.
- E. Hong, S. Bang, J. H. Cho, K. D. Jung and C. H. Shin, Appl. Catal., A, 2017, 542, 146–153 CrossRef CAS
.
- A. Baiker, D. Monti and Y. S. Fan, J. Catal., 1984, 88, 81–88 CrossRef CAS
.
- J. H. Cho, J. H. Park, T. S. Chang, G. Seo and C. H. Shin, Appl. Catal., A, 2012, 417–418, 313–319 CrossRef CAS
.
-
D. Buehring, A. Gallas, M. Glos, K. Raab, F.-X. Scherl and O. Wachsen, US Pat., US7696385B2, 2015
.
- D. Ruiz, A. Aho, T. Saloranta, K. Eränen, J. Wärnå, R. Leino and D. Y. Murzin, Chem. Eng. J., 2017, 307, 739–749 CrossRef CAS
.
- T. Cuypers, P. Tomkins and D. E. De Vos, Catal. Sci. Technol., 2018, 8, 2519–2523 RSC
.
- A. S. Dumon, T. Wang, J. Ibañez, A. Tomer, Z. Yan, R. Wischert, P. Sautet, M. Pera-Titus and C. Michel, Catal. Sci. Technol., 2018, 8, 611–621 RSC
.
- M. Ousmane, G. Perrussel, Z. Yan, J. M. Clacens, F. De Campo and M. Pera-Titus, J. Catal., 2014, 309, 439–452 CrossRef CAS
.
- F. R. Lucci, M. T. Darby, M. F. G. Mattera, C. J. Ivimey, A. J. Therrien, A. Michaelides, M. Stamatakis and E. C. H. Sykes, J. Phys. Chem. Lett., 2016, 7, 480–485 CrossRef CAS
.
- P. J. Robinson and K. A. Holbrook, Nature, 1995, 376, 238–240 CrossRef
.
- T. Gomez, E. Florez, J. A. Rodriguez and F. Illas, J. Phys. Chem. C, 2011, 115, 11666–11672 CrossRef CAS
.
- A. Y. Khodakov, W. Chu and P. Fongarland, Chem. Rev., 2007, 107, 1692–1744 CrossRef CAS
.
- J. Okal, M. Zawadzki, L. Kepiński, L. Krajczyk and W. Tylus, Appl. Catal., A, 2007, 319, 202–209 CrossRef CAS
.
- R. C. Reuel and C. H. Bartholomew, J. Catal., 1984, 85, 63–77 CrossRef CAS
.
- L. Guczi, Z. Schay, G. Stefler and F. Mizukami, J. Mol. Catal. A: Chem., 1999, 141, 177–185 CrossRef CAS
.
- M. B. Boucher, B. Zugic, G. Cladaras, J. Kammert, M. D. Marcinkowski, T. J. Lawton, E. C. H. Sykes and M. Flytzani-Stephanopoulos, Phys. Chem. Chem. Phys., 2013, 15, 12187–12196 RSC
.
- F. Li, G. F. Han, H. J. Noh, J. P. Jeon, I. Ahmad, S. Chen, C. Yang, Y. Bu, Z. Fu, Y. Lu and J. B. Baek, Nat. Commun., 2019, 10, 1–7 CrossRef
.
- J. Greeley and M. Mavrikakis, Nat. Mater., 2004, 3, 810–815 CrossRef CAS
.
- P. Giannozzi, S. Baroni, N. Bonini, M. Calandra, R. Car, C. Cavazzoni, D. Ceresoli, G. L. Chiarotti, M. Cococcioni, I. Dabo, A. Dal Corso, S. De Gironcoli, S. Fabris, G. Fratesi, R. Gebauer, U. Gerstmann, C. Gougoussis, A. Kokalj, M. Lazzeri, L. Martin-Samos, N. Marzari, F. Mauri, R. Mazzarello, S. Paolini, A. Pasquarello, L. Paulatto, C. Sbraccia, S. Scandolo, G. Sclauzero, A. P. Seitsonen, A. Smogunov, P. Umari and R. M. Wentzcovitch, J. Phys.: Condens. Matter, 2009, 21, 395502 CrossRef
.
- P. E. Blöchl, Phys. Rev. B: Condens. Matter Mater. Phys., 1994, 50, 17953–17979 CrossRef
.
- B. Hammer, L. B. Hansen and J. K. Nørskov, Phys. Rev. B: Condens. Matter Mater. Phys., 1999, 59, 7413–7421 CrossRef
.
-
W. D. Callister and D. G. Rethwisch, Fundamentals of materials science and engineering: An Integrated Approach, Wiley, Hoboken, 2018 Search PubMed
.
- H. J. Monkhorst and J. D. Pack, Phys. Rev. B: Solid State, 1976, 13, 5188–5192 CrossRef
.
- M. Methfessel and A. T. Paxton, Phys. Rev. B: Condens. Matter Mater. Phys., 1989, 40, 3616–3621 CrossRef CAS
.
- A. Baiker, Ind. Eng. Chem. Prod. Res. Dev., 1981, 20, 615–618 CrossRef CAS
.
-
J. Coates, in Encyclopedia of Analytical Chemistry: Applications, Theory and Instrumentation, John Wiley & Sons, Hoboken, 2006 Search PubMed
.
- Y. K. Kim, G. M. Kim and J. W. Lee, J. Mater. Chem. A, 2015, 3, 10919–10927 RSC
.
- J. Zhang, Y. Zhao, D. L. Akins and J. W. Lee, J. Phys. Chem. C, 2010, 114, 19529–19534 CrossRef CAS
.
- Y. Zheng, Y. Yu, H. Zhou, W. Huang and Z. Pu, RSC Adv., 2020, 10, 4490–4498 RSC
.
- D. Yu, X. Zhong, D. Liu and Y. Liang, RSC Adv., 2019, 9, 32232–32239 RSC
.
- B. Viswanathan and R. Gopalakrishnan, J. Catal., 1986, 99, 342–348 CrossRef CAS
.
- G. Ercolino, P. Stelmachowski, G. Grzybek, A. Kotarba and S. Specchia, Appl. Catal., B, 2017, 206, 712–725 CrossRef CAS
.
- A. N. Cloud, L. M. Davis, G. S. Girolami and J. R. Abelson, J. Vac. Sci. Technol., A, 2014, 32, 020606 CrossRef
.
- K. Hada, M. Nagai and S. Omi, J. Phys. Chem. B, 2001, 105, 4084–4093 CrossRef CAS
.
- A. Byeon, S. Baik and J. W. Lee, J. CO2 Util., 2018, 26, 28–35 CrossRef CAS
.
- O. Diwald, T. L. Thompson, T. Zubkov, E. G. Goralski, S. D. Walck and J. T. Yates, J. Phys. Chem. B, 2004, 108, 6004–6008 CrossRef CAS
.
- G. M. Kim, S. Baik and J. W. Lee, RSC Adv., 2015, 5, 87971–87980 RSC
.
-
J. Larkin and T. Renken, US Pat., US4766245A, 1988
.
-
D. N. Sathyanarayana, Electronic absorption spectroscopy and related techniques, University Press, Hyderabad, 2001 Search PubMed
.
- S. Tardio and P. J. Cumpson, Surf. Interface Anal., 2018, 50, 5–12 CrossRef CAS
.
- G. Liu, T. P. St. Clair and D. W. Goodman, J. Phys. Chem. B, 1999, 103, 8578–8582 CrossRef CAS
.
- E. J. Cho, S. Lee, S. J. Oh, M. Han, Y. S. Lee and C. N. Whang, Phys. Rev. B: Condens. Matter Mater. Phys., 1995, 52, 16443–16450 CrossRef CAS
.
- R. Cole, N. Brooks and P. Weightman, Phys. Rev. B: Condens. Matter Mater. Phys., 1997, 56, 12178–12182 CrossRef CAS
.
-
J. F. Danielli, K. G. Pankhurst and A. C. Riddiford, Recent progress in surface science, Elsevier, Amsterdam, 2013 Search PubMed
.
- L. M. Falicov and G. A. Somorjai, Proc. Natl. Acad. Sci. U. S. A., 1985, 82, 2207–2211 CrossRef CAS
.
- I. Toyoshima and G. A. Somorjai, Catal. Rev., 2006, 19, 105–159 CrossRef
.
-
G. J. Kubas, Metal Dihydrogen and s-Bond Complexes: Structure, Theory, and Reactivity, Springer Science & Business Media, Berlin, 2001 Search PubMed
.
- G. J. Kubas, Science, 2006, 314, 1096–1097 CrossRef CAS
.
- P. Van Helden, J. A. Van Den Berg and C. J. Weststrate, ACS Catal., 2012, 2, 1097–1107 CrossRef CAS
.
- M. Yu, L. Liu, Q. Wang, L. Jia, B. Hou, Y. Si, D. Li and Y. Zhao, Int. J. Hydrogen Energy, 2018, 43, 5576–5590 CrossRef CAS
.
- J. Greeley and M. Mavrikakis, J. Phys. Chem. B, 2005, 109, 3460–3471 CrossRef CAS
.
- T. Sugimoto and K. Fukutani, Phys. Rev. Lett., 2014, 112, 1–5 CrossRef
.
Footnote |
| † Electronic supplementary information (ESI) available. See DOI: 10.1039/d0ra10033a |
| This journal is © The Royal Society of Chemistry 2020 |

