 Open Access Article
Creative Commons Attribution 3.0 Unported Licence
Isothermal kinase-triggered supramolecular assemblies as drug sensitizers†
Dongdong
Liu
ab,
Zhe
Miao
a,
Chengling
Wu
a,
Fangfei
He
a,
Peng
Ren
c,
Shuo
Bai
 c,
Xingyu
Jiang
 abd and
Yuan
Gao
 *ab
*ab
aCAS Center for Excellence in Nanoscience, CAS Key Laboratory of Biomedical Effects of Nanomaterials and Nanosafety, National Center for Nanoscience and Technology, Beijing 100190, P. R. China. E-mail: gaoy@nanoctr.cn
bSino-Danish College, University of Chinese Academy of Sciences, Beijing 100049, P. R. China
cInstitute of Process Engineering, Chinese Academy of Sciences, Beijing 100190, P. R. China
dDepartment of Biomedical Engineering, Southern University of Science & Technology, Shenzhen 518055, Guangdong, P. R. China
First published on 6th December 2019
Abstract
Protein kinases, the main regulators of a vast map of cellular processes, are the most attractive targets in drug discovery. Despite a few successful examples of protein kinase inhibitors, the drug discovery strategy of downregulating protein kinase activity has been quite limited and often fails even in animal models. Here, we utilize protein kinase A (PKA) activity to design PKA-triggered supramolecular assemblies with anticancer activities. Grafting a suitable peptide to PNIPAM raises the critical temperature of the LCST polymer above body temperature. Interestingly, the corresponding phosphorylated polymer has a critical temperature below body temperature, making this peptide-appended PNIPAM a suitable polymer for the PKA-triggered supramolecular assembly process. PKA-triggered assembly occurs selectively in PKA-upregulated MCF-7 cells, which disturbs the cytoskeleton and sensitizes cancer cells against doxorubicin. The chemosensitization is also observed in vivo to identify effective tumor inhibitors with satisfactory biocompatibility. Overall, this phosphorylation-induced (in principle, PKA-catalyzed) supramolecular assembly opens up a promising chemotherapy strategy for combating kinase-upregulated cancer.
Introduction
Protein kinases, which constitute almost 2% of human genes, regulate a vast map of cellular processes by mediating the phosphorylation of their substrates.1 Because of their central role in signal transduction, protein kinases play causal roles in cancers due to mutations or dysregulation.2,3 Therefore, it is a straightforward and attractive strategy to search for protein kinase inhibitors for anticancer purposes,4–6 and several drugs have been established.7 However, given the strikingly large family of protein kinases, there is a large amount of cross-talk between the enzymes and their substrates (redundant pathways),8 making it an arduous task to discover protein kinase inhibitors.9,10Alternatively, enzyme activity could also be used to control cell fate via a dynamic process called enzyme-instructed supramolecular self-assembly (EISA). Differentiated by the abnormal activities of certain enzymes in cancer cells compared to normal cells, EISA could selectively occur in or around cancer cells and has shown emerging anticancer activities.11–14 By targeting the over-expression of secreted or membrane-bound hydrolases (e.g., alkaline phosphatase, MMPs), the extracellular nanofiber network could block the mass exchange of metabolites in cancer cells.15 With additional targeting moieties, such as cholesterol or triphenylphosphine (TPP), cancer-specific EISA could further affect the lipid rafts16 or disrupt the normal function of mitochondria.17 Moreover, EISA has demonstrated the unique advantage of overcoming drug-resistance issues,18 which makes it an emerging anticancer strategy.14,19 Nevertheless, thus far, most of the established EISA approaches share a common strategy in which the enzyme converts hydrophilic precursors to hydrophobic assembly building blocks (e.g., phosphatase catalyzed dephosphorylation)13,20 and initiates the subsequent self-assembly in situ. As the inverse process of dephosphorylation, the phosphorylation that is naturally mediated by a kinase usually induces the disassembly process.21,22 Therefore, there has been no example of kinase-triggered self-assembly to control cell fate.
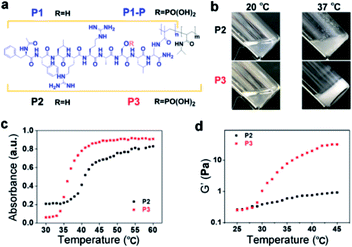
Since Protein Kinase A (PKA) is closely related to breast cancer,23 here, we demonstrate a PKA-triggered isothermal self-assembly process. We designed a nonapeptide derivative (Ac-FFLRRASL-Dpr(COC(CH3)![[double bond, length as m-dash]](https://www.rsc.org/images/entities/char_e001.gif) CH2)–NH2, P1) containing a diphenylalanine and a PKA substrate peptide.24 A co-polymerization of P1 and NIPAM yielded a thermoresponsive polymer P2 with a lower critical solution temperature (LCST). The critical temperature of P2 was approximately 41.0 °C. Importantly, the corresponding phosphorylated polymer (P3) had a lower critical temperature of 36.5 °C, which allowed P3 to self-assemble and form a hydrogel at 37.0 °C. Therefore, the decrease in critical temperature upon phosphorylation made P2 a suitable precursor for kinase-induced self-assembly under physiological conditions (e.g., 37.5 °C). Incubation with P2 induced the selective disturbance of F-actins and microtubules in MCF-7 cells but not MCF-10A cells. Meanwhile, this disturbance of cytoskeletons in MCF-7 cells could be prevented via the addition of the kinase inhibitor. The correlation between the disturbances and the over-expression of PKA indicated the formation of PKA-instructed assemblies in MCF-7 cells. Furthermore, we identified the emerging anticancer activity of such assemblies, which acted as a sensitizer of MCF-7 and NCI/ADR-RES cells to doxorubicin, although there was little enhanced toxicity against MCF-10A cells. Overall, we demonstrated a PKA-triggered EISA model that not only broadened the strategy for EISA construction in situ but also provided a promising method for anticancer chemotherapy (Scheme 1).
CH2)–NH2, P1) containing a diphenylalanine and a PKA substrate peptide.24 A co-polymerization of P1 and NIPAM yielded a thermoresponsive polymer P2 with a lower critical solution temperature (LCST). The critical temperature of P2 was approximately 41.0 °C. Importantly, the corresponding phosphorylated polymer (P3) had a lower critical temperature of 36.5 °C, which allowed P3 to self-assemble and form a hydrogel at 37.0 °C. Therefore, the decrease in critical temperature upon phosphorylation made P2 a suitable precursor for kinase-induced self-assembly under physiological conditions (e.g., 37.5 °C). Incubation with P2 induced the selective disturbance of F-actins and microtubules in MCF-7 cells but not MCF-10A cells. Meanwhile, this disturbance of cytoskeletons in MCF-7 cells could be prevented via the addition of the kinase inhibitor. The correlation between the disturbances and the over-expression of PKA indicated the formation of PKA-instructed assemblies in MCF-7 cells. Furthermore, we identified the emerging anticancer activity of such assemblies, which acted as a sensitizer of MCF-7 and NCI/ADR-RES cells to doxorubicin, although there was little enhanced toxicity against MCF-10A cells. Overall, we demonstrated a PKA-triggered EISA model that not only broadened the strategy for EISA construction in situ but also provided a promising method for anticancer chemotherapy (Scheme 1).
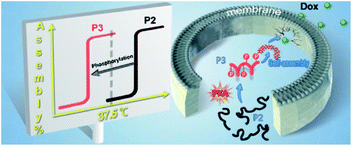 | ||
| Scheme 1 Protein kinase A-triggered intracellular assemblies that can enhance the potency of doxorubicin by weakening the cell membrane. | ||
Results and discussion
Following the typical solid phase peptide synthesis (SPPS) protocol, the peptides P1 and P1-P were synthesized on the Rink Amide AM resin by sequentially conjugating Fmoc–Dpr(ivDde)–OH with suitable Fmoc–amino acids as designed and terminated with the acetyl group (Fig. 1a). After methacryloylation with N-methacryloyloxysuccinimide, the peptide derivative P1/P1-P was purified by reverse-phase high-performance liquid chromatography (RP-HPLC) (Fig. S1 and S2†) and confirmed by electrospray ionization (ESI) MS and 1H-NMR. With ammonium persulfate and N,N,N′,N′-tetramethylethylenediamine as the redox initiators, the co-polymerization of N-isopropyl acrylamide (NIPAM) and P1 in pure water gave the final product of P2 with the molecular weight of Mn = 75 kDa, Mw = 108 kDa, and PDI = 1.4 as determined by gel permeation chromatography (GPC) (Fig. S3†). The molar fraction of P1 within P2 was further identified by 1H-NMR. Calculating the integration of the –CH3 (δ = 1.05 ppm) of N-isopropyl acrylamide and –C6H5 (δ = 6–8 ppm) of phenylalanine gave the composition of 11.7 mol% P1 and 88.3 mol% NIPAM. By replacing P1 with P1-P, P3 was synthesized with a similar polymerization method. GPC revealed its molecular weight to be Mn = 77 kDa, Mw = 136 kDa, and PDI = 1.7 (Fig. S4†). The molar fractions of as-prepared P3 were also identified by 1H-NMR spectroscopy, giving the composition of 11.3 mol% P1-P and 88.7 mol% NIPAM.As a typical LCST thermoresponsive polymer, poly(N-isopropyl acrylamide) (PNIPAM) remains soluble in solution when the temperature is below LCST. When the temperature is above LCST, the coil-to-globule transition occurs, and the homogeneous solution becomes a uniformly milky solution.25 In our molecular design, we introduced the diphenylalanine (FF) motif, which could promote the supramolecular self-assembly process.26,27 Then, we expected supramolecular self-assembly instead of the typical shrinkage of PNIPAM itself.
As shown in Fig. 1b, when heated from 20 °C to 37 °C, the transparent solution of P2 in PBS (2.0 wt%) turned into a cloudy mixture with a large amount of white precipitate. In contrast, the solution of P3 in PBS (2.0 wt%) turned into an opaque hydrogel within 3 min when heated to 37 °C. And the critical gelation concentration of P3 was 6 mg mL−1 (Fig. S5†). The UV-vis absorbance also showed the different temperature-dependent behaviour of P2 and P3. As shown in Fig. 1c, the critical temperature of P2 was 41.0 °C, as determined by the average absorbance at 600 nm between 30 °C and 60 °C.28 In contrast, the critical temperature of P3 was 36.5 °C. Comparing the structural differences between P2 and P3 shows that the decrease in the critical temperature should be attributed to phosphorylation. Usually, phosphorylation would improve the water solubility and thus increase the critical temperature.29 However, in our case, the net charges of P1 and P1-P are +2 and 0. Therefore, phosphorylation eliminated the electrostatic repulsion, which may have decreased the solubility of the P1-P-containing polymer P3 compared to that of P2, resulting in the decrease in the critical temperature.24
In addition, the introduction of diphenylalanine strengthened the aromatic–aromatic interactions among the peptides, possibly promoting the intermolecular interaction and supramolecular self-assembly.30 In addition to the gelation test in a vial, the temperature-dependent gelation behaviour of P2 and P3 (PBS, 1.0 wt%) was monitored using a rheometer (Fig. 1d). In the temperature range of 25 °C to 45 °C (+0.5 °C min−1), the storage modulus (G′) of P3 increased significantly at approximately 27.5 °C. In contrast, the G′ of P2 increased quite gently. Rheological frequency sweep tests of P2 and P3 were also performed at 25.0 °C, 37.5 °C and 42.5 °C. The frequency dependence of G′ and G′′ demonstrated the viscoelastic properties of both P2 and P3.31,32 However, the G′ for P2 reached a maximum at 37.5 °C and dropped above the critical temperature (e.g., at 42.5 °C), while the G′ for P3 increased monotonically (likely to a plateau above the critical temperature) with increasing temperature (Fig. S6†). These results were well correlated with those shown in Fig. 1b, in which P2 formed a precipitate but P3 self-assembled to form a hydrogel.
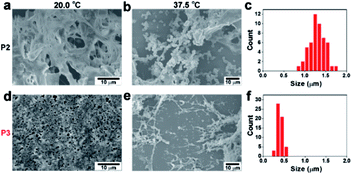
To elucidate the different assembly phenomena between P2 and P3, the nanomorphology of these temperature-dependent assemblies was inspected by scanning electron microscopy (SEM). At 20.0 °C, both P2 and P3 exhibited amorphous structures (Fig. 2a and d). At 37.5 °C, many P2 microparticles with diameters of approximately 1.3 μm emerged (Fig. 2b–c). When the temperature was increased to 42.5 °C, the P2 microparticles grew larger, reaching an average diameter of approximately 1.8 μm (Fig. S7a and b†). Since P3 formed a hydrogel at 37.5 °C, it was not surprising that P3 formed elongated nanofibres instead of granular particles. The diameter of the P3 nanofibres was approximately 350 nm (Fig. 2e and f). The nanofibres expanded to approximately 600 nm at 42.5 °C (Fig. S7c and d†). TEM images can also prove that P2 formed amorphous aggregates, while P3 and PKA phosphorylated P2 form fibril nanostructures, which is similar to the morphology observed in SEM images (Fig. S8†). The temperature variance could also affect the CD signals of P2 and P3. Since the diphenylalanine motif often tended to adopt a β-sheet conformation, P2 gave a negative peak at 213 nm in the soluble state at 37.5 °C. Above the critical temperature, a typical coil-to-globule transition occurred to form microparticles, which resulted in a decrease in the characteristic β-sheet peak at 42.5 °C (Fig. S9b†). In contrast, P3 exhibited a negative peak at 207 nm once the temperature rose above the critical temperature. The shrinkage of the PNIPAM backbone brought peptides closer, which may have enhanced the β-sheet structure and caused a slight blue shifting, as indicated by the CD signal (Fig. S9c†), resulting in nanofiber formation.33 Therefore, at a normal body temperature of approximately 37.5 °C, P2 and P3 formed assemblies with drastically different nanomorphologies, which may result in differentiated biological activities (Vide infra).
To determine if PKA could phosphorylate our designed molecules, the transfer of phosphate from ATP to serine on P1 was determined by NMR spectroscopy and mass spectrometry. The PKA catalytic subunit (bought from Merck), ATP and P1 reacted in Tris–HCl buffer for 4 days, and the mixture was analyzed by analytical HPLC and ESI MS, showing a 76% phosphorylation rate of P1 (Fig. S10–S14†). The emerging peak in the 31P-NMR spectrum could also indicate that PKA can successfully phosphorylate P1 to yield P1-P. Under similar conditions, the PKA catalytic subunit successfully phosphorylated P2 to yield P3 according to the HPLC trace and P-NMR spectrum (Fig. S15, S49 and S50†).
To determine whether intracellular PKA could phosphorylate our designed molecules, we cultured MCF-7 cells and MCF-10A cells with P1 (1.0 mg mL−1) for 24 h. Then, we collected the cell lysates to quantify both P1 and P1-P through LC-MS/MS. As shown in Table 1, the amount of internalized P1 in MCF-7 cells was 3–4 fold more than that in MCF-10A cells, which indicated the higher uptake capability of cancerous cells. The amount of intracellular P1-P was almost 8-fold higher in MCF-7 cells than in MCF-10A cells. Overall, the apparent phosphorylation ratios in MCF-7 and MCF-10A cells were 4.6% and 1.9%, respectively. The higher concentration of P1-P and phosphorylation ratio could be ascribed to the over-expression of PKA in MCF-7 cells23 (Fig. S16†).
| Cell lines | P1/104 cells (nmol) | P1-P/104 cells (nmol) | P1-P/P1 (%) |
|---|---|---|---|
| MCF-7 | 53.13 ± 0.67 | 2.42 ± 0.08 | 4.6% |
| MCF-10A | 16.49 ± 0.28 | 0.32 ± 0.02 | 1.9% |
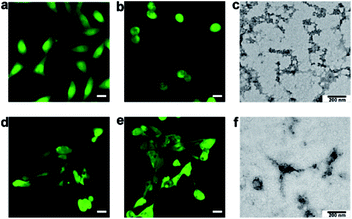
Incubation with P2 selectively induced morphological changes in MCF-7 cells. As shown by a typical cell tracker, 2,5-pyrrolidinedione, the group of MCF-7 cells pre-incubated with 50 μg mL−1P2 for 24 h exhibited fewer intercellular connections than the wild type group (Fig. 3a and b). We also found that the active PKA was 0.25 U mL−1 in MCF-7 cells, 0.04 U mL−1 in MCF-10A cells, and 0.005 U mL−1 in our solution set-up. The much lower activity in vitro thus required a longer time than in living cells to conduct phosphorylation. In contrast, incubation with P2 did not induce an observable change in cell morphology for cells with normal PKA expression, including MCF-10A cells (Fig. 3d and e) and HUVECs (Fig. S17†). In addition, P2 did not affect MCF-7 cells with downregulated PKA activity (e.g., by PKA inhibitor H89) (Fig. S18†)34 or MCF-7 cells with downregulated expression of the PKA catalytic subunit (Fig. S19 and S20†).35 Also, neither P1′ (Fig. S33 and S41†) nor P2′ (Fig. S34 and S43†) induced the rounded cellular morphology of MCF-7 cells (Fig. S21†), which further proved that the phosphorylation was a direct mechanism for P2-mediated effects in cells. After substitution of acetyl with a fluorophore Cy7 to yield P2-Cy7, the confocal images indicated that there was a similar level of fluorescence intensity in both MCF-7 and MCF-10A cells (Fig. S22†). These results indicated that the selective change in the cell morphology of MCF-7 cells was dependent on the upregulated PKA activity. Interestingly, direct treatment with P3 did not affect the shapes of MCF-7 cells (Fig. S23†). This result implied that P3 may not efficiently enter MCF-7 cells, as evidenced by the weak fluorescence after incubation with P3-Cy7 (Fig. S24 and Table S2†). Therefore, P2 should be efficiently phosphorylated inside MCF-7 cells to yield P3, which can then isothermally (at approximately 37.5 °C) assembled intracellularly.
To determine the nanomorphology of intracellular assemblies of P3 in MCF-7 cells, another group of MCF-7 cells pre-incubated with 50 μg mL−1P2 were lysed in DI water.36 As shown in Fig. 3c, there were many self-assembled nanofibers among the MCF-7 cellular fractions. In contrast, there was an absence of self-assembled nanofibers in the cellular fraction of MCF-10A cells pre-incubated with 50 μg mL−1P2 (Fig. 3f). Similarly, no nanofibers were present in the fractions of MCF-7 cells pretreated with P1 or P1-P (50 μg mL−1), since neither P1 nor P1-P self-assembled at this concentration (Fig. S25†). Therefore, P2 was phosphorylated inside MCF-7 cells to yield P3, which self-assembled to form nanofibers and induced cell morphological changes thereafter.
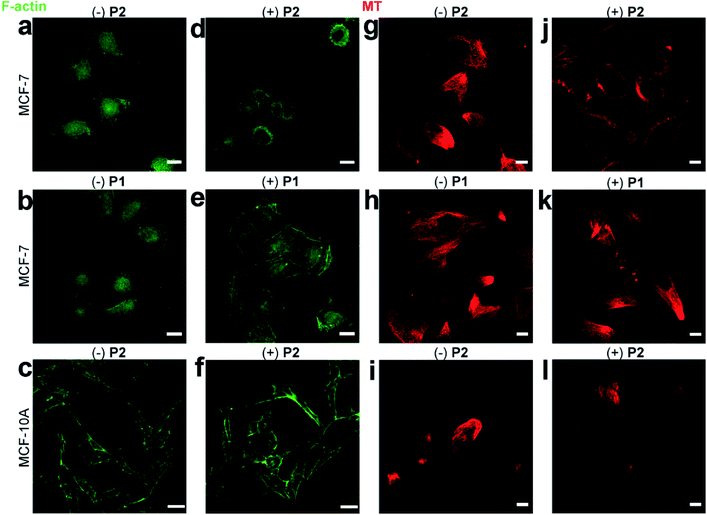
The morphological change in MCF-7 cells was due to the disturbance of cytoskeletons, including F-actins and microtubules.37 The disturbance of F-actins was visualized by FITC-phalloidin staining. Consistent with the rounded MCF-7 cells treated with P2 (Fig. 3b), the F-actin filaments were shortened compared to those of wild-type MCF-7 cells (Fig. 4a and d). Since P1 did not self-assemble, the F-actins in MCF-7 cells pre-incubated with/without P1 remained almost identical (Fig. 4b and e). Additionally, the confocal images demonstrated that the F-actins in MCF-10A cells pre-incubated with/without P2 remained normal (Fig. 4c and f), which was consistent with the normal cell morphology (Fig. 3d and e).
Similarly, the disturbance of microtubules was visualized by Tubulin-Tracker Red staining. Consistent with the rounded cellular morphology of P2-treated MCF-7 cells, the microtubules were also shortened compared to those of wild-type MCF-7 cells (Fig. 4g and j). In contrast, P1 caused little change in the microtubules in MCF-7 cells (Fig. 4h and k). Additionally, the confocal images demonstrated that the microtubules in MCF-10A cells remained normal after incubation with P2 (Fig. 4i and l).
Although phosphorylation of both P1 and P2 required the consumption of ATP, which may affect the homeostasis of the cellular cytoskeleton,38,39 only treatment with P2 induced disturbances in the cytoskeleton. This phenomenon implied that the disturbance in the cytoskeleton was unlikely to be induced by ATP depletion but was dependent on the formation of intracellular assemblies.
Since the cytoskeleton interacts extensively with the membrane,40 the disturbance of the cytoskeleton may have further influence on the membrane integrity. The influence of P2 treatment on the MCF-7 cell membrane integrity was explored with a LIVE/DEAD cell imaging kit.41 The results showed that with P2 treatment, Texas Red not only stains dead cells but also penetrates into the live cells (Fig. S26a†). In contrast, Texas Red did not enter P1-treated MCF-7 cells (Fig. S26b†), P3-treated MCF-7 cells (Fig. S26c†) or P2-treated MCF-10A cells (Fig. S26d†). This observation supported the idea that intracellular self-assembly would increase the MCF-7 cell membrane permeability. The increased membrane permeability of MCF-7 cells will make it easier for P2 to enter the MCF-7 cells and lead to greater vulnerability under stress.
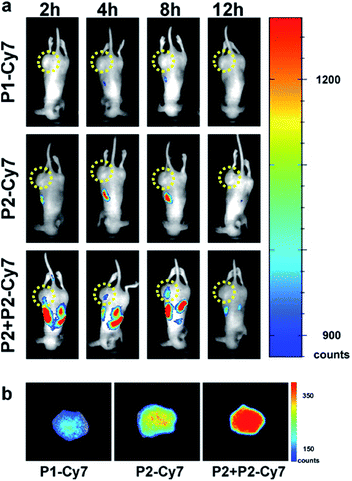
Before the in vitro experiments, we have cultured the MCF-7 cells with P2-Cy7 and P3-Cy7. Compared with P2-Cy7 (Fig. S22a and b†), P3-Cy7 cannot accumulate into the MCF-7 cells efficiently (Fig. S24†). Besides, the culture of MCF-7 cells with P3 did not cause an obvious cell morphology change (Fig. S23†). As P2 showed ideal effects on cells, we paid more attention to the in vivo performance of P2. To determine if PKA-triggered assembly can target tumours in vivo, different groups of MCF-7 tumour-bearing mice received intravenous injections of 0.50 mg kg−1P1-Cy7, 0.75 mg kg−1P2-Cy7 or 11.75 mg kg−1P2 + 0.75 mg kg−1P2-Cy7, keeping the same dosage of Cy7 for each mouse according to the fluorescence intensity detected by the in vivo imaging system. Then, the spatiotemporal distribution of Cy7 in each mouse was recorded in a time-dependent manner. For P1-Cy7, the small molecules were quickly cleared with very weak fluorescence signals detected within the whole mouse. Similarly, little P2-Cy7 accumulated in the tumour. In contrast, the co-injection of P2 not only prolonged the half-life of P2-Cy7 in the mouse but also increased the fluorescence intensity in the tumour (Fig. 5a). At 24 h post-injection, the dissected tumours showed much stronger fluorescence intensity in the P2 + P2-Cy7 group than in the P1-Cy7 or P2-Cy7 group (Fig. 5b). These results demonstrated that P2 + P2-Cy7 was more effectively accumulated and retained longer in tumours than P1-Cy7 or P2-Cy7 alone. Since P1-Cy7 and P2-Cy7 alone would not assemble at the injected concentration, the retention time of P2 + P2-Cy7 was prolonged via the in situ assembly within the tumour.
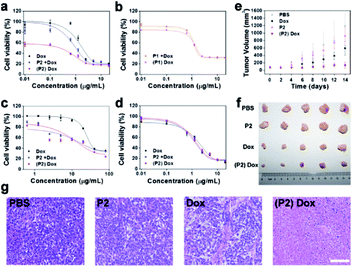
Although the MTT assay demonstrated that P2 had no obvious toxicity to MCF-7 and MCF-10A cells (Fig. S27†), the clonogenic assay demonstrated that P2 selectively decreased the surviving fraction (SF) of MCF-7 cells but not of MCF-10A cells (Fig. S28 and Table S3†). The curtailed division capability of MCF-7 cells may be attributed to the intracellular assembly induced disturbance of the cytoskeleton. This cell selectivity was further tested in a dose–response relationship with doxorubicin. Three treatments were set up as follows: (1) doxorubicin alone (Dox), (2) co-culture of P2 (100 μg mL−1) and Dox (P2 + Dox), and (3) pretreatment with P2 (100 μg mL−1) for 24 h followed by doxorubicin ((P2) Dox). As shown in Fig. 6a, the IC50 of Dox against MCF-7 cells was 1.84 μg mL−1. In co-culture with P2, the IC50 decreased to 1.02 μg mL−1. Pretreatment with P2 further decreased the IC50 to 0.24 μg mL−1. Since P2 can selectively decrease the surviving fraction of MCF-7 cells, it is not surprising that the (P2) Dox group demonstrated a low starting level in the dose–response curve. These results indicate that P2 can make MCF-7 cells more sensitive to doxorubicin and further enhance the therapeutic effect of Dox.
To determine whether such chemosensitization was due to the assembly process or ATP depletion,42,43 the effect of P1 on the sensitization of MCF-7 cells to doxorubicin was first evaluated. As shown in Fig. 6b, both the co-culture and the pretreatment with P1 (100 μg mL−1) gave IC50 values close to that of Dox alone, 1.36 μg mL−1 and 1.49 μg mL−1, respectively, implying the necessity of assembly. Furthermore, we used the hexokinase-II inhibitor 2-deoxy-D-glucose (2DG) to reduce the intracellular ATP level.44,45 Under pretreatment with 2DG (100 μg mL−1), the IC50 of Dox decreased to 0.99 μg mL−1. Conversely, the supplementation of extra ATP (200 μg mL−1) to the (P2) Dox-treated cells increased the overall IC50 from 0.24 μg mL−1 to 0.65 μg mL−1 (Fig. S29†). According to these ATP manipulation results, P2 sensitizes MCF-7 cells to doxorubicin via both the assembly process and ATP depletion.
The chemosensitization effect of P2 was valuable for the Dox-resistant cell line NCI/ADR-RES. The IC50 of Dox against NCI/ADR-RES cells was 16.73 μg mL−1 for the group P2 + Dox and 14.71 μg mL−1 for the group (P2) Dox, which were both lower than that of 30.63 μg mL−1 for Dox alone (Fig. 6c). In contrast, since P2 did not form assemblies in MCF-10A cells, the IC50 values of Dox were 1.32 μg mL−1, 1.47 μg mL−1, and 1.83 μg mL−1 for the P2 + Dox, (P2) Dox and Dox groups, respectively (Fig. 6d). These similar IC50 values indicated that P2 had no obvious sensitization effect of MCF-10A cells to Dox.
Finally, the chemosensitization effect of P2 was tested in vivo. Four groups of MCF-7 tumour-bearing mice were administered PBS, Dox, P2, and (P2) Dox separately. Obviously, there was no inhibition effect of PBS or P2. However, P2 could enhance the tumour inhibition capability of Dox. As shown in Fig. 6e, at the dosage of 3 mg kg−1, Dox alone cannot inhibit tumour growth within 14 days. The administration of P2 (10 mg kg−1) prior to Dox (3 mg kg−1) can effectively inhibit tumour growth eventually (Fig. 6f). Histopathological examination (HE) staining further demonstrated that treatment with (P2) Dox caused a higher level of cell apoptosis in tumours than treatment with Dox alone (Fig. 6g). The body weight record (Fig. S30†), the serum biochemical indicator assays (Fig. S31†) and HE staining of the major organs (heart, liver, spleen, lung and kidney) (Fig. S32†) confirmed the satisfactory biocompatibility of P2. Overall, the chemosensitization effect of P2 is promising for the enhancement of the anticancer activity of Dox.
Conclusion
In conclusion, we demonstrated an example of phosphorylation-induced supramolecular assembly and hydrogelation via the combination of self-assembling peptides and the LCST polymer PNIPAM. Usually phosphorylation raised the critical temperature due to the increased hydrophilicity. We utilized phosphorylation to neutralize electrostatic charge to yield a shift towards a lower critical temperature, which was critical to realize the kinase-triggered isothermal supramolecular assembly. Further under open and non-equilibrium conditions such as the biological environment, the assembly process was dependent on the phosphorylation rate which was based on the local and transient concentration of assembling molecules. Such a kinetic selectivity reasoned that the assembly process occurred in PKA-overexpressing MCF-7 cancer cells but not in normal cells. The assemblies disturbed the cytoskeletons and cell membrane and thus enhanced the therapeutic efficacy of doxorubicin by a factor of up to 7.6. Finally, chemosensitization was effective in vivo to inhibit tumour growth with satisfactory biocompatibility. Overall, this supramolecular assembly not only provided a new reaction (phosphorylation)-dependent self-assembly mechanism but also selectively impaired PKA-upregulated cancer cells. The capability of supramolecular assembly to remodel cytoskeletons should be useful in suppressing invasion of breast cancer,46 increasing intracellular drug concentrations and developing novel anticancer drugs.47–50Experimental section
Determination of the LCST of P2 and P3
The LCST of P2 and P3 was characterized at a concentration of 1 mg mL−1 by 50% of the maximum absorbance at 600 nm. The UV-vis spectra of P2 and P3 were obtained using a UV/Vis spectrophotometer (Shimadzu 3600) with a thermoelectric single cell holder (S-1700). A thermoelectric temperature controller was used to control the sample temperature.Gelation behaviour of P2 and P3
Rheological measurement was performed on a Kinexus ultra+ rheometer (Malvern Panalytical Technologies) with a standard steel parallel-plate geometry. The PU20 rheometer plate was used in this experiment. P2 and P3 were dissolved in PBS (0.5 mL, pH 7.4) at 1 wt% before measurement. The temperature dependent storage moduli (G′) of P2 and P3 were obtained from 25 °C to 45 °C with a heating rate of 0.5 °C min−1 at a frequency of 1 Hz and at a controlled strain of 0.5%.Phosphorylation of P1 and P2
The phosphorylation of P1 was performed according to the protocol given by Merck. In detail, 10 mg P1, and 4.57 mg ATP were dissolved in 1 mL buffer (containing 40 mM Tris–HCl and 20 mM magnesium acetate). 10 μg of the PKA catalytic subunit was added to the above solution and maintained in a 30 °C water bath for 4 days. The obtained P1-P (76% in yield) was verified by analytical HPLC and ESI MS. Phosphorylation of P2 was performed under the same conditions as those described above with the same molar ratio of serine.Quantification of P1 and P1-P in MCF-10A and MCF-7 cells
To verify that the phosphorylation of P1 can occur in cells, MCF-10A cells and MCF-7 cells were cultured with P1 (1.0 mg mL−1) for 24 h respectively. And then MCF-7 cells (112 × 104) and MCF-10A cells (188 × 104) were collected and lysed. After lyophilization, the cellular residue was dissolved in 30 mL ultrapure water and methanol (1![[thin space (1/6-em)]](https://www.rsc.org/images/entities/char_2009.gif) :
:![[thin space (1/6-em)]](https://www.rsc.org/images/entities/char_2009.gif) 1). Then the above solution was diluted (1000 times) to the ppb level and the concentrations of P1 and P1-P in MCF-10A cells and MCF-7 cells were tested by LC-MS/MS (Shimadzu, LCMS8050) respectively. The below formula was used to determine the concentration of P1 and P1-P in cells: sample concentration (ppb) × 1000 (dilution ratio) × 30 mL/cell number (104)/molecular weight. The mobile phase for LC-MS/MS consisted of ultrapure water and methanol (1
1). Then the above solution was diluted (1000 times) to the ppb level and the concentrations of P1 and P1-P in MCF-10A cells and MCF-7 cells were tested by LC-MS/MS (Shimadzu, LCMS8050) respectively. The below formula was used to determine the concentration of P1 and P1-P in cells: sample concentration (ppb) × 1000 (dilution ratio) × 30 mL/cell number (104)/molecular weight. The mobile phase for LC-MS/MS consisted of ultrapure water and methanol (1![[thin space (1/6-em)]](https://www.rsc.org/images/entities/char_2009.gif) :
:![[thin space (1/6-em)]](https://www.rsc.org/images/entities/char_2009.gif) 1). The ion pair for determining P1 was m/z: 602.95/127.15. The ion pair for determining P1-P was m/z: 642.90/120.05.
1). The ion pair for determining P1 was m/z: 602.95/127.15. The ion pair for determining P1-P was m/z: 642.90/120.05.
TEM images of the cell fractions
MCF-7 cells were cultured with P1 (50.0 μg mL−1), P1-P (50.0 μg mL−1), and P2 (50.0 μg mL−1) for 24 h respectively. MCF-10A cells were cultured with P2 (50.0 μg mL−1) for 24 h. Then P1, P1-P and P2 containing cell supernatants were removed and the adherent cells were washed with PBS buffer 3 times. After being lysed with 1 mL pure water, the cellular faction was concentrated by centrifugation (300![[thin space (1/6-em)]](https://www.rsc.org/images/entities/char_2009.gif) 000g, 4 °C, 120 min) and re-dispersed in 200 μL pure water for TEM imaging.
000g, 4 °C, 120 min) and re-dispersed in 200 μL pure water for TEM imaging.
In vivo fluorescence imaging assays of P2
All animal procedures were performed under the supervision and guidance of Animal Care and Use Committee, National Center for Nanoscience and Technology (NCNST). All animal experiments were approved by the Animal Ethics Committee, National Center for Nanoscience and Technology (NCNST) (no. 20184972). The animals were purchased from Beijing Huafukang Bioscience Co., Ltd. For in vivo fluorescence imaging assays, female BALB/c nude mice (4 week-old) were injected with 100 μL MCF-7 cells (1 × 10⁶ cells) for constructing the tumour model. 2 weeks after the tumour cells were implanted, tumour-bearing mice were divided randomly into 3 groups. In the treatment group, the mice were injected with 100 μL P2 + P2-Cy7 (a mixture of 50 μL 4.7 mg mL−1P2 + 50 μL 300 μg mL−1P2-Cy7) via the tail vein. In control groups, the mice were injected with 100 μL 150 μg mL−1P2-Cy7 and 100 μL 100 μg mL−1P1-Cy7via the tail vein, respectively. The concentrations of Cy7 in P2 + P2-Cy7, P2-Cy7 and P1-Cy7 were maintained equal according to the fluorescence intensity detected by the in vivo imaging system. The fluorescence images of the mice were monitored after the materials were injected for 2, 4, 8, and 12 h. Then the mice were sacrificed and tumours were taken for fluorescence imaging.In vivo anti-cancer experiments
The animals were purchased from Beijing Huafukang Bioscience Co., Ltd. To determine the effect of P2 on improving the chemo-sensitization of Dox, BALB/c nude female mice (around 5 week-old) were subcutaneously implanted with 100 μL (1 × 10⁶) MCF-7 cells. After the tumours grew up to 50–100 mm3, tumour-bearing mice were divided randomly into 4 groups (n = 5). The mice in control groups were treated with PBS, Dox, and P2 respectively every three days. The mice in the treatment group were treated with (P2) Dox every three days. In detail, PBS and Dox (3 mg kg−1) were given via the tail vein on the 1th, 4th, 7th, 10th, and 13th day. In the group of P2, P2 (10 mg kg−1) was directly injected into the tumours on the 1th, 4th, 7th, 10th, and 13th day. In the group of (P2) Dox, P2 (10 mg kg−1) was directly injected into the tumours on the 0th, 3th, 6th, 9th, and 12th day, and Dox (3 mg kg−1) was given via the tail vein on the 1th, 4th, 7th, 10th, and 13th day. During the experiments, the tumour volume and body weight were measured and recorded. A calliper was used to obtain the tumour size and the formula of 0.5 × ab2 was used to calculate the tumour volume, in which a and b represent the length and width of the tumour respectively.Conflicts of interest
There are no conflicts to declare.Acknowledgements
This work was supported by the National Key R&D Program of China (2017YFA0205901), NSFC (21675036, 51873046 and 21705029), NSKF 201818 and the Hundred Talents Project of the Chinese Academy of Sciences for financial support. We thank J. Z., Z. H. D., and L. W. from NCNST for the help in in vivo imaging and tumor inhibition experiments. We thank M. D. W from NCNST for the help in HPLC analysis. We thank C. C. X from NCNST for the help in western blot analysis.Notes and references
- G. Manning, D. B. Whyte, R. Martinez, T. Hunter and S. Sudarsanam, Science, 2002, 298, 1912–1934 CrossRef CAS PubMed.
- D. Hanahan and R. A. Weinberg, Cell, 2011, 144, 646–674 CrossRef CAS PubMed.
- I. Shchemelinin, L. Šefc and E. Necĉas, Folia Biol., 2006, 52, 81–101 CAS.
- J. Dancey and E. A. Sausville, Nat. Rev. Drug Discovery, 2003, 2, 296–313 CrossRef CAS PubMed.
- I. Melnikova and J. Golden, Nat. Rev. Drug Discovery, 2004, 3, 993–994 CrossRef CAS PubMed.
- J. Zhang, P. L. Yang and N. S. Gray, Nat. Rev. Cancer, 2009, 9, 28–39 CrossRef CAS PubMed.
- P. Cohen and D. R. Alessi, ACS Chem. Biol., 2013, 8, 96–104 CrossRef CAS PubMed.
- S. P. Davies, H. Reddy, M. Caivano and P. Cohen, Biochem. J., 2000, 351, 95–105 CrossRef CAS PubMed.
- J. Bain, L. Plater, M. Elliott, N. Shpiro, C. J. Hastie, H. McLauchlan, I. Klevernic, J. S. Arthur, D. R. Alessi and P. Cohen, Biochem. J., 2007, 408, 297–315 CrossRef CAS PubMed.
- K. G. Coleman and C. M. Crews, Annu Rev Cancer Biol., 2018, 2, 41–58 CrossRef.
- J. Zhou and B. Xu, Bioconjugate Chem., 2015, 26, 987–999 CrossRef CAS PubMed.
- G.-B. Qi, Y.-J. Gao, L. Wang and H. Wang, Adv. Mater., 2018, 30, 1703444 CrossRef PubMed.
- Z. Feng, H. Wang, X. Chen and B. Xu, J. Am. Chem. Soc., 2017, 139, 15377–15384 CrossRef CAS PubMed.
- Q. Yao, F. Lin, X. Fan, Y. Wang, Y. Liu, Z. Liu, X. Jiang, P. R. Chen and Y. Gao, Nat. Commun., 2018, 9, 5032 CrossRef PubMed.
- R. A. Pires, Y. M. Abul-Haija, D. S. Costa, R. Novoa-Carballal, R. L. Reis, R. V. Ulijn and I. Pashkuleva, J. Am. Chem. Soc., 2015, 137, 576–579 CrossRef CAS PubMed.
- H. Wang, Z. Feng, D. Wu, K. J. Fritzsching, M. Rigney, J. Zhou, Y. Jiang, K. Schmidt-Rohr and B. Xu, J. Am. Chem. Soc., 2016, 138, 10758–10761 CrossRef CAS PubMed.
- H. He, J. Wang, H. Wang, N. Zhou, D. Yang, D. R. Green and B. Xu, J. Am. Chem. Soc., 2018, 140, 1215–1218 CrossRef CAS PubMed.
- H. Wang, Z. Feng, Y. Wang, R. Zhou, Z. Yang and B. Xu, J. Am. Chem. Soc., 2016, 138, 16046–16055 CrossRef CAS PubMed.
- Q. Yao, Z. Huang, D. Liu, J. Chen and Y. Gao, Adv. Mater., 2018, 1804814 Search PubMed.
- S. Kiran, Z. Hai, Z. Ding, L. Wang, Y. Liu, H. Zhang and G. Liang, Chem. Commun., 2018, 54, 1853–1856 RSC.
- Z. Yang, G. Liang, L. Wang and B. Xu, J. Am. Chem. Soc., 2006, 128, 3038–3043 CrossRef CAS PubMed.
- Z. Zheng, H. Sun, C. Hu, G. Li, X. Liu, P. Chen, Y. Cui, J. Liu, J. Wang and G. Liang, Anal. Chem., 2016, 88, 3363–3368 CrossRef CAS PubMed.
- C. A. Stratakis and Y. S. Cho-Chung, Trends Endocrinol. Metab., 2002, 13, 50–52 CrossRef CAS PubMed.
- T. Sonoda, T. Nogami, J. Oishi, M. Murata, T. Niidome and Y. Katayama, Bioconjugate Chem., 2005, 16, 1542–1546 CrossRef CAS PubMed.
- Y. Xia, X. Yin, N. A. D. Burke and H. D. H. Stöver, Macromolecules, 2005, 38, 5937–5943 CrossRef CAS.
- M. Reches and E. Gazit, Science, 2003, 300, 625–627 CrossRef CAS PubMed.
- Y. Gao, J. Shi, D. Yuan and B. Xu, Nat. Commun., 2012, 3, 1033 CrossRef PubMed.
- S.-L. Qiao, Y. Ma, Y. Wang, Y.-X. Lin, H.-W. An, L.-L. Li and H. Wang, ACS Nano, 2017, 11, 7301–7311 CrossRef CAS PubMed.
- Y. Katayama, T. Sonoda and M. Maeda, Macromolecules, 2001, 34, 8569–8573 CrossRef CAS.
- M. Ma, Y. Kuang, Y. Gao, Y. Zhang, P. Gao and B. Xu, J. Am. Chem. Soc., 2010, 132, 2719–2728 CrossRef CAS PubMed.
- V. Wintgens, S. Daoud-Mahammed, R. Gref, L. Bouteiller and C. Amiel, Biomacromolecules, 2008, 9, 1434–1442 CrossRef CAS PubMed.
- I. Antoniuk, D. Kaczmarek, A. Kardos, I. Varga and C. Amiel, Polymers, 2018, 10, 566 CrossRef PubMed.
- D. E. Clarke, E. T. Pashuck, S. Bertazzo, J. V. M. Weaver and M. M. Stevens, J. Am. Chem. Soc., 2017, 139, 7250–7255 CrossRef CAS PubMed.
- M. Yu, T. Liu, Y. Chen, Y. Li and W. Li, J. Exp. Clin. Cancer Res., 2018, 37, 114 CrossRef PubMed.
- R. E. Turnham and J. D. Scott, Gene, 2016, 577, 101–108 CrossRef CAS PubMed.
- Y. Gao, C. Berciu, Y. Kuang, J. Shi, D. Nicastro and B. Xu, ACS Nano, 2013, 7, 9055–9063 CrossRef CAS PubMed.
- D. A. Fletcher and R. D. Mullins, Nature, 2010, 463, 485–492 CrossRef CAS PubMed.
- A. W. Hunter, M. Caplow, D. L. Coy, W. O. Hancock, S. Diez, L. Wordeman and J. Howard, Mol. Cell, 2003, 11, 445–457 CrossRef CAS PubMed.
- T. D. Pollard and G. G. Borisy, Cell, 2003, 112, 453–465 CrossRef CAS PubMed.
- G. J. Doherty and H. T. McMahon, Annu. Rev. Biophys., 2008, 37, 65–95 CrossRef CAS PubMed.
- S. Glisic-Milosavljevic, J. Waukau, S. Jana, P. Jailwala, J. Rovensky and S. Ghosh, Cell Prolif., 2005, 38, 301–311 CrossRef CAS PubMed.
- A. V. Kabanov, E. V. Batrakova and V. Y. Alakhov, Adv. Drug Delivery Rev., 2002, 54, 759–779 CrossRef CAS PubMed.
- H. Wang, Z. Feng, Y. Qin, J. Wang and B. Xu, Angew. Chem., Int. Ed., 2018, 57, 4931–4935 CrossRef CAS PubMed.
- O. Kaplan, G. Navon, R. C. Lyon, P. J. Faustino, E. J. Straka and J. S. Cohen, Cancer Res., 1990, 50, 544–551 CAS.
- M. Kurtoglu, N. Gao, J. Shang, J. C. Maher, M. A. Lehrman, M. Wangpaichitr, N. Savaraj, A. N. Lane and T. J. Lampidis, Mol. Cancer Ther., 2007, 6, 3049–3058 CrossRef CAS PubMed.
- M. Padilla-Rodriguez, S. S. Parker, D. G. Adams, T. Westerling, J. I. Puleo, A. W. Watson, S. M. Hill, M. Noon, R. Gaudin, J. Aaron, D. Tong, D. J. Roe, B. Knudsen and G. Mouneimne, Nat. Commun., 2018, 9, 2980 CrossRef.
- A. Siegal, S. Hoenig and J. Leibovici, Chemotherapy, 1990, 36, 230–239 CrossRef CAS PubMed.
- Y. Huang and W. Sadee, Cancer Lett, 2006, 239, 168–182 CrossRef CAS PubMed.
- M. P. Stewart, R. Langer and K. F. Jensen, Chem. Rev., 2018, 118, 7409–7531 CrossRef CAS PubMed.
- X. Hu, S. Zhai, G. Liu, D. Xing, H. Liang and S. Liu, Adv. Mater., 2018, 30, e1706307 CrossRef PubMed.
Footnote |
| † Electronic supplementary information (ESI) available: General materials and methods, chemical synthesis and procedures and supplementary results. See DOI: 10.1039/c9sc04317a |
| This journal is © The Royal Society of Chemistry 2020 |

