 Open Access Article
Shedding light on the mitochondrial matrix through a functional membrane transporter†
Alberto
Blázquez-Moraleja
 a,
Ines
Sáenz-de-Santa María
 b,
María D.
Chiara
 *b,
Delia
Álvarez-Fernández
a,
Inmaculada
García-Moreno
 c,
Ruth
Prieto-Montero
 d,
Virginia
Martínez-Martínez
 d,
Iñigo
López Arbeloa
 d and
Jose Luis
Chiara
 *a
*a
aInstituto de Química Orgánica General (IQOG-CSIC), Juan de la Cierva 3, 28006 Madrid, Spain. E-mail: jl.chiara@csic.es
bInstituto de Investigación Sanitaria del Principado de Asturias, Instituto de Oncología del Principado de Asturias (IUOPA), CIBERONC, Universidad de Oviedo, Hospital Central de Asturias, 33011 Oviedo, Spain. E-mail: mdchiara.uo@uniovi.es
cInstituto Química-Física “Rocasolano” (IQFR-CSIC), Serrano 119, 28006 Madrid, Spain
dDepartamento de Química Física, Universidad del País Vasco UPV-EHU, Facultad de Ciencia y Tecnología, Apartado 644, 48080 Bilbao, Spain
First published on 9th December 2019
Abstract
The first fluorescent probes that are actively channeled into the mitochondrial matrix by a specific mitochondrial membrane transporter in living cells have been developed. The new functional probes (BCT) have a minimalist structural design based on the highly efficient and photostable BODIPY chromophore and carnitine as a biotargeting element. Both units are orthogonally bonded through the common boron atom, thus avoiding the use of complex polyatomic connectors. In contrast to known mitochondria-specific dyes, BCTs selectively label these organelles regardless of their transmembrane potential and in an enantioselective way. The obtained experimental evidence supports carnitine–acylcarnitine translocase (CACT) as the key transporter protein for BCTs, which behave therefore as acylcarnitine biomimetics. This simple structural design can be readily extended to other structurally diverse starting F-BODIPYs to obtain BCTs with varied emission wavelengths along the visible and NIR spectral regions and with multifunctional capabilities. BCTs are the first fluorescent derivatives of carnitine to be used in cell microscopy and stand as promising research tools to explore the role of the carnitine shuttle system in cancer and metabolic diseases. Extension of this approach to other small-molecule mitochondrial transporters is envisaged.
Introduction
Mitochondria are responsible for the production of energy in the form of ATP in eukaryotic cells through aerobic respiration. These highly dynamic organelles present two unique features: they have their own DNA (mtDNA) and a characteristic double membrane system separating the mitochondrial matrix from the cytosol, with an outer and an inner membrane that differ in shape, composition and physicochemical properties. The inner membrane is highly impermeable to most molecules and ions and contains, among others, the proteins involved in oxidative phosphorylation and proteins of the mitochondrial carrier system (MCS),1 which regulates the transfer of small molecules between the matrix and the cytosol. Consequently, mitochondria have an extraordinary capacity to precisely regulate cell chemistry. In addition to cellular respiration, they are involved in many other processes, including calcium homeostasis, production of reactive oxygen species (ROS), the metabolism of heme groups, nucleotides, amino acids and phospholipids, inflammation, cell proliferation, and apoptosis, thus fulfilling an essential role in cell survival.1 The damage or deregulation of these mechanisms is implicated in numerous pathological processes, either directly, as in mitochondrial genetic diseases, or secondarily in neurodegenerative, inflammatory, and cardiovascular diseases, as well as in some metabolic syndromes.2Although great efforts have been devoted to the study of the biology of mitochondria, we are still far from knowing in detail many of their functions and basic activities. Molecular imaging3 is currently the most efficient and versatile tool for the study of subcellular dynamics thanks to its high sensitivity, selectivity and ease of use, providing very varied information in real time and in a non-destructive way. A common characteristic of fluorescent probes targeting mitochondria is the presence of a lipophilic cation (ammonium or phosphonium)4 that promotes the uptake and accumulation of the probe driven by the high negative potential gradient (ΔΨm) characteristic of these organelles as a consequence of the oxidative phosphorylation process. Impairment of ΔΨm is a hallmark of mitochondrial dysfunction5 and, under these circumstances, the fluorescent labeling with dyes that are exclusively based on this “passive” electrophoretic diffusion mechanism will dim or even completely disappear. While the development of mitochondria-targeted fluorescent probes has become one of the most active areas in chemistry and biology,6 to the best of our knowledge the design of a functional probe that uses an “active” uptake mechanism regardless of the transmembrane potential is yet to be explored. Herein, we address the challenge of developing the first fluorescent probes that are able to enter mitochondria in living cells by an active and stereoselective protein-mediated transport mechanism in preference to the usual passive and non-specific electrophoretic diffusion process.
Results and discussion
Design and synthesis of the new probes
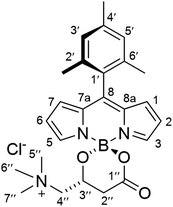
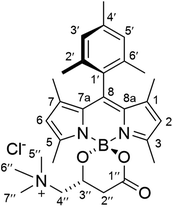
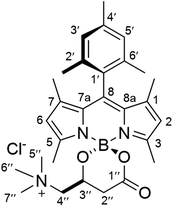
The specific active transport of small molecules by the membrane proteins of the MCS offers a reasonable, but still untapped design strategy for new functional probes. To this end, we chose to address the carnitine system (CS), which facilitates the transport of long-chain fatty acids through the mitochondrial membranes into the matrix for β-oxidation.7 A key protein of the CS is the carnitine/acylcarnitine translocase (CACT), which is an antiporter carrier that transfers the fatty acids in the form of acylcarnitines across the inner mitochondrial membrane into the matrix, in antiport with carnitine.8 Inherited defects in the CACT gene cause a rare, life-threatening metabolic disorder in newborns (CACT deficiency, also known as secondary carnitine deficiency).9 The non-functioning form of the transporter prevents the body to use fats to produce energy, which causes cardiomyopathy, arrhythmias, skeletal muscle damage, liver problems, hypothermia, neurological problems, and developmental delay in affected patients, often leading to sudden infant death. In addition, recent studies have established that the CS enzymes are overexpressed in cancer and promote tumor progression, being thus considered as attractive anti-tumor therapeutic targets.10Our functional probes have a modular design (Scheme 1) based on a BODIPY chromophore and a carnitine molecule as the biofunctional subunit for mitochondria-specific targeting. The two subunits are orthogonally linked to the single boron atom of the BODIPY component through the β-hydroxy acid grouping of carnitine to render a B-spiro system. In this minimalist structural design, the use of complex and long connectors is avoided, thereby simplifying not only the synthetic protocol but also the size and complexity of the final probe. The BODIPY fluorophore was selected for the outstanding photophysical properties (chemical robustness, strong UV-visible absorption and high fluorescence emission) and well-known chemical versatility of this group of dyes.11 The presence of a bulky mesityl substituent at its meso-position significantly enhances its photostability and the efficiency of its fluorescence emission when compared to both, related unsubstituted dyes and free-motion meso-aryl derivatives.12 In addition, its increased lipophilicity could enhance the specificity of the probe for lipid-mitochondrial transporters.
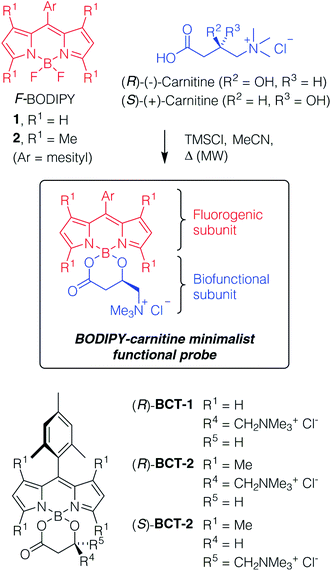 | ||
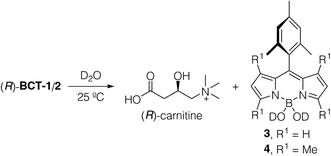
| Scheme 1 General molecular design of the BODIPY–carnitine BCT probes and structures of the starting components and final probes synthetized. | ||
Despite the essential role that carnitine plays in the biology of eukaryotic cells,13 only a few fluorescent derivatives have been described,14 but, surprisingly, none of them have been previously used in cell microscopy. Interestingly, since carnitine is a chiral molecule that is commercially available in both enantiomeric forms as well as the racemate, the corresponding probes will allow us to study the influence of stereochemistry on the specificity of mitochondrial fluorescent-labeling. Only the natural (R)-enantiomer (L-carnitine) is biologically relevant (Scheme 1).
The new BODIPY–carnitine probes included in this work were readily prepared following our recently described protocol for the one-step synthesis of O-BODIPYs with a rigid B-spiranic 4,4-diacyloxyl or 4-acyloxyl-4-alkoxyl substitution pattern starting from the corresponding F-BODIPYs (Scheme 1).12 Thus, a stoichiometric mixture of F-BODIPY 1 or 2 and the corresponding carnitine hydrochloride stereoisomer in anhydrous MeCN was heated under microwave irradiation (25 °C to 120 °C gradient over 3.2–3.4 h), in the presence of an excess of TMSCl (40–50 equiv.) to afford the targeted O-BODIPYs in an almost quantitative crude yield after solvent removal (Scheme 1). The crude samples were readily purified by recrystallization from CH2Cl2/t-BuOMe to afford compounds (R)-BCT-1, (R)-BCT-2, and (S)-BCT-2 in 63%, 88%, and 63% yield, respectively. The structures of BCT-1 and BCT-2 were fully confirmed by multidimensional NMR and HRMS (see Experimental part and ESI†). Compounds BCT-1 and BCT-2 were insoluble in ether and ester solvents (Et2O, THF, t-BuOMe, and EtOAc), but readily soluble in halogenated solvents (CH2Cl2, CHCl3, ClCH2CH2Cl), alcohols (MeOH, EtOH), and water.
Aqueous stability
To define the viability and traceability of the new functional dyes as mitochondria labels, it is important to analyze their long-term water stability since the new probes contain two potentially labile B–O bonds connecting the fluorophore to the carnitine moiety. We measured the time evolution of 15 mM solutions of (R)-BCT-1 and (R)-BCT-2 in D2O at 25 °C using 1H NMR to establish not only their chemical stability but also the degradation products (see Fig. S1 in the ESI†). Both compounds hydrolyzed to free carnitine and the corresponding 4,4-dihydroxy-BODIPY15 derivatives 3 and 4 (Scheme 2). Interestingly, while (R)-BCT-1 was quickly hydrolyzed (t1/2 = 10 min), its more hindered tetramethylated analog (R)-BCT-2 showed a superior aqueous stability (t1/2 = 6 h), which enables its use as a fluorescent probe in live cell imaging. Formation of free carnitine and the boron acid BODIPY derivatives 3 and 4 at a physiological pH range may, in fact, be advantageous for cell staining purposes. Thus, the liberated (R)-carnitine will be directly incorporated into the mitochondrial metabolism, while the boron acid group of the hydrolyzed BODIPY will likely form covalent bonds with polyhydroxylated biomolecules, such as mitochondrial glycolipids and glycoproteins, generating cyclic boron esters as already described for some BODIPYs16 and boronic acid-based saccharide sensors.17 Reversible formation of these boron ester derivatives will immobilize the probe within the mitochondrion, impeding its diffusion out of the organelle even in instances when the ΔΨm transmembrane potential is eliminated, as experimentally observed (see below).Photophysical characterization
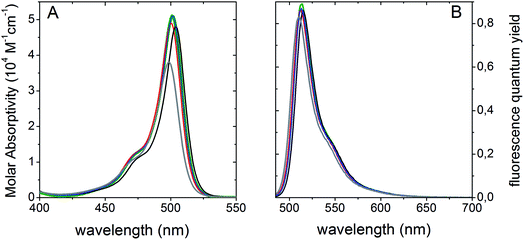
We studied the UV-vis absorption and fluorescence emission spectra of BCT-1 and BCT-2 to provide fundamental information for cell imaging. No aggregation band corresponding to either H- or J-aggregates could be detected in the UV-visible spectra at a concentration of 10−4 M. Since the new probes have been designed for live cell fluorescent imaging, their photophysical properties were initially analyzed in water (see Fig. 1, and Table S1 in ESI†). Following the expected behavior, the photophysical signatures were significantly dependent on the degree of alkylation of the BODIPY chromophore, which provides enough steric hindrance to prevent the deleterious effect that free rotation of the 8-mesityl group could have on the fluorescence response.12 In fact, probe (R)-BCT-2 outstands by a high molar absorption coefficient (3.8 × 10⁴ M−1 cm−1 at 499 nm) in water and an efficient fluorescent emission peaked at 511 nm with a quantum yield higher than 80%. This behavior is related to the low probability of non-radiative processes due to the rigid and constrained molecular structure resultant from the rings grafted at the meso position and at the boron atom, together with the 1,3,5,7-tetrametylation of the chromophore scaffold. Supporting our initial hypothesis, probe (R)-BCT-2 stands out as a highly effective fluorescent dye regardless of solvent nature since it showed similar photophysical features even by significantly decreasing the solvent polarity from water to chloroform (Fig. 1 and Table S1†).Interestingly, probe (R)-BCT-2 exhibited also a high photostability, which is of outmost importance on building smarter fluorescent probes. The slow hydrolysis of (R)-BCT-2 in water solution, observed in the previous 1H NMR study, did not result in a significant reduction of the overall fluorescent emission (see Fig. S2, and Table S2 in ESI†). In fact, its fluorescence quantum yield remained unchanged after 7 hours. However, due to the slow oligomerization of the hydrolysis product 4 and the observed consequent precipitation of the resultant oligomers, the quantum yield gradually dropped after 24 hours, although still remained at a suitable 65%. Very similar results were also obtained in PBS solution at pH 6.0, 7.4, and 8.0 and in culture medium (see Table S3 and Fig. S3 in ESI†). Compared to pure water, only a slight decrease of the fluorescence quantum yield and lifetime was observed in PBS and in culture medium. Based on these results, we conclude that hydrolysis, small pH changes, or the presence of inorganic salts (CaCl2·2H2O, Fe(NO3)3·9H2O, MgSO4·7H2O, KCl, NaHCO3, NaCl, NaH2PO3·2H2O) and other culture medium components (amino acids, vitamins, D-glucose, fetal bovine serum) in millimolar concentrations do not significantly affect the fluorescence performance of the probe. In addition, its ability to covalently attach to mitochondrial glycoproteins and glycolipids should avoid subsequent leakage and unwanted diffusion, excretion or metabolism. Leakage of dyes non-covalently bonded to cellular organelles is one of the major challenges in fluorescence labeling since it induces a significant decrease in the fluorescent emission and, consequently, in the experimental accuracy. In this regard, the rational design of probe (R)-BCT-2 should prevent signal lost and enhance measurement reliability impelling label traceability.
Live cell imaging
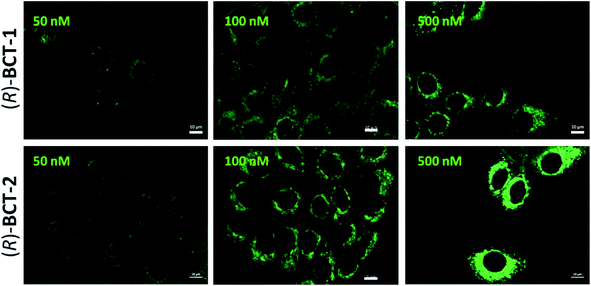
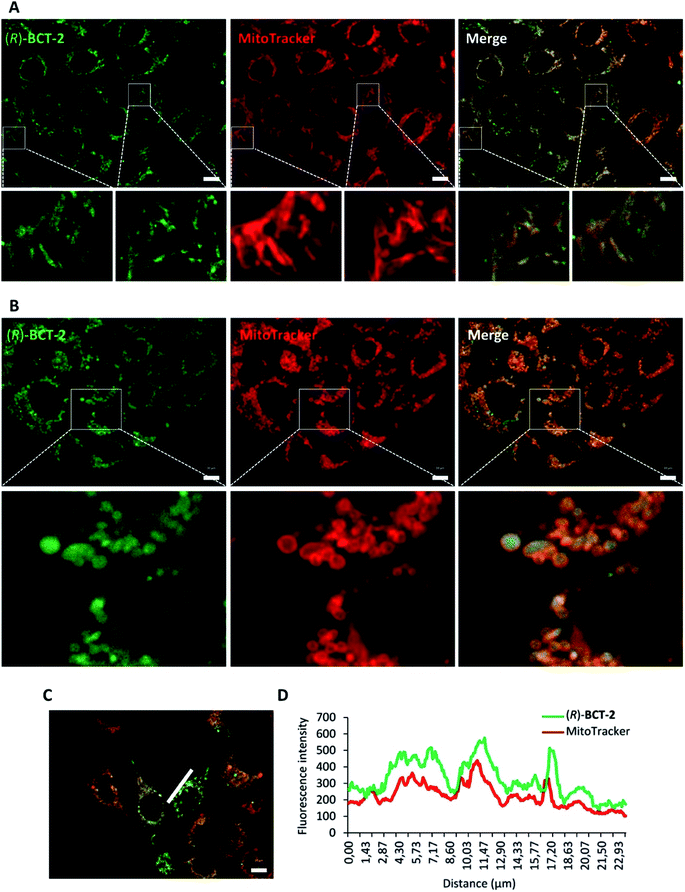
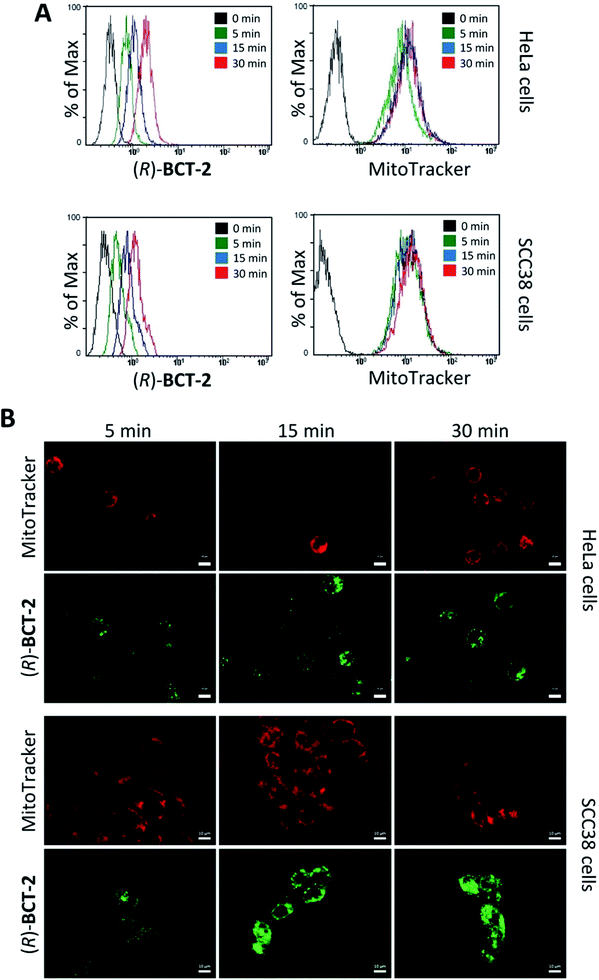
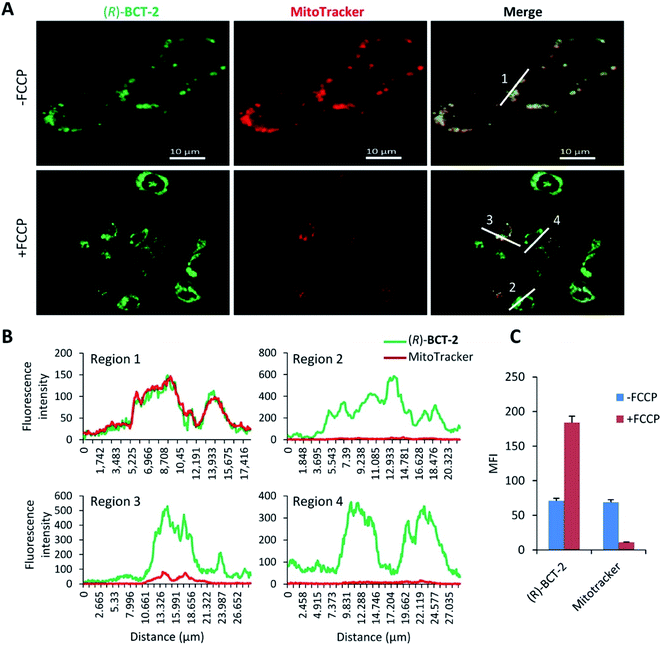
To assess the mitochondrial staining ability of the new probes, live SCC38 cells (derived from human larynx squamous cell carcinoma) were incubated with different concentrations of just-prepared aqueous solutions of (R)-BCT-1 and (R)-BCT-2 (50, 100 and 500 nM) (Fig. 2). As expected from the photophysical studies, compound (R)-BCT-1 gave weaker cell staining than (R)-BCT-2 at all concentrations assayed. Thus, all subsequent studies were performed only with (R)-BCT-2, which produced a clear green fluorescence signal in a dose-dependent manner and had better stability in aqueous solution. The lowest concentration (50 nM) was found optimal to obtain a bright staining of the cells without causing any observed cytotoxicity. Localization of (R)-BCT-2 in live cells was studied by co-staining experiments with commercially available MitoTracker Red CMXRos (hereafter simply called MitoTracker Red). The cells were coincubated with (R)-BCT-2 (50 nM) and MitoTracker Red (50 nM) at 37 °C for 30 min. As shown in Fig. 3, the green fluorescence from (R)-BCT-2 colocalized well with the red fluorescence from the MitoTracker dye, with a Pearson's correlation coefficient of 0.82 (95% CI = 0.77–0.86; p < 0.0001). As observed with the MitoTracker dye, (R)-BCT-2 stained spherical and tubular mitochondria (Fig. 3). These data revealed that (R)-BCT-2 acts as an organelle-specific probe that targets mitochondria and is retained within the organelle like the commercial Mitotracker dye. Mitochondrial staining with (R)-BCT-2 was time-dependent, as observed by flow cytometry (Fig. 4), in sharp contrast with MitoTracker Red that gave an almost instant fluorescent labeling of these organelles. Although this time lapse may be the result of a slower uptake of (R)-BCT-2 by the cells as compared to MitoTracker, it can also be a first indication of the possible involvement of an active transport system in the mitochondrial internalization of the carnitine-based probe. The staining was independent of the cell type, since similar data were obtained in HeLa cells derived from human cervical cancer (see Fig. S4 in ESI,† and Fig. 4 below). To confirm that the presence of the covalently attached carnitine was essential for mitochondria localization, we performed control experiments with 24 h-old aqueous solutions of (R)-BCT-2. Only a very weak and diffuse cell staining (see Fig. S5 in ESI†) was observed using these solutions, which mainly contained the hydrolyzed probe (i.e., 4,4-dihydroxy-BODIPY derivative 4 and free carnitine; see Scheme 2).The B-chelated covalent linkage of carnitine to the BODIPY scaffold in our probes renders cationic dyes, which may also simultaneously target mitochondria via their electrostatic interaction with the negative electric potential of healthy mitochondria. To elucidate the impact of the mitochondrial transmembrane potential (ΔΨm) on the subcellular distribution of (R)-BCT-2, staining was analyzed by cell microscopy and flow cytometry in response to carbonyl cyanide-4-(trifluoromethoxy)phenylhydrazone (FCCP), a protonophore used to decrease ΔΨm by depolarization of the mitochondrial membrane. Whereas FCCP-treated cells (60 μM FCCP for 3 h, at 37 °C) exhibited highly attenuated mitochondrial fluorescence after incubation with MitoTracker Red, a dye relying on ΔΨm for mitochondrial internalization, compound (R)-BCT-2 showed in fact an increase in fluorescence intensity upon loss of ΔΨm, while still remaining within the depolarized mitochondria (Fig. 5). As described for other dyes,18 this increase of the fluorescence signal could be ascribed to “unquenching” of the loaded probe due to its reduced concentration inside the organelle caused by the suppression of the electrophoretic passive pathway.
Considered in concert, the above divergent observations for both types of dyes provide support for the notion that (R)-BCT-2 is internalized into mitochondria via an active transport system irrespective of ΔΨm, in contrast to MitoTracker and similar cationic dyes that are rapidly taken up into the negatively charged organelle by passive electrophoretically-driven diffusion. A compelling candidate for the active transport of (R)-BCT-2 into mitochondria is the CS (Fig. 6), as initially designed. In the CS, fatty acids are first activated by the acyl-CoA synthetase (ACSL) in the cytosol to acyl-CoA thioesters, which cross the outer mitochondrial membrane through the voltage-dependent anion channel (VDAC), but do not cross the inner mitochondrial membrane due to the lack of a specific transporter. Fatty acyl-CoAs are trans-esterified to acylcarnitines by the carnitine palmitoyltransferase-1a (CPT-1a), an integral outer mitochondrial membrane enzyme, and are then released into the intermembrane space. Acylcarnitines are transported across the inner mitochondrial membrane by the carnitine/acylcarnitine translocase (CACT), which mediates the antiport reaction allowing entry of acylcarnitines into the mitochondrial matrix and exit of free carnitine.8,19 Finally, the enzyme carnitine palmitoyltransferase-2 (CPT-2) catalyzes the trans-esterification of the acyl group from carnitine to CoA in the mitochondrial matrix affording the substrates for β-oxidation. Thus, the transport function of CACT is crucial for the β-oxidation pathway.
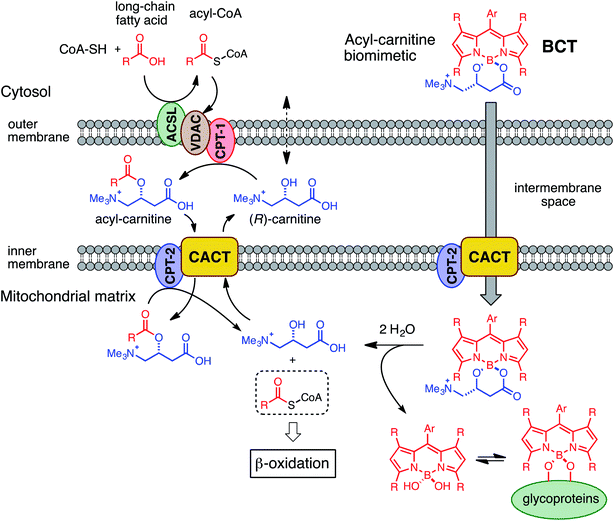 | ||
| Fig. 6 Mechanistic hypothesis for the transport (and fate) of BCT probes into the mitochondrial matrix via the carnitine shuttle system. | ||
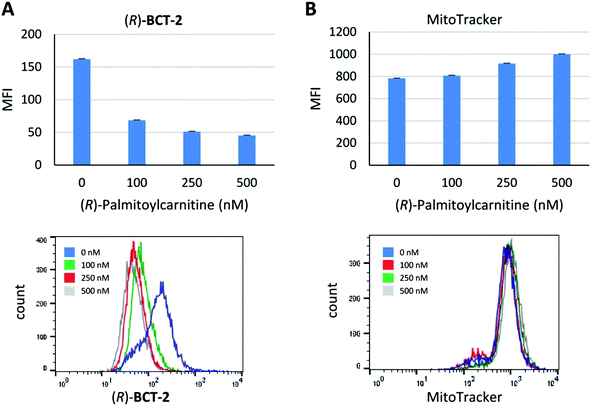
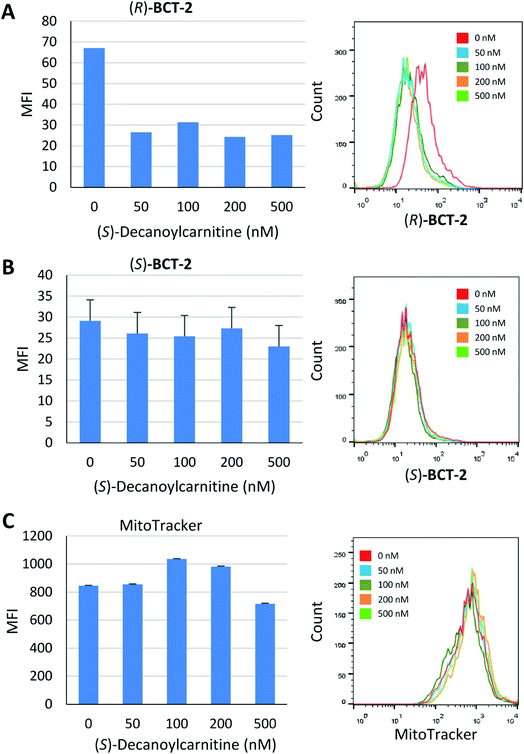
Due to the lipophilic nature of the BODIPY subunit, (R)-BCT-2 can be reasonably regarded as a biomimetic of acylcarnitines, being thus able to travel through the CS in their place. To test if CACT was in fact involved in the channeling of (R)-BCT-2 into the mitochondrial matrix, we first studied the effect of (R)-palmitoylcarnitine, a natural CACT substrate,20 on the staining of the cells by this probe. Flow cytometry analysis of live SCC38 cells coincubated with (R)-BCT-2 (50 nM) and increasing concentrations of (R)-palmitoylcarnitine showed a dose-dependent reduction of the fluorescence intensity, as expected for a substrate inhibition process (Fig. 7). In contrast, a parallel slight increase of fluorescence was observed in the case of MitoTracker Red under the same experimental conditions. In order to further examine the biomimetic hypothesis, we carried out a similar experiment using (S)-decanoylcarnitine, a known CACT-specific inhibitor (IC50 ∼ 5 μM)20 derived from the unnatural (S)-enantiomer of carnitine (Fig. 8). For this, the cells were coincubated with (R)-BCT-2, (S)-BCT-2, or MitoTracker Red (all at 50 nM) and increasing concentrations of the inhibitor (50, 100, 200, 500 nM). In the case of (R)-BCT-2, which contains the natural enantiomer of carnitine, flow cytometry analysis showed a strong reduction of the mean fluorescence intensity even at the lowest inhibitor concentration used (Fig. 8A). Interestingly, (S)-BCT-2, which contains the unnatural enantiomer of carnitine, exhibited only a marginal reduction of the mean fluorescence intensity with increasing inhibitor concentrations (Fig. 8B). In contrast, MitoTracker Red displayed an increase of fluorescence at intermediate inhibitor concentrations, as in the experiment with (R)-palmitoylcarnitine, which slightly dimmed only at the highest inhibitor concentration used (Fig. 8C).
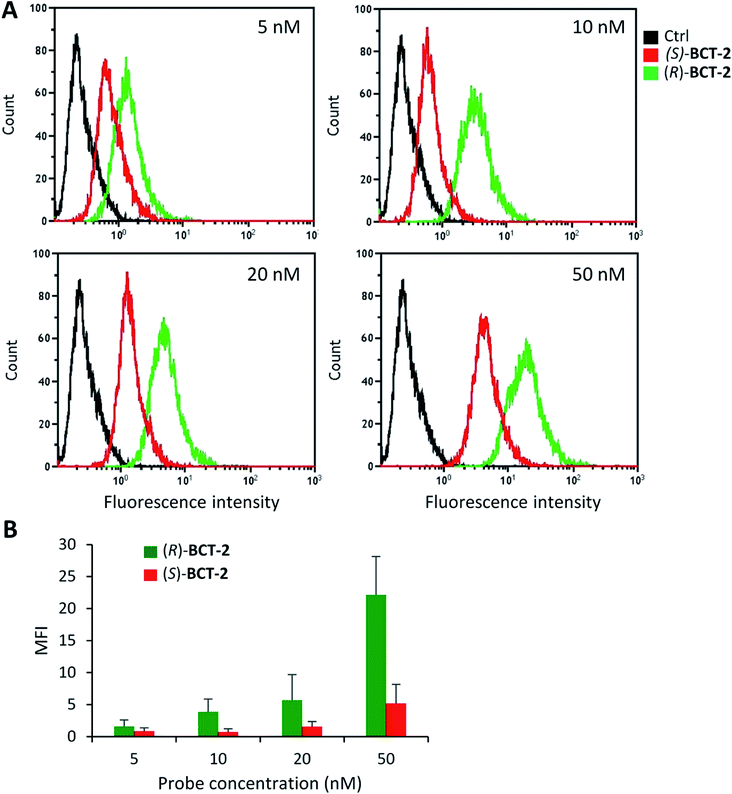
The inhibition experiments with (S)-decanoylcarnitine uncovered an additional important observation. In the absence of inhibitor, the fluorescence staining with the “natural” carnitine probe (R)-BCT-2 was much brighter than with its enantiomer (S)-BCT-2. At increasing inhibitor concentrations, when the activity of CACT was mostly suppressed and the residual uptake mechanism is basically the electrophoretic diffusion, the two intensities leveled. This is an exceptional example of enantioselective staining of cell organelles in live cells.21 To further confirm the stereoselectivity of our chiral carnitine-based probes, we compared the cell staining of both enantiomers at different concentrations under identical experimental conditions in the absence of inhibitors. Flow cytometry evaluation of these staining experiments clearly confirmed a considerably brighter mean fluorescence intensity when the SCC38 cells were loaded with (R)-BCT-2 that when using the (S)-BCT-2 probe, at all concentrations tested (Fig. 9). All the observed activities of our probes parallel the known stereospecificities shown by CACT for the corresponding enantiomeric palmitoylcanitines.19a,20 Overall, these observations substantiate the view that (R)-BCT-2 behaves as a substrate of CACT, which actively channels the probe through the mitochondrial inner membrane into the matrix, where it suffers hydrolysis to carnitine and boron acid derivative 4. Carnitine is then back-transported out of the matrix into the cytosol by CACT, while 4 is likely retained by covalent conjugation to glycolipids and glycoproteins in the matrix, as already mentioned. It is also possible that, once in the matrix, the hydrolyzed probe is not able to cross the impermeable inner membrane back to the cytosol. In any case, our probe does not need to have a reactive functional group that covalently attach it to proteins in mitochondria to prevent its diffusion out of the organelle, in contrast to Mitotracker and related mitochondria-specific dyes. As already commented above, the cationic character of the BCT probes allows the coexistence of the active and stereoselective protein-mediated transport and the passive and non-specific electrophoretic uptake of the probes, which may explain the residual staining observed in the presence of high concentrations of the acylcarnitine substrate or inhibitor.
Conclusions
We have described the first fluorescent probes that are actively channeled into the mitochondrial matrix by a specific mitochondrial membrane transporter in living cells. Our BCT functional probes have a minimalist structural design based on the highly efficient and photostable BODIPY chromophore and carnitine as a sacrificial biotargeting unit. Both components are orthogonally bonded through the common boron atom forming a B-spiro system, thus avoiding the use of complex polyatomic connectors. In contrast to most commonly used mitochondria-specific dyes, BCT probes enter mitochondria in a time-dependent way, regardless of the mitochondrial transmembrane potential. We have obtained convincing experimental evidence supporting the carnitine–acylcarnitine translocase (CACT) as the key transporter protein for BCTs. Thus, (1) mitochondrial staining is competitively inhibited in the presence of the CACT natural substrate (R)-palmitoylcarnitine or the CACT specific inhibitor (S)-decanoylcarnitine in a dose-dependent manner; and (2) staining is enantioselective, increasing in the order (S)-BCT-2 < (R)-BCT-2, which parallels the known stereochemical preference of CACT for acylcarnitine derivatives. (R)-BCT-2 behaves therefore as an acylcarnitine biomimetic in which the lipophilic BODIPY system plays the role of the fatty acid part of the natural substrate. Our simple structural design of a functional carnitine-based mitochondrial probe could be readily extended to other structurally diverse starting F-BODIPYs to obtain BCTs with varied wavelength emission along the visible and NIR spectrum and with multifunctional capabilities. BCTs are the first fluorescent derivatives of carnitine to be used in cell microscopy and stand as promising research tools to investigate the role of the CS in cancer metabolic rewiring and related alterations in metabolic diseases for the development of new therapies. Although no practical applications of the new dyes have been explored in this preliminary research, we believe that our approach sets the stage for the development of novel functional probes and drugs targeted to CACT and other small-molecule mitochondrial transporters for the study of the biology and pathology of this fascinating organelle.‡Experimental section
General methods for synthesis and chemical characterization
Proton and carbon-13 nuclear magnetic resonance (1H NMR, 13C NMR) spectra were recorded on a Bruker Avance III-400 (400 and 100 MHz, respectively) or a Varian System 500 (500 and 125 MHz, respectively) spectrometers. Chemical shifts are expressed in parts per million (δ scale) downfield from tetramethylsilane and are referenced to residual peaks of the deuterated NMR solvent used. Data are presented as follows: chemical shift, multiplicity (s = singlet, d = doublet, t = triplet, m = multiplet and/or multiple resonances, b = broad), integration, coupling constants in Hertz (Hz), and assignment. Proton and carbon-13 assignments are based on gCOSY, gNOESY, gHSQC, and gHMBC correlation experiments. FT-IR spectra were recorded in a PerkinElmer Spectrum One instrument. Thin layer chromatography (TLC) was performed with Merck Silica Gel 60 F254 plates. Chromatograms were visualized using UV light (254 nm or 365 nm). Column chromatography was performed on a 971-FP Flash Purification System from Agilent Technologies using SF Si35 silica cartridges. High-resolution mass spectra (HRMS) were recorded on an Agilent 6520 Q-TOF instrument with an ESI source. Anhydrous solvents were prepared according to standard methods by distillation over drying agents or via elution through a PureSolv™ column drying system from Innovative Technology, Inc. All other solvents were of HPLC grade and were used as provided. Microwave irradiation experiments were performed under magnetic stirring with a single-mode Anton Parr Monowave 300 reactor, using standard Pyrex tubes (10 mL capacity) sealed with a PTFE-lined rubber septum. (R)-Palmitoylcarnitine was obtained from commercial sources (Merck), and (S)-decanoylcarnitine was synthetized from (S)-carnitine (Carbosynth) following a described procedure.22Synthesis of (R)-BCT-1
To a suspension of (R)-carnitine (20 mg, 0.100 mmol) in anhydrous MeCN (5 mL), was added F-BODIPY 1 (30 mg, 0.097 mmol) and trimethylsilyl chloride (491 μL, 3.87 mmol). The stirred reaction mixture was heated under microwave irradiation using the following step-wise gradient: 30 min at 80 °C, 35 min at 100 °C, 40 min at 120 °C, 1.5 h at 150 °C. The solvent was removed at reduced pressure, the crude was dissolved in a minimum amount of CH2Cl2 and tert-butyl methyl ether was slowly added until precipitation of the product started. It was then kept at 4 °C overnight and the resulting crystalline product was isolated by filtration and washing with additional tert-butyl methyl ether to afford pure (R)-BCT-1 as dark red crystals (26 mg, 63% yield). FT-IR (KBr): ν = 1720 (s), 1560 (vs), 1411 (s), 1384 (vs), 1258 (vs), 1109 (vs), 1071 (vs) cm−1. 1H NMR (CDCl3, 400 MHz): δ = 8.14 (1H, s, H5), 7.83 (1H, s, H3), 6.95 (2H, s, H3′ and H5′), 6.70 (1H, br d, J = 4.8 Hz H1/H7), 6.69 (1H, br d, J = 4.8 Hz H7/H1) 6.50 (1H, m, H2/H6), 6.47 (1H, m, H6/H2), 4.99 (1H, br m, H3′′), 4.33 (1H, br d, J = 13.5 Hz, H4′′), 3.56 (1H, br m, H4′′), 3.41 (9H, s, CH35′′, CH36′′ and CH37′′), 2.98 (1H, br d, J = 16.3 Hz, H2′′), 2.67 (1H, br m, H2′′), 2.36 (3H, s, CH34′), 2.05 (6H, s, CH32′ and CH36′). 13C NMR (100 MHz, CDCl3): δ = 168.8 (C1′′), 148.0 (C8), 145.3 (C3), 144.4 (C5), 139.2 (C4′), 136.4 (C2′/C6′), 135.9 (C6′/C2′), 135.5 (C7a/C8a), 135.5 (C8a/C7a), 131.1 (C7), 130.8 (C1), 129.5 (C1′), 128.5 (C3′/C5′), 128.3 (C5′/C3′), 119.2 (C6), 119.2 (C2), 69.5 (C4′′), 63.1 (C3′′), 55.0 (C5′′, C6′′ and C7′′), 37.0 (C2′′), 21.3 (CH34′), 20.1 (CH32′/CH36′), 20.0 (CH36′/CH32′). HRMS (ESI+) m/z: calcd. for C25H31BN3O3+: 432.2458 [M]+; found: 432.2453.
Synthesis of (R)-BCT-2
To a suspension of (R)-carnitine (14.5 mg, 0.072 mmol) in anhydrous MeCN (5 mL) was added F-BODIPY 2 (32 mg, 0.088 mmol) and trimethylsilyl chloride (466 μL, 3.67 mmol). The stirred reaction mixture was heated under microwave irradiation using the following step-wise gradient: 35 min at 80 °C, 50 min at 100 °C, 2 h at 120 °C. The solvent was removed at reduced pressure, the crude was dissolved in a minimum amount of CH2Cl2 and tert-butyl methyl ether was slowly added until precipitation of the product started. It was then kept at 4 °C overnight and the resulting crystalline product was isolated by filtration and washing with additional tert-butyl methyl ether to afford pure (R)-BCT-2 as dark red crystals (32 mg, 88%). FT-IR (KBr): ν = 1721 (s), 1546 (vs), 1505 (vs), 1470 (s), 1295 (vs), 1187 (s), 1156 (vs) cm−1. 1H NMR (CDCl3, 400 MHz): δ = 6.97 (1H, s, H3′/H5′), 6.95 (1H, s, H5′/H3′), 5.99 (1H, s, H6), 5.97 (1H, s, H2), 4.55 (1H, br s, H3′′), 4.17 (1H, br s, H4′′), 3.32 (9H, br s, CH35′′, CH36′′ and CH37′′), 3.26 (1H, s, H4′′), 2.87 (1H, br d, J = 14.4 Hz, H2′′), 2.54 (3H, s, CH35), 2.47 (1H, br d, J = 14.4 Hz, H2′′), 2.39 (3H, s, CH33), 2.34 (3H, s, CH34′), 2.08 (3H, s, CH32′/CH36′), 1.98 (3H, s, CH36′/CH32′), 1.39 (3H, s, CH37), 1.38 (3H, s, CH31). 13C NMR (100 MHz, CDCl3): δ = 168.8 (C1′′), 155.7 (C3), 154.1 (C5), 143.8 (C8a), 143.5 (C7a), 142.5 (C8), 139.2 (C4′), 135.0 (C2′/C6′), 133.9 (C6′/C2′), 131.5 (C1), 131.4 (C7), 130.8 (C1′), 129.6 (C3′/C5′), 129.2 (C5′/C3′), 122.5 (C6), 122.5 (C2), 69.5 (C4′′), 62.3 (C3′′), 55.1 (C5′′, C6′′ and C7′′), 37.1 (C2′′), 21.4 (CH34′), 19.8 (CH32′/CH36′), 19.4 (CH36′/CH32′), 17.4 (CH35), 15.7 (CH33), 13.9 (CH37), 13.7 (CH31). HRMS (ESI+) m/z: calcd. for C29H39BN3O3+: 488.3084 [M]+; found: 488.3092.
Synthesis of (S)-BCT-2
To a suspension of (S)-carnitine (14.5 mg, 0.072 mmol) in anhydrous MeCN (4 mL) was added F-BODIPY 2 (32.3 mg, 0.089 mmol) and trimethylsilyl chloride (466 μL, 3.67 mmol). The stirred reaction mixture was heated under microwave irradiation using the following step-wise gradient: 35 min at 80 °C, 50 min at 100 °C, 2 h at 120 °C. The solvent was removed at reduced pressure, the crude was dissolved in a minimum amount of CH2Cl2 and tert-butyl methyl ether was slowly added until precipitation of the product started. It was then kept at 4 °C overnight and the resulting crystalline product was isolated by filtration and washing with additional tert-butyl methyl ether to afford pure (S)-BCT-2 as dark red crystals (23.5 mg, 63%). As expected, the spectral data are identical to those of (R)-BCT-2. HRMS (ESI+) m/z: calcd. for C29H39BN3O3+: 488.3084 [M]+; found: 488.3089.
1H NMR study of the aqueous stability of (R)-BCT-1 and (R)-BCT-2
A just-prepared solution of each probe in D2O (15 mm) at 25 °C was immediately placed in the NMR instrument probe set at 25 °C and 1H NMR spectra were automatically acquired at the different time intervals shown in Fig. S1 (ESI†). The spectra in each stack were automatically processed and normalized to the residual proton signal of the solvent using the MestReNova software.Photophysical characterization
The photophysical properties for all the compounds were measured in different solvents at low concentrations (approx. 5 × 10⁻⁶ M) in 1 cm optical path cuvettes. The UV/vis absorption spectra were recorded on a Varian dual beam spectrometer (CARY 7000) in transmittance mode. Emission spectra were recorded in right-angle configuration on a spectrofluorimeter Edinburgh Instruments (FLSP920 model) with a xenon flash lamp 450 W as the excitation source. The fluorescence spectra were corrected from the wavelength dependence of the detector sensibility. Fluorescence quantum yield (Φfl) was obtained using as reference PM546 (Φfl = 0.87) in ethanol. The fluorescence lifetime decay curves were measured with the time correlated single-photon counting technique in the same spectrofluorimeter using a multichannel plate detector (Hamamatsu R38094-50) with picosecond time-resolution. Fluorescence decay curves were monitored at the maximum emission wavelength after excitation by means of a Fianium Supercontinuum laser with 150 ps full width at half maximum (FWHM) pulses. The fluorescence lifetime (τ) was obtained after deconvolution of the instrumental response signal from the recorded decay curves by means of an iterative method. The goodness of the exponential fit was controlled by statistical parameters (chi square, χ2, and analysis of the residuals).Cell culture
The established human squamous cell carcinoma (SCC38)-derived cell line was kindly provided by Dr R Grenman (University Central Hospital, Turku, Finland). SCC38 and HeLa cells were grown in DMEM supplemented with 10% fetal bovine serum, 100 units per mL penicillin, 200 μg mL−1 streptomycin, 2 mmol L−1L-glutamine and 100 μmol L−1 nonessential amino acids. Cell lines were periodically tested for human pathogens and mycoplasma infection. All methods were carried out in accordance with the approved guidelines of our institution.Fluorescent cell labeling
Cells (50 × 103) were plated on black 24 well plates with flat and clear bottom suitable for fluorescence-based imaging of living cells (Ibidi GmbH) 24 hours before labeling. (R)-BCT-1 and (R)-BCT-2 probes were diluted in H2O or DMSO, respectively, to a stock concentration of 500 μM, 50 μM or 20 μM. Adhered living cells were incubated with 500 nM, 50 nM, or 20 nM of probes, as indicated in figure legends, in DMEM without supplements for 30 minutes at 37 °C. Subsequently, the probes were removed and the cells were washed with PBS (3 × 5 min). Supplemented DMEM was then added to cells prior to microscopy analysis. Where indicated, mitochondria were labeled by co-incubation of cells with the probes and 50 nM MitoTracker® Red CMXRos (Thermo Fisher).Live-cell microscopy
Microscopy imaging was performed on a Cell Observer equipment composed of a Zeiss AxioObserver Z1 wide field inverted fluorescence microscope (Carl Zeiss, Germany) with a Plan-Apochromat 40X/1.3 (NA = 1.3, working distance = 0.21 mm) or Plan-Apochromat 63X/1.4 (NA = 1.4, working distance = 0.19 mm) oil lens objective, a camera (AxioCam MRm; Carl Zeiss), a CO2 incubator, and a ZEISS ApoTome.2 structured illumination system. ApoTome.2 allows acquisition of optical sections of the fluorescent sample by moving the appropriate grid into the beam path and calculating the optical section from three images with different grid positions without time lag. Acquisition and processing of images were conducted using the Zen (Carl Zeiss) software. For direct comparison of fluorescence intensities between the two BCT probes (Fig. 2), microscope settings were the followings: 420 ms exposure time with a 0.79 μm depth in focus, 1.17 μm section thickness and maximum intensity of the HXP 120 C lighting unit. Images in Fig. 3–5 were acquired with the maximum intensity of the HXP 120 C lighting unit and exposure times of 420 ms for (R)-BCT-2 and 20 ms for MitoTracker.Flow cytometry
To evaluate the cellular labeling efficiency of BCT functional probes, SCC38 cells (1 × 10⁶ cells suspended in PBS) were incubated for 5, 15 or 30 min at 37 °C with 50 nM BCT probes or 50 nM MitoTracker in the presence or absence of 100, 250, or 500 nM (R)-palmitoylcarnitine or 50, 100, 200, 500 nM (S)-decanoylcarnitine as indicated in figure legends. Cells were subsequently washed three times with PBS to remove fluorescent probes, resuspended in PBS, and filtered through a 40 μm cell strainer. Unlabeled cells and cells exposed to culture medium containing 0.002% DMSO for 30 min (the same solution composition and time used in the treatment with the different fluorescent probes) served as negative controls. Labelled cells were then counted by using appropriate gates and controls by employing a BD FACSAria™ IIu (BD Biosciences, San Jose, CA) flow cytometer and the FlowJo v.10.6 software.Conflicts of interest
There are no conflicts to declare.Acknowledgements
We gratefully acknowledge the Spanish, Agencia Estatal de Investigación (AEI), and European Regional Development Fund (ERDF) (projects MAT2017-83856-C3-1-P, MAT2017-83856-C3-3-P, and MAT2015-68837-REDT), Gobierno Vasco (IT912-16), and the Instituto de Salud Carlos III-Fondo de Investigación Sanitaria (CIBERONC and PI17/01901) for financial support. A. B.-M. and R. P. M. thank, AEI and ERDF, and UPV-EHU for a FPI predoctoral contract and predoctoral fellowship, respectively.Notes and references
- R. A. J. Smith, R. C. Hartley, H. M. Cocheme and M. P. Murphy, Trends Pharmacol. Sci., 2012, 33, 341 CrossRef CAS PubMed.
- (a) M. P. Murphy and R. C. Hartley, Nat. Rev. Drug Discovery, 2018, 17, 865 CrossRef CAS PubMed; (b) H. B. Suliman and C. A. Piantadosi, Pharmacol. Rev., 2016, 68, 20 CrossRef CAS PubMed.
- (a) L. Wang, M. S. Frei, A. Salim and K. Johnsson, J. Am. Chem. Soc., 2019, 141, 2770 CrossRef CAS PubMed; (b) R. H. Newman, M. D. Fosbrink and J. Zhang, Chem. Rev., 2011, 111, 3614 CrossRef CAS PubMed; (c) H. Zhu, J. Fan, J. Du and X. Peng, Acc. Chem. Res., 2016, 49, 2115 CrossRef CAS PubMed; (d) W. Xu, Z. Zeng, J.-H. Jiang, Y.-T. Chang and L. Yuan, Angew. Chem., Int. Ed., 2016, 55, 13658 CrossRef CAS PubMed; (e) T. Ueno and T. Nagano, Nat. Methods, 2011, 8, 642 CrossRef CAS PubMed.
- (a) J. Zielonka, J. Joseph, A. Sikora, M. Hardy, O. Ouari, J. Vasquez-Vivar, G. Cheng, M. Lopez and B. Kalyanaraman, Chem. Rev., 2017, 117, 10043 CrossRef CAS PubMed; (b) L. F. Yousif, K. M. Stewart and S. O. Kelley, ChemBioChem, 2009, 10, 1939 CrossRef CAS PubMed.
- L. D. Zorova, V. A. Popkov, E. Y. Plotnikov, D. N. Silachev, I. B. Pevzner, S. S. Jankauskas, V. A. Babenko, S. D. Zorov, A. V. Balakireva, M. Juhaszova, S. J. Sollott and D. B. Zorov, Anal. Biochem., 2018, 552, 50 CrossRef CAS PubMed.
- (a) S. Samanta, Y. He, A. Sharma, J. Kim, W. Pan, Z. Yang, J. Li, W. Yan, L. Liu, J. Qu and J. S. Kim, Chem, 2019, 5, 1697 CrossRef CAS; (b) Z. Xu and L. Xu, Chem. Commun., 2016, 52, 1094 RSC; (c) Roopa, N. Kumar, V. Bhalla and M. Kumar, Chem. Commun., 2015, 51, 15614 RSC; (d) S. B. Ekanayake, A. M. El Zawily, G. Paszkiewicz, A. Rolland and D. C. Logan, Methods Mol. Biol., 2015, 1305, 223 CrossRef CAS PubMed; (e) B. C. Dickinson, D. Srikun and C. J. Chang, Curr. Opin. Chem. Biol., 2010, 14, 50 CrossRef CAS PubMed.
- (a) J. Kerner and C. Hoppel, Biochim. Biophys. Acta, Mol. Cell Biol. Lipids, 2000, 1486, 1 CrossRef CAS; (b) M. M. Adeva-Andany, N. Carneiro-Freire, M. Seco-Filgueira, C. Fernandez-Fernandez and D. Mourino-Bayolo, Mitochondrion, 2019, 46, 73 CrossRef CAS PubMed.
- A. Tonazzi, N. Giangregorio, L. Console and C. Indiveri, Mini-Rev. Med. Chem., 2015, 15, 396 CrossRef CAS PubMed.
- M. E. Rubio-Gozalbo, J. A. Bakker, H. R. Waterham and R. J. A. Wanders, Mol. Aspects Med., 2004, 25, 521 CrossRef CAS PubMed.
- (a) M. A. B. Melone, A. Valentino, S. Margarucci, U. Galderisi, A. Giordano and G. Peluso, Cell Death Dis., 2018, 9, 1 CrossRef CAS PubMed; (b) Q. Liu, Q. Luo, A. Halim and G. Song, Cancer Lett., 2017, 401, 39 CrossRef CAS PubMed; (c) S. Beloribi-Djefaflia, S. Vasseur and F. Guillaumond, Oncogenesis, 2016, 5, e189 CrossRef CAS PubMed.
- (a) R. G. Clarke and M. J. Hall, Adv. Heterocycl. Chem., 2019, 128, 181 CrossRef CAS; (b) J. Bañuelos, Chem. Rec., 2016, 16, 335 CrossRef PubMed.
- H. Manzano, I. Esnal, T. Marques-Matesanz, J. Banuelos, I. Lopez-Arbeloa, M. J. Ortiz, L. Cerdan, A. Costela, I. Garcia-Moreno and J. L. Chiara, Adv. Funct. Mater., 2016, 26, 2756 CrossRef CAS.
- (a) J. Pekala, B. Patkowska-Sokola, R. Bodkowski, D. Jamroz, P. Nowakowski, S. Lochynski and T. Librowski, Curr. Drug Metab., 2011, 12, 667 CrossRef CAS PubMed; (b) S. P. Chapela, N. Kriguer, E. H. Fernandez and C. A. Stella, Mini-Rev. Med. Chem., 2009, 9, 1518 CrossRef CAS PubMed.
- (a) P. E. Wolkowicz, H. J. Pownall and J. B. McMillin-Wood, Biochemistry, 1982, 21, 2990 CrossRef CAS PubMed; (b) K.-I. Nakaya, T. Tanaka, Y. Shirataki, H. Shiozaki, K. Funabiki, K. Shibata and M. Matsui, Bull. Chem. Soc. Jpn., 2001, 74, 173 CrossRef CAS; (c) K.-I. Nakaya, K. Funabiki, H. Muramatsu, K. Shibata and M. Matsui, Dyes Pigm., 1999, 43, 235 CrossRef CAS; (d) Q.-R. Cao, S. Ren, M.-J. Park, Y.-J. Choi and B.-J. Lee, Arch. Pharmacal Res., 2007, 30, 1041 CrossRef CAS PubMed.
- (a) P. Wang and R. W. Giese, J. Chromatogr. A, 1998, 809, 211 CrossRef CAS PubMed; (b) C. Tahtaoui, C. Thomas, F. Rohmer, P. Klotz, G. Duportail, Y. Mely, D. Bonnet and M. Hibert, J. Org. Chem., 2007, 72, 269 CrossRef CAS PubMed; (c) D. A. Smithen, A. E. G. Baker, M. Offman, S. M. Crawford, T. S. Cameron and A. Thompson, J. Org. Chem., 2012, 77, 3439 CrossRef CAS PubMed.
- (a) C. Uriel, R. Sola-Llano, J. Banuelos, A. M. Gomez and J. Cristobal Lopez, Molecules, 2019, 24, 2050 CrossRef CAS PubMed; (b) B. Liu, N. Novikova, M. C. Simpson, M. S. M. Timmer, B. L. Stocker, T. Sohnel, D. C. Ware and P. J. Brothers, Org. Biomol. Chem., 2016, 14, 5205 RSC.
- (a) X. Sun, W. Zhai, J. S. Fossey and T. D. James, Chem. Commun., 2016, 52, 3456 RSC; (b) X. Wu, X.-X. Chen and Y.-B. Jiang, Analyst, 2017, 142, 1403 RSC.
- (a) L. B. Chen and S. T. Smiley in Fluorescent and Luminescent Probes for Biological Activity: A Practical Guide to Technology for Quantitative Real-Time Analysis, ed. W. T. Mason, Academic, 2nd edn, 1993, p. 124 Search PubMed; (b) J. F. Buckman, H. Hernandez, G. J. Kress, T. V. Votyakova, S. Pal and I. J. Reynolds, J. Neurosci. Methods, 2001, 104, 165 CrossRef CAS PubMed.
- (a) S. V. Pande and R. Parvin, J. Biol. Chem., 1976, 251, 6683 CAS; (b) S. V. Pande, Proc. Natl. Acad. Sci. U. S. A., 1975, 72, 883 CrossRef CAS PubMed.
- L. Baillet, R. S. Mullur, V. Esser and J. D. McGarry, J. Biol. Chem., 2000, 275, 36766 CrossRef CAS PubMed.
- A. T. Frawley, H. V. Linford, M. Starck, R. Pal and D. Parker, Chem. Sci., 2018, 9, 1042 RSC.
- H. J. Ziegler, P. Bruckner and F. Binon, J. Org. Chem., 1967, 32, 3989 CrossRef CAS PubMed.
Footnotes |
| † Electronic supplementary information (ESI) available: Supplementary figures and tables and copies of the 1H and 13C NMR (1D and 2D) spectra of the new compounds. See DOI: 10.1039/c9sc04852a |
| ‡ The new BCT probes were patented in Spain in 2017 by authors of this paper (patent application PCT/ES2018/070477). |
| This journal is © The Royal Society of Chemistry 2020 |

