 Open Access Article
Effects of ring-strain on the ultrafast photochemistry of cyclic ketones†
Min-Hsien
Kao
 ,
Ravi Kumar
Venkatraman
 ,
Michael N. R.
Ashfold
 and
Andrew J.
Orr-Ewing
 *
*
School of Chemistry, University of Bristol, Cantock's Close, Bristol BS8 1TS, UK. E-mail: a.orr-ewing@bristol.ac.uk
First published on 13th January 2020
Abstract
Ring-strain in cyclic organic molecules is well-known to influence their chemical reactivity. Here, we examine the consequence of ring-strain for competing photochemical pathways that occur on picosecond timescales. The significance of Norrish Type-I photochemistry is explored for three cyclic ketones in cyclohexane solutions at ultraviolet (UV) excitation wavelengths from 255–312 nm, corresponding to an π* ← n excitation to the lowest excited singlet state (S1). Ultrafast transient absorption spectroscopy with broadband UV/visible probe laser pulses reveals processes common to cyclobutanone, cyclopentanone and cyclohexanone, occurring on timescales of ≤1 ps, 7–9 ps and >500 ps. These kinetic components are respectively assigned to prompt cleavage of an α C–C bond in the internally excited S1-state molecules prepared by UV absorption, vibrational cooling of these hot-S1 molecules to energies below the barrier to C–C bond cleavage on the S1 state potential energy surface (with commensurate reductions in the energy-dependent α-cleavage rate), and slower loss of thermalized S1-state population. The thermalized S1-state molecules may competitively decay by activated reaction over the barrier to α C–C bond fission on the S1-state potential energy surface, internal conversion to the ground (S0) electronic state, or intersystem crossing to the lowest lying triplet state (T1) and subsequent C–C bond breaking. The α C–C bond fission barrier height in the S1 state is significantly reduced by the ring-strain in cyclobutanone, affecting the relative contributions of the three decay time components which depend systematically on the excitation energy above the S1-state energy barrier. Transient infra-red absorption spectra obtained after UV excitation identify ring-opened ketene photoproducts of cyclobutanone and their timescales for formation.
Introduction
The Norrish Type-I ultraviolet (UV) photochemical reactions of aldehydes and ketones involve cleavage of a C–C bond adjacent to the carbonyl-group chromophore (i.e. α-cleavage), and have a long history of study dating back to the pioneering mechanistic investigations by Norrish and Bamford.1 The accepted mechanism for Norrish Type-I α-cleavage is UV photoexcitation of an electron from a non-bonding orbital (n) on the carbonyl oxygen atom to a π* molecular orbital of the carbonyl group (a weak π* ← n excitation, which is symmetry forbidden in the planar limit), followed by C–C bond cleavage in the first excited singlet (S1) or triplet (T1) state. The initial outcome is either two separate radical species, if the parent carbonyl compound is non-cyclic, or a biradical species if the parent is a cyclic ketone.2 This Norrish photo-chemistry has been extensively exploited in a wide range of experiments, including photoinitiated polymerization, and chemical synthesis.3–13 It is also significant in the photolysis of volatile carbonyl compounds such as acetone in the Earth's atmosphere.14–18The biradical intermediates formed by α-cleavage of a cyclic ketone can further react in several different ways, with pathways that depend on the ring size of the ketone. UV-excited cyclobutanone, with only a four C-atom ring, has been reported to form either ethene and ketene, or CO and cyclopropane/propene photoproducts in both the gas phase and solution.19–21 In contrast, cyclohexanone can photo-decompose to an alkene and CO, or photo-isomerize to 2-methyl-cyclopentane, 5-hexenal or 1-hexen-1-one.22–28 Similarly, cyclopentanone isomerizes to 4-pentenal when irradiated with UV light at 313 nm or 254 nm.29
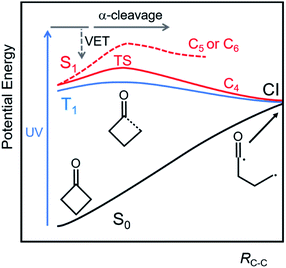
One way in which the ring size influences the photochemical reaction pathways of cyclic ketones is through the degree of ring strain. According to calculations using the CBS-APNO level of theory, the ring strain energies of cyclohexanone and cyclopentanone are approximately 29 and 41 kJ mol−1, respectively, whereas for cyclobutanone the corresponding value is significantly higher at ∼120 kJ mol−1.30 Greater ring strain facilitates ring opening pathways in Norrish Type-I photochemistry. Xia et al. computed potential energies for extension of the α C–C distance for the S1 and T1 states of cyclobutanone, cyclopentanone and cyclohexanone using complete active space self-consistent field (CASSCF) and second-order perturbation theory (MS-CASPT2) methods.31 Their results identified only a modest (∼29 kJ mol−1 relative to the S1 state minimum) energy barrier for α C–C cleavage in the S1 state of cyclobutanone because C–C bond extension relieves the ring strain, whereas the corresponding barrier heights for cyclopentanone and cyclohexanone are ∼63 kJ mol−1 or more. In contrast, the calculations show no significant barriers to α C–C bond cleavage on the T1-state potential energy surfaces of these molecules, suggesting cyclopentanone and cyclohexanone can undergo facile α-cleavage in this triplet state after intersystem crossing (ISC) from S1, as is shown schematically in Fig. 1.31 Nevertheless, molecular dynamics simulations by Shemesh et al., using the semi-empirical OM2/MRCI method to compute potential energies, showed most photoexcited cyclohexanone molecules (with a range of internal energies in the S1 state) reacting on timescales shorter than 100 ps, i.e. at a rate that out-competes ISC. Thus these calculations suggest that α-cleavage is possible for S1 state cyclohexanone molecules with sufficient internal energy.28
Both the relative yields of competing photoproducts of cyclobutanone photochemistry, and the intensity of its excited state emission, vary with UV excitation wavelength.32 In the gas phase, the ratio of the ethene + ketene channel to CO + cyclopropane/propene formation drops from 7 to 0.4 when the excitation wavelength decreases from ∼340 nm to ∼310 nm.33 Furthermore, the lifetime of the cyclobutanone S1 state reduces in the gas phase or in cyclohexane solution, and consequently the fluorescence emission intensity declines rapidly, for excitation wavelengths below 320 nm.34 The fluorescence quantum yields (Φf) of cyclopentanone and cyclohexanone also decrease with shorter excitation wavelength, but to a lesser extent than for cyclobutanone.32,34–36 At wavelengths around 310 nm, the three cyclic ketones have Φf values of ∼0.2%.36
Femtosecond time-resolved spectroscopy has also been applied to study Norrish Type-I photochemistry in the gas phase, with Zewail and coworkers observing the kinetics of α-cleavage in cyclobutanone. At an excitation wavelength of 307 nm (corresponding to an energy above, but close to the S1 barrier height), a measured time constant of ∼5 ps was assigned to C–C bond fission.37 The current study extends this ultrafast time-resolved spectroscopy approach to the condensed phase, and to a range of UV excitation wavelengths, to explore the effects of S1-state internal energy on excited state pathways. It compares the photochemistry of cyclobutanone with cyclopentanone and cyclohexanone to examine the consequences of ring strain on the Norrish Type-I pathway. Cyclohexane was chosen as a medium for all the reported measurements to study the effects of competition between direct α-cleavage and S1-state relaxation by vibrational energy transfer (VET) (Fig. 1). In this weakly interacting solvent, we do not expect solute–solvent interactions to modify significantly the excited state potentials and energy barriers compared to the gas phase. Transient electronic absorption spectroscopy (TEAS) reveals the timescales for decay of S1 population in these three molecules, whereas transient vibrational absorption spectroscopy (TVAS) identifies some of the active ring-opening reaction pathways.
Experimental methods
Transient absorption spectra were measured using an ultrafast laser system at the University of Bristol which has been described elsewhere.38,39 A Coherent Vitara-S oscillator generated 800 nm pulses of 35 fs duration which were amplified in a 5 W, 1 kHz repetition rate Coherent Legend Elite HE+ regenerative amplifier. The amplified 800 nm output beam was split into three portions, one of which was used to generate a white-light continuum (WLC) in a flat CaF2 optic to provide the probe beam for TEAS. The other two beams seeded separate Coherent OPerA Solo optical parametric amplifiers (OPAs). One OPA generated UV pulses at user-selected wavelengths for excitation of the sample solutions, and the second OPA produced tunable IR probe pulses (∼300 cm−1 bandwidth) for TVAS by difference frequency generation. The WLC probe pulses were linearly polarized at magic angle (54.7°) to the pump laser pulse polarization. A rotating chopper wheel (Thorlabs, MC2000) blocked every other UV pump laser pulse to produce difference spectra with and without UV laser excitation. Time delays (Δt) between the pump and probe lasers were varied up to a maximum value of 1.3 ns using a retroreflecting mirror mounted on a 220 mm motorized delay stage (Thorlabs, DDS220/M).Cyclobutanone (99%, Sigma-Aldrich), cyclopentanone (≥99.0%, Sigma-Aldrich ReagentPlus) and cyclohexanone (≥99.0%, Sigma-Aldrich, ACS reagent) were used without further purification to prepare 1 M solutions in cyclohexane (Supelco, Spectroscopy grade). These solutions were circulated by a peristaltic pump through a stainless-steel sample cell fitted with two 1.5 mm thick CaF2 windows separated by a 380 μm Teflon spacer.
TEA spectra were collected by focusing the transmitted WLC probe into a spectrograph (Andor, Shamrock 163) fitted with a 1024-element photodiode array (Entwicklungsbüro Stresing). TVAS measurements with mid-IR probe laser pulses instead used a 128-element, liquid-N2 cooled Mercury Cadmium Telluride (MCT) array detector (Infrared Associates Inc., MCT-10-128) and read-out electronics (Infrared Systems Development Corp., FPAS-0144) coupled to a spectrometer (Horiba Scientific, iHR320). A second such spectrometer provided a reference signal, using a portion of the probe IR beam which by-passed the sample, to reduce noise from shot-to-shot fluctuations in the IR beam intensity. The spectrometer outputs were recorded using custom-written LabVIEW software, and transient absorption spectroscopy data were processed using the KOALA program.40 This in-house developed software package was used to decompose the time-dependent transient absorption spectra into their time-evolving components for kinetic fitting.
Steady-state UV/vis absorption spectra of the samples in a 2 mm-pathlength cuvette were obtained using a GENESYS™ 10S UV-Vis Spectrophotometer (Thermo Scientific). Corresponding IR absorption spectra were measured by a Spectrum Two FTIR Spectrometer (PerkinElmer), with samples held in cells of the type used for transient absorption spectroscopy but with CaF2 windows separated by 100 μm Teflon spacers.
Results and discussion
a. Transient electronic absorption spectra
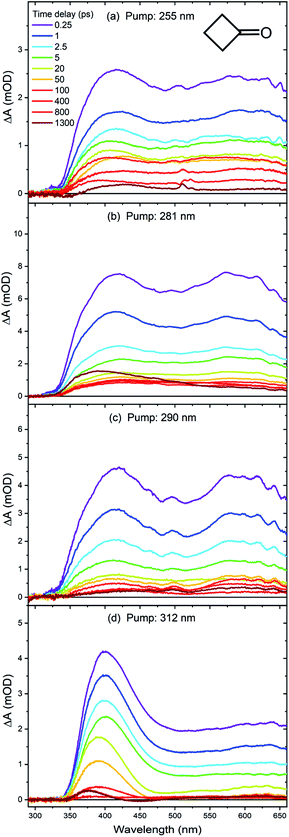
The weak π* ← n, S1–S0 absorption band of cyclobutanone is typical of a carbonyl compound,35,41 and spans UV wavelengths from 240–330 nm, with a maximum absorbance close to 280 nm in cyclohexane solution. Cyclopentanone and cyclohexanone have similar π* ← n absorption bands, with respective maxima at ∼300 and 290 nm. Example UV/visible spectra are shown in Fig. S1 of the ESI.† The UV excitation wavelengths selected for TEAS measurements were λexc = 255, 281, 290 and 312 nm to span much of the range of these weak absorption features, with the longer wavelengths accessing regions of the S1 state only just above the energy of the barriers for excited-state α C–C bond fission.Fig. 2 shows representative TEA spectra of cyclobutanone in cyclohexane at the four different excitation wavelengths. Different colour traces correspond to spectra obtained at various time delays shown by the inset key. At the shortest chosen pump wavelength of 255 nm, two broad peaks are observed in the excited state absorption (ESA) bands, located at around 420 nm and 600 nm. Similar structures are evident in the transient spectra obtained at λexc = 281 nm and 290 nm. However, the 600 nm ESA feature is no longer as distinct when a cyclobutanone solution is excited with 312 nm UV light. The intensities of the transient absorption bands decay almost to zero over the timescale of our measurements (with maximum time delays of 1300 ps). Any stimulated emission contribution to the TEA spectra is expected at wavelengths around 350–500 nm, but will be weak in comparison to transition-dipole allowed Sm ← S1 (m > 1) ESA bands because the S1→ S0 π*→ n transition involved is forbidden in the planar limit.
The transient absorption spectra reflect the degree of internal (vibrational) energy of the photoexcited S1 state molecules, and perhaps some T1-state contributions after ISC, because other electronically excited states are not accessible at the pump photon energies. At the shortest time delay of Δt = 0.25 ps, the vibrational excitation of the S1-state molecules will not have had time to relax by coupling to the degrees of freedom of the solvent bath for a weakly interacting solvent such as cyclohexane.42,43 Hence, for each excitation wavelength data set, we used the corresponding early time (ET) spectrum (Δt = 0.25 ps) as a basis function to model the contribution from vibrationally hot S1-state molecules to the TEA spectra. This single basis spectrum, with steadily decreasing amplitude, was sufficient to describe well the temporal evolution of the broadband, time-resolved TEA spectra of cyclobutanone in cyclohexane for pump wavelengths of 255 nm, 281 nm and 290 nm. However, at λexc = 312 nm, the spectral decomposition analysis required inclusion of a second basis function, which was chosen to be the TEA spectrum obtained at Δt = 50 ps, denoted here as a medium-time (MT) spectrum. Fig. S2 of ESI† illustrates this spectral fitting to ET and MT basis functions for the 312 nm excitation of cyclobutanone, giving the data plotted in Fig. 3(d). We interpret the MT spectrum as representing the absorption by S1-state cyclobutanone molecules which have undergone vibrational cooling to internal energies below the S1 α-cleavage barrier. On the basis of the analysis presented below, we determine that this vibrational cooling is essentially complete on a timescale shorter than 50 ps. Our interpretation of the MT basis spectrum is supported by evidence from steady-state fluorimetry measurements of weak fluorescence at blue and green wavelengths corresponding to emission from a fraction of the photoexcited S1 molecules which avoid photochemical pathways and instead relax to the lowest S1 vibrational level.33,34,44 This fraction (as judged from the relative fluorescence intensities) is greatest at the longest excitation wavelengths used in the current time-resolved studies.
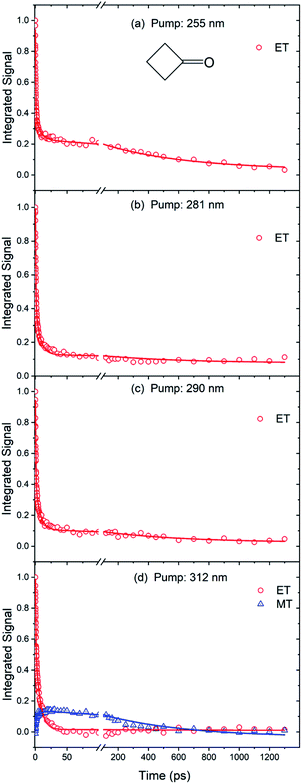 | ||
| Fig. 3 Kinetics of cyclobutanone (S1) relaxation obtained by analysis of TEA spectra (Fig. 2) measured at four UV excitation wavelengths. Red and blue symbols are intensities obtained from the fits to ET and MT basis functions (see main text). The solid lines are a global fit of all the data sets to tri-exponential decay functions, yielding decay components with common time constants of 0.65 ± 0.02, 7.0 ± 0.2 and 550 ± 45 ps. | ||
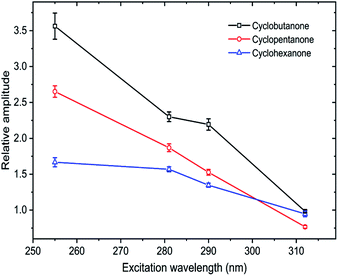
Fitting of the time-dependent spectra of Fig. 2 to the chosen basis spectra was performed in KOALA,40 and gave the decays of ESA band intensities plotted in Fig. 3. The kinetics of the decays can be extracted by global fitting (in Origin) of all the data for multiple excitation wavelengths using tri-exponential functions, yielding time constants of τ1 = 0.65 ± 0.02 ps, τ2 = 7.0 ± 0.2 ps and τ3 = 550 ± 45 ps. The corresponding amplitudes of the separate time components extracted from the ET basis function fits are reported in Table S1 of ESI,† and the ratios of amplitudes for the τ1 and τ2 components are plotted in Fig. 4. Such amplitude ratios quantify the relative importance of each mechanistic contribution to the S1-state decay. As the UV pump wavelength increases (and photon excitation energy decreases), the relative contribution of the fastest (0.65 ps) time component becomes less significant. Because of the timescale, this component is attributed to direct α C–C bond cleavage in the S1 state. The wavelength-dependent trend suggests that with decreasing initial internal energy, a smaller fraction of the UV-excited molecules directly traverses the barrier to α C–C bond fission on the S1 potential energy surface. Surmounting this energy barrier will require internal vibrational energy redistribution (IVR) if the initial photoexcitation does not place sufficient initial energy in motion along, or strongly coupled to, the reaction coordinate. The observed 7.0 ps timescale may therefore be associated in part with this IVR,37 consistent with its increasingly prominent role as the total internal energy decreases (λex increases).
Any remaining absorption apparent in the late-time cyclobutanone TEA spectra, interpreted as arising from vibrationally cooled S1 molecules, should be treated with some caution because of the weakness of the features. Moreover, band shapes are not fully resolved because the WLC probe does not extend to wavelengths below ∼350 nm.
Selected TEA spectra for cyclopentanone in cyclohexane at two of the four different excitation wavelengths are displayed in Fig. 5. ESI Fig. S5† shows the corresponding TEA spectra of cyclopentanone at the other excitation wavelengths. These transient spectra have similar characteristics to those for cyclobutanone. The TEA spectra are again broad and mostly featureless, but with maxima at wavelengths around 400 nm and 600 nm for λexc = 255 nm, 281 nm and 290 nm. For λexc = 312 nm, the 400 nm transient absorption band is the most prominent, and in all cases a feature peaking at wavelengths between 350 and 400 nm remains clearly visible in spectra obtained at Δt = 1300 ps, in contrast to the almost complete decay of ESA for cyclobutanone.
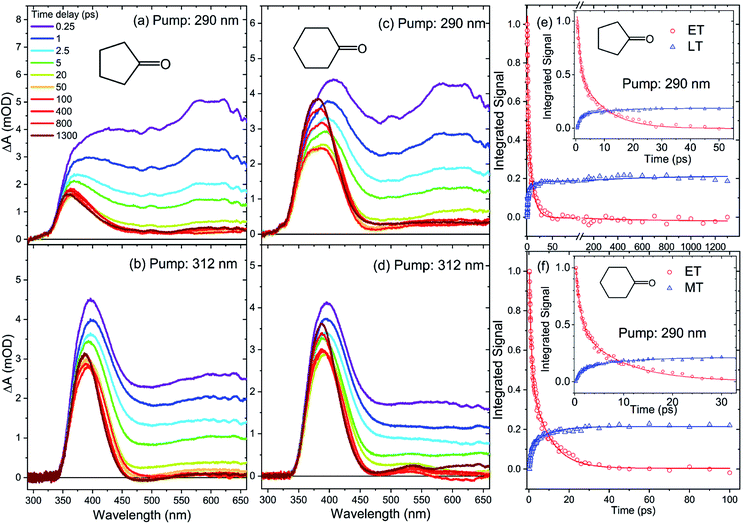 | ||
| Fig. 5 TEA spectra of cyclopentanone (a and b) and cyclohexanone (c and d) in cyclohexane, obtained with excitation wavelengths of 290 nm and 312 nm. The spectra were recorded at different pump–probe time delays, as indicated by the inset colour key in panel (a). Plots in the right-hand column show the kinetics of excited-state (e) cyclopentanone or (f) cyclohexanone relaxation obtained by analysis of the TEA spectra, with the early time behavior shown in the insets on an expanded scale. Red and blue symbols in (e) and (f) are intensities obtained from the fits using ET and MT or LT basis functions (see main text). For each molecule, the solid lines are a global fit to tri-exponential decay functions derived from TEA spectra obtained at the two excitation wavelengths shown here and from 255 and 281 nm excitation reported in ESI.† | ||
Spectral decomposition in KOALA followed a similar approach to that described above for the cyclobutanone TEAS studies: data were fitted to an ET basis function obtained at Δt = 0.25 ps, but in this case it was also necessary to include a second basis function denoted as late-time (LT) to account for the full time-evolution of the spectra. The LT basis function was chosen to be the spectrum obtained at Δt = 1300 ps for each of the different λexc data sets. An example spectral decomposition is shown in Fig. S3 of ESI.† This analysis reveals continual decay of the ET contribution and corresponding growth of the LT feature, as shown in Fig. 5. Fig. S5 of the ESI† shows the corresponding kinetics and fitting for cyclopentanone excited at two further UV wavelengths. A global kinetic fit with tri-exponential functions yields common time constants of τ1 = 0.95 ± 0.03 ps, τ2 = 8.5 ± 0.3 ps and τ3 = 600 ± 100 ps for excited-state cyclopentanone, and we again focus on the relative amplitudes which are reported in Table S2 of ESI.† The fastest (τ1) component dominates at λexc = 255 nm but, as Fig. 4 shows, its relative amplitude decreases as the excitation wavelength increases.
Selected TEA spectra obtained for solutions of cyclohexanone in cyclohexane are also shown in Fig. 5, with spectra measured for the two other UV excitation wavelengths reported in Fig. S6 of the ESI.† The transient spectra for cyclohexanone bear superficial resemblance to the data obtained for cyclopentanone. At an excitation wavelength of 255 nm, the ESA bands decay in a similar fashion to cyclopentanone, leaving a residual absorption band centred just below 400 nm. However, close inspection of the spectra obtained at λexc = 281 nm, 290 nm and 312 nm reveals a rapid decline in the broad absorption band for time delays up to Δt = 50 ps, and the growth and narrowing of a band centred near 370 nm at time delays longer than 140 ps. Spectral decomposition therefore required use of three basis functions: ET and LT functions were represented by Δt = 0.25 ps and 1300 ps TEA spectra, respectively, and a middle-time (MT) function was added using the spectrum obtained at Δt = 100 ps. This time delay was chosen because the ESA signals above 475 nm are weak and unchanging after 50 ps, so the ET basis function no longer contributes to the overall TEA spectra after this time. Moreover, the narrower band located around 370 nm does not evolve in shape and intensity over time delays from 50 to 140 ps, at which point there is an onset of growth and a change to the band shape in this spectral region. Hence, the kinetics can be cleanly divided into a short-time (Δt ≤ 100 ps) and a long-time (Δt ≥ 100 ps) component. The short time data were analyzed by spectral decomposition using the ET and MT basis functions (see Fig. S4 of ESI† for an example), to give time-dependent band intensities of the type shown in Fig. 5. For time delays in excess of 100 ps, the MT and LT basis functions were used instead. However, the time constants obtained are greater than our measurement time window. Because of the associated uncertainty, these values are not reported.
As Fig. S6 of the ESI† shows, the decay and growth kinetics of ESA features for cyclohexanone in cyclohexane at time delays up to 100 ps can be globally fitted for all excitation wavelengths with bi-exponential functions with shared time constants. One example of this fitting is reproduced in Fig. 5. The common time constants emerging from these fits are τ1 = 1.02 ± 0.03 ps and τ2 = 8.9 ± 0.3 ps. Fit amplitudes are reported in Table S3 of the ESI.† The ratio of the amplitudes for the τ1 and τ2 components decreases from 1.67 ± 0.06 to 0.95 ± 0.04 with increasing pump wavelength (Fig. 4). The relative amplitude of the spectral component with shortest time constant is smaller for cyclohexanone than for cyclobutanone, suggesting a lesser contribution from the direct S1-state α-cleavage mechanism proposed to be responsible for the ≤1 ps ESA loss. The growth kinetics of the long-time component are well-described by a mono-exponential function with a common time constant τ3 > 1200 ps for all excitation wavelengths. Consequently, we conclude that there is a new species forming on timescales longer than our 1.3 ns time window for transient spectroscopy measurements.
b. Transient vibrational absorption spectra
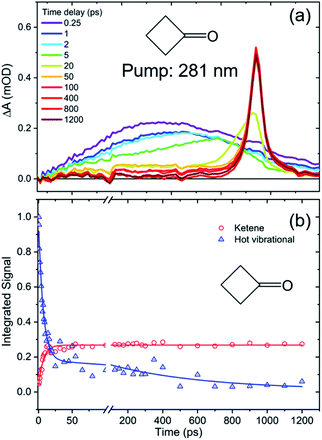
The TEA spectra presented in the preceding section reveal the decay of excited S1-state populations in the three cyclic ketones after UV excitation, but further valuable photochemical insights derive from TVA measurements. In particular, TVAS provides information about the photoproducts, and their formation timescales. Cyclobutanone and cyclohexanone have previously been reported to form ring-opened compounds containing a ketene functional group,19,21,26,27,45 so TVA spectra were measured for all three cyclic ketones in the mid-IR region around 2100 cm−1,26,46–48 using a UV pump wavelength of λexc = 281 nm. At this excitation wavelength, only the TVA spectra of cyclobutanone solutions showed a ketene band signal on timescales up to our maximum delay. Fig. 6 shows illustrative TVA spectra for cyclobutanone: a broad feature evident at early time delays is assigned to vibrationally excited ketene photoproducts of the ring-opening pathway.49,50 This broad feature narrows and shifts to higher wavenumber on a timescale of ≤50 ps, which is a signature of vibrational cooling by loss of excess internal energy to the solvent bath. A sharp feature which develops at 2135 cm−1 is the fundamental band of the thermalized ketene photoproduct. The presence of the hot ketene band, even at the earliest time delays of 0.25 ps, clearly indicates an ultrafast ring-opening pathway for the S1-state cyclobutanone molecules, which is absent in cyclopentanone and cyclohexanone at the same excitation wavelength. The subsequent relaxation kinetics of the nascent, vibrationally hot photoproducts and the growth of the ketene fundamental band (obtained by the spectral decomposition method shown in Fig. S7 of ESI†) can be globally fitted to biexponential functions with shared time constants of 7 ps and 550 ps. The former component dominates and is attributed to vibrational cooling of the promptly (sub-ps) formed ketene molecules. The likely mechanism for sub-ps formation of the ketene photoproducts is rapid crossing of the low S1 barrier to access an S1/S0 conical intersection (see Fig. 1) and further isomerization or fragmentation of the internally excited S0-state molecules51 on timescales much faster than vibrational energy transfer to the solvent.Fig. S8 of ESI† shows that the ketene can also be formed by photoexcitation at λexc = 255 nm and 312 nm. However, the observed ketene signals are too weak to allow a full kinetic analysis, suggesting other pathways out-compete ketene formation. Our inability to observe ketene photoproduct bands following photoexcitation of either cyclopentanone or cyclohexanone under otherwise identical conditions at λexc = 255 nm, 281 nm or 312 nm points to low quantum yields for the ketene forming channels. Instead, rival photochemical pathways must dominate following Norrish Type I α-cleavage on the S1 state potential energy surface or, at later times, after ISC to the T1 state. We see no evidence in any of these spectra for photochemical release of CO (with an IR band expected near 2140 cm−1) on the timescale of our measurements.
The observation of further photoproducts of the Norrish Type-I photochemistry is hindered by the strength of the parent IR absorption bands in the carbonyl stretching region. Fig. S9 and S10 of the ESI† show examples of TVAS data for cyclobutanone and cyclohexanone measured in this region. Tentative analysis of transient features, which are heavily overlapped by the strong ground-state parent bands, suggests relaxation times of 7 ps and 9 ps for the respective cyclic ketones. These observations are indicative of vibrational cooling but provide no additional insights.
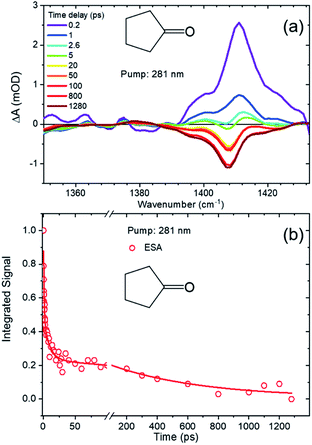
More information was derived from TVAS measurements in the 1200–1400 cm−1 region, which showed transient IR bands corresponding to ring vibrational motions. TVA spectra of cyclobutanone in this mid-IR region are shown in ESI Fig. S11† and are dominated by a negative-going feature which becomes deeper with increasing time delay. Negative-going bands in TVAS indicate stimulated emission or depletion of parent ground-state population (i.e. a ground-state bleach (GSB)). Both these contributions are expected to be greatest at early time delays. The apparent growth of the negative-going feature, which we attribute to GSB on the basis of steady-state FTIR spectra of cyclobutanone in cyclohexane solutions, indicates decay of an overlapping ESA band. Decomposition of these two components, by fitting to Gaussian functions in Origin, extracted the decaying ESA contribution shown in Fig. S11.† This decay is well described by a bi-exponential function with time constants of τ1 = 0.6 ps and τ2 = 7 ps taken from analysis of TEAS data (Fig. 2 and 3).
Fig. 7 shows example TVAS data obtained for cyclopentanone in the same spectral region. Here, the evidence for overlapping ESA and GSB contributions is more clear-cut. The GSB assignments were confirmed by comparison to steady-state FTIR measurements of cyclopentanone solutions in cyclohexane. The ESA decay kinetics can now be isolated by subtracting the GSB spectrum observed at the longest time delay from all other transient spectra (on the assumption that there is no significant population relaxation to the ring-closed and ground-state parent on the timescale of the measurements). Integrated ESA band intensities decay with time delay as shown in Fig. 7, and are successfully modelled by a tri-exponential function with the three time constants fixed to the values τ1 = 0.9 ps, τ2 = 9 ps and τ3 = 600 ps obtained from analysis of the TEA spectra. A similar analysis of TVA spectra of cyclohexanone shown in Fig. S12 of ESI† confirms ESA decay with time constants of τ1 = 1 ps, τ2 = 9 ps and τ3 = 1300 ps derived from the corresponding TEAS measurements.
Butylketene was previously reported as a major photoproduct when gas phase cyclohexanone was exposed to 311 nm radiation for an hour,26 but the present TVAS studies show no sign of ketene absorption following excitation at wavelengths of 281 nm or 255 nm and time delays up to 1300 ps. These shorter wavelength UV photons populate the S1 state further above the energy barrier to C–C bond fission than at λexc = 311 nm. Hence, a greater relative yield of ring-opened photoproducts might be expected in the present experiments if dynamics on the S1 state dominate. Our TVAS observations also show no detectable ketene photoproduct bands within 1300 ps for excitation at λexc = 312 nm. When contrasted with the outcomes from the steady-state 311 nm irradiation studies, our results point to butylketene formation after ISC to the parent T1 state or isomerization of hot S0 molecules. The former pathway is apparently too slow for our experimental measurements to observe, and the latter may be quenched in solution by vibrational energy transfer to the solvent.
c. Mechanistic interpretation of TEAS and TVAS measurements
The consistency of outcomes of the analysis of TEAS and TVAS measurements supports the following interpretation of the photochemical dynamics of the three cyclic ketones studied. In each compound, the fastest time constant (τ1 ≤ 1 ps) is assigned to unimolecular reaction of the S1-state ketone formed with excess vibrational energy by UV-photon absorption from the ground state. The internal energies of these hot S1 molecules lie above the barrier for α C–C bond fission on the respective S1 state potential energy surfaces, so Norrish Type-I α-cleavage can occur promptly. The relative amplitudes of these fastest time components of the excited-state decay decline with increasing wavelength (lower photon energy), consistent with a reduction in the excess internal energy above the bond-fission barrier. These direct C–C bond breaking dynamics are most pronounced for UV-excited cyclobutanone because the C–C bond extension alleviates the C4 ring strain as the transition state is approached, giving a smaller S1 barrier height (∼29 kJ mol−1 compared to ≥63 kJ mol−1 for cyclopentanone and cyclohexanone). The rapid S1-state bond dissociation dynamics are reflected in the sub-picosecond growth of TVAS bands associated with photoproducts. In the case of cyclobutanone, one product of this photochemistry is a ketene-containing compound most likely formed via internal conversion to S0 through an S1/S0 conical intersection (Fig. 1),51 but other direct photoproducts of this and the other cyclic ketones were not identified.In competition with the ultrafast passage over the bond-fission barrier, hot S1 molecules experience interactions with solvent molecules which deplete their excess internal energy. This pathway is not operative in photochemical studies of the isolated molecules in the gas phase at low pressure, but it plays a significant role in solution even for a weakly interacting solvent such as cyclohexane. The time constant for this vibrational cooling is 7–9 ps, and it is reflected in the decay of ESA signatures in TEAS measurements both by evolution of the ESA band shapes, and because, as the hot S1 molecules relax towards the minimum on the S1 potential energy surface, their unimolecular bond-fission rates decrease. A similar time constant for vibrational cooling is observed in the relaxation of the nascent, highly internally excited ketene products of the ring-opening photochemical dynamics of cyclobutanone. IVR of internally excited S1 molecules, placing enough energy along the reaction coordinate for passage over the S1 C–C α-cleavage barrier, may also contribute to the 7–9 ps changes in the transient absorption spectra.
A third component of ESA decay occurs on timescales of 500 ps or more and is attributed to reaction of photoexcited molecules which have relaxed to energies below the S1-state barrier for bond fission. This pathway is more evident for cyclohexanone and cyclopentanone than for cyclobutanone because of the reduction in the S1 energy barrier height associated with release of ring strain for the latter cyclic ketone. Reaction might be through thermal activation of S1 molecules in the room-temperature solvent, or by intersystem crossing to the T1 state which, for the three molecules studied, is computed to have a lower barrier to bond-breaking.31 Build-up of T1-state population will be limited by the rate at which it decays to S0 by a second ISC in a region of near-degeneracy of the two potential energy surfaces at extended C–C bond distance (Fig. 1). Nevertheless, the evolution of the ESA bands in cyclohexanone at longer time delays may be indicative of population of the T1-state by ISC from S1 because the distinct late-time spectral components grow in intensity. The likelihood of occurrence of this slower photochemical pathway increases as the photon energy decreases, consistent with the idea of competition between direct over-the-barrier reaction of internally hot molecules, and solvent induced relaxation to energies below the S1 barrier, with only the latter route leading to T1. Direct S1 to S0 internal conversion or radiative decay in the vicinity of the minimum on the S1-state PES is likely to be slower (with ∼3 ns fluorescence lifetime)36 and therefore not to compete.
Conclusions
Norrish Type-I α-cleavage of cyclic ketones in cyclohexane solution is observed to occur on sub-picosecond time scales, with a propensity that depends on the UV photon energy absorbed. Competition is observed between direct bond fission over a barrier on the S1 state potential energy surface, and slower indirect photochemical pathways favored by solvent-quenching of the excess internal energy of molecules photo-excited above the minimum energy of the S1 state. These indirect pathways occur on timescales in excess of 500 ps for cyclobutanone, cyclopentanone and cyclohexanone, and may involve thermal reactivation above the S1 barrier or intersystem crossing to the T1 state and subsequent dynamics. The ring-strain in the cyclobutanone has a pronounced effect on the photochemistry, with a resulting lower barrier to C–C bond fission in the S1 state compared to cyclopentanone or cyclohexanone which promotes direct ring-opening pathways. Observed products of the cyclobutanone photochemistry include compounds containing ketene functional groups.Conflicts of interest
There are no conflicts to declare.Data files
Data are available at the University of Bristol data repository, data.bris, at https://doi.org/10.5523/bris.f31my8udw5f523a2s2i1e4o3q.Acknowledgements
The Ultrafast Laser Laboratory at the University of Bristol was established with funding from ERC Advanced Grant 290966 CAPRI. R.K.V. gratefully acknowledges the Royal Society (London, U.K.) and the SERB (India) for award of a SERB-Royal Society Newton International Fellowship.References
- R. G. W. Norrish and C. H. Bamford, Nature, 1936, 138, 1016 CrossRef CAS.
- N. J. Turro, N. Schore, R. Hautala, G. Farrington, M. Niemczyk, D. Morton, J. C. Dalton and K. Dawes, Acc. Chem. Res., 1972, 5, 92–101 CrossRef CAS.
- B. M. El-Zaatari, S. M. Cole, D. J. Bischoff and C. J. Kloxin, Polym. Chem., 2018, 9, 4772–4780 RSC.
- J. Kossanyi, B. Furth and J. P. Morizur, Tetrahedron Lett., 1973, 14, 3459–3462 CrossRef.
- J. C. Scaiano, P. Billone, C. M. Gonzalez, L. Maretti, M. L. Marin, K. L. McGilvray and N. Yuan, Pure Appl. Chem., 2009, 81, 635–647 CAS.
- J. C. Scaiano, K. G. Stamplecoskie and G. L. Hallett-Tapley, Chem. Commun., 2012, 48, 4798–4808 RSC.
- P. Liu, W. B. Liu and C. J. Li, J. Am. Chem. Soc., 2017, 139, 14315–14321 CrossRef CAS.
- K. Arangdad, A. Detwiler, C. D. Cleven, C. Burk, R. Shamey, M. A. Pasquinelli, H. Freeman and A. El-Shafei, J. Appl. Polym. Sci., 2019, 136, 13 Search PubMed.
- S. Arumugam, D. R. Vutukuri, S. Thayumanavan and V. Ramamurthy, J. Am. Chem. Soc., 2005, 127, 13200–13206 CrossRef CAS PubMed.
- R. W. Guo, P. B. Mei, Q. Zhong, Y. Yao, Q. Su and J. H. Zhang, RSC Adv., 2015, 5, 31365–31374 RSC.
- A. C. Jacobs, M. J. E. Resendiz and M. M. Greenberg, J. Am. Chem. Soc., 2011, 133, 5152–5159 CrossRef CAS PubMed.
- J. Jakubiak, M. Nowakowska and X. Coqueret, Bull. Pol. Acad. Sci., Chem., 1997, 45, 71–77 CAS.
- O. Muraoka, M. Okumura, T. Maeda, L. C. Wang and G. Tanabe, Chem. Pharm. Bull., 1995, 43, 517–519 CrossRef CAS.
- H. B. Singh, D. Ohara, D. Herlth, W. Sachse, D. R. Blake, J. D. Bradshaw, M. Kanakidou and P. J. Crutzen, J. Geophys. Res.: Atmos., 1994, 99, 1805–1819 CrossRef CAS.
- A. Chattopadhyay, K. Mondal, M. Samanta and T. Chakraborty, Atmos. Environ., 2017, 157, 125–134 CrossRef CAS.
- F. Domine and P. B. Shepson, Science, 2002, 297, 1506–1510 CrossRef CAS PubMed.
- J. E. Scott, Analyst, 1977, 102, 614–618 RSC.
- H. B. Singh, M. Kanakidou, P. J. Crutzen and D. J. Jacob, Nature, 1995, 378, 50–54 CrossRef CAS.
- H. O. Denschlag and E. K. C. Lee, J. Am. Chem. Soc., 1967, 89, 4795–4797 CrossRef CAS.
- N. E. Lee and E. K. C. Lee, J. Chem. Phys., 1969, 50, 2094–2107 CrossRef CAS.
- N. J. Turro and R. M. Southam, Tetrahedron Lett., 1967, 8, 545–551 CrossRef.
- S. W. Benson and G. B. Kistiakowsky, J. Am. Chem. Soc., 1942, 64, 80–86 CrossRef CAS.
- C. H. Bamford and R. G. W. Norrish, J. Chem. Soc., 1938, 1521–1531 RSC.
- R. G. Shortridge and E. K. C. Lee, J. Am. Chem. Soc., 1970, 92, 2228–2236 CrossRef CAS.
- R. Srinivasan and S. E. Cremer, J. Am. Chem. Soc., 1965, 87, 1647–1651 CrossRef CAS.
- A. Chattopadhyay, K. Mondal, M. Samanta and T. Chakraborty, Chem. Phys. Lett., 2017, 675, 104–110 CrossRef CAS.
- M. D. Hoops and B. S. Ault, J. Mol. Struct., 2009, 929, 22–31 CrossRef CAS.
- D. Shemesh, S. A. Nizkorodov and R. B. Gerber, J. Phys. Chem. A, 2016, 120, 7112–7120 CrossRef CAS PubMed.
- P. Dunion and C. N. Turmbore, J. Am. Chem. Soc., 1965, 87, 4211–4212 CrossRef CAS.
- R. D. Bach and O. Dmitrenko, J. Am. Chem. Soc., 2006, 128, 4598–4611 CrossRef CAS PubMed.
- S. H. Xia, X. Y. Liu, Q. Fang and G. L. Cui, J. Phys. Chem. A, 2015, 119, 3569–3576 CrossRef CAS PubMed.
- J. C. Hemminger and E. K. C. Lee, J. Chem. Phys., 1972, 56, 5284–5295 CrossRef CAS.
- K. Y. Tang and E. K. C. Lee, J. Phys. Chem., 1976, 80, 1833–1836 CrossRef CAS.
- J. C. Hemminger, C. F. Rusbult and E. K. C. Lee, J. Am. Chem. Soc., 1971, 93, 1867–1871 CrossRef.
- M. O'Sullivan and A. C. Testa, J. Chem. Phys., 1973, 77, 1830–1833 CrossRef.
- R. G. Shortridge, C. F. Rusbult and E. K. C. Lee, J. Am. Chem. Soc., 1971, 93, 1863–1867 CrossRef.
- E. W. G. Diau, C. Kotting and A. H. Zewail, ChemPhysChem, 2001, 2, 294–309 CrossRef CAS.
- G. M. Roberts, H. J. B. Marroux, M. P. Grubb, M. N. R. Ashfold and A. J. Orr-Ewing, J. Phys. Chem. A, 2014, 118, 11211–11225 CrossRef CAS PubMed.
- K. Rottger, H. J. B. Marroux, A. F. M. Chemin, E. Elsdon, T. A. A. Oliver, S. T. G. Street, A. S. Henderson, M. C. Galan, A. J. Orr-Ewing and G. M. Roberts, J. Phys. Chem. B, 2017, 121, 4448–4455 CrossRef CAS PubMed.
- M. P. Grubb, A. J. Orr-Ewing and M. N. R. Ashfold, Rev. Sci. Instrum., 2014, 85, 064104 CrossRef PubMed.
- D. A. Hansen and E. K. C. Lee, J. Chem. Phys., 1975, 62, 183–189 CrossRef CAS.
- S. A. Kovalenko, R. Schanz, H. Hennig and N. P. Ernsting, J. Chem. Phys., 2001, 115, 3256–3273 CrossRef CAS.
- T. Elsaesser and W. Kaiser, Annu. Rev. Phys. Chem., 1991, 42, 83–107 CrossRef CAS.
- M. Baba and I. Hanazaki, J. Chem. Phys., 1984, 81, 5426–5433 CrossRef CAS.
- F. E. Blacet and A. Miller, J. Am. Chem. Soc., 1957, 79, 4327–4329 CrossRef CAS.
- N. Y. Dugarte, M. F. Erben, R. M. Romano, R. Boese, M. F. Ge, Y. Li and C. O. Della Vedova, J. Phys. Chem. A, 2009, 113, 3662–3672 CrossRef CAS.
- N. Y. Dugarte, M. F. Erben, R. M. Romano, M. F. Ge, Y. Li and C. O. Della Vedova, J. Phys. Chem. A, 2010, 114, 9462–9470 CrossRef CAS.
- C. D. Hatten, K. R. Kaskey, B. J. Warner, E. M. Wright and L. R. McCunn, J. Chem. Phys., 2013, 139, 214303 CrossRef PubMed.
- D. Murdock, R. A. Ingle, I. V. Sazanovich, I. P. Clark, Y. Harabuchi, T. Taketsugu, S. Maeda, A. J. Orr-Ewing and M. N. R. Ashfold, Phys. Chem. Chem. Phys., 2016, 18, 2629–2638 RSC.
- D. Murdock, S. J. Harris, J. Luke, M. P. Grubb, A. J. Orr-Ewing and M. N. R. Ashfold, Phys. Chem. Chem. Phys., 2014, 16, 21271–21279 RSC.
- B. Marchetti, T. N. V. Karsili and M. N. R. Ashfold, Phys. Chem. Chem. Phys., 2019, 21, 14418–14428 RSC.
Footnote |
| † Electronic supplementary information (ESI) available: Additional experiment results and data analysis, including: steady-state UV/Vis spectra of cyclohexane solutions of the three cyclic ketones; examples of decomposition of time-dependent electronic and vibrational absorption spectra into their spectral components; tables of relative amplitudes of the different exponentially decaying or growing components of transient spectra, and their dependence on choice of cyclic ketone and excitation wavelength. See DOI: 10.1039/c9sc05208a |
| This journal is © The Royal Society of Chemistry 2020 |

