 Open Access Article
ATP-responsive mitochondrial probes for monitoring metabolic processes of glioma stem cells in a 3D model†
Ling
Lin
 a,
Linglu
Yi
 c,
Fanghao
Zhao
a,
Zengnan
Wu
 a,
Yajing
Zheng
a,
Nan
Li
ab,
Jin-Ming
Lin
a,
Yajing
Zheng
a,
Nan
Li
ab,
Jin-Ming
Lin
 *b and
Jiashu
Sun
 *a
*a
aCAS Key Laboratory of Standardization and Measurement for Nanotechnology, CAS Center for Excellence in Nanoscience, National Center for Nanoscience and Technology, Beijing 100190, China. E-mail: sunjs@nanoctr.cn
bBeijing Key Laboratory of Microanalytical Methods and Instrumentation, MOE Key Laboratory of Bioorganic Phosphorus Chemistry & Chemical Biology, Department of Chemistry, Tsinghua University, Beijing 100084, China. E-mail: jmlin@mail.tsinghua.edu.cn
cState Key Laboratory of Biotherapy, Cancer Center, West China Hospital, West China Medical School, Sichuan University, Collaborative Innovation Center of Biotherapy, Chengdu, Sichuan 610064, China
First published on 4th February 2020
Abstract
The metastatic cascade of cancer stem cells (CSCs) is always accompanied by elevated levels of adenosine triphosphate (ATP) as well as the alterntion of energy metabolism to support their differentiation and migration. Here we propose a 3D microfluidic tumor model coupled with an ATP-responsive mitochondrial probe (AMP) for investigation of metabolic processes of glioma stem cells (GSCs). The 3D tumor model has a middle matrix gel microchannel mimicking the extracellular matrix (ECM), which is sandwiched between a GSC culture chamber and a stimulation chamber. The AMPs consist of structure-switching ATP aptamers and triphenylphosphonium (TPP)-conjugated peptide nucleic acids (PNAs). Under TGF-β stimulation, invasive migration of GSCs accompanied by a high ATP level and spindle mesenchymal morphologies is observed due to the epithelial-to-mesenchymal transition (EMT). Moreover, acidic stress can keep GSCs in a low-energy state, while long-term low pH stimulation screens out more malignant glioma cells. This AMP-assisted 3D microfluidic tumor model provides a tremendous opportunity for studying the biological properties of CSCs.
Introduction
Metastasis is mainly responsible for cancer-related mortality, and the presence of a small number of cancer stem cells (CSCs) or stem cell-like tumor cells is directly correlated with the metastatic potential of tumors.1–3 Understanding the biology of CSCs is thus crucial for developing effective therapies and preventing metastasis in patients.4–6 Recent evidence indicates that the epithelial-to-mesenchymal transition (EMT) plays critical roles in the emergence of CSCs and leads to the acquisition of invasive properties of tumor cells.7,8 For example, the EMT process induced by the transforming growth factor TGF-β has proven to be associated with mesenchymal differentiation of glioma stem cells (GSCs) with increased metastatic tropism.9–12 Moreover, certain metabolic processes of CSCs or tumor cells also favor the EMT and metastatic dissemination.13,14 It has been increasingly clear that the metastatic cascade is accompanied by elevated levels of adenosine triphosphate (ATP) interchangeably produced from glycolysis and oxidative phosphorylation (OXPHOS).15 Despite these extensive studies, the biological properties of CSCs have been largely overlooked owing to (i) the conventional two-dimensional (2D) cell culture methods oversimplifying the biological context of tumors, and (ii) the lack of functional probes for monitoring the metabolic processes of CSCs.16Microfluidic platforms are becoming feasible tools to create three-dimensional (3D) tumor models for precisely mimicking tumor microenvironments. In vitro 3D microfluidic tumor models mainly consist of structured microchannels for loading and culturing different types of tumor cells and engineered hydrogels for mimicking the native extracellular matrix (ECM).17,18 3D microfluidic devices have been used for investigation of cell differentiation and migration, reactive oxygen species (ROS) generation, and therapeutic response of tumor cells in more physiologically relevant environments.19 Recent experimental evidence shows that a 3D organotypic microfluidic network can promote the invasive behavior and morphology of GSCs because of the interaction between GSCs and their microenvironment.20,21 For real-time analysis of biochemical properties of GSCs, several capture and detection methodologies including immuno-affinity binding, immunofluorescent staining, nuclei acid amplification reactions, and mass spectrometry have been integrated with microfluidic devices.22–27 The use of new types of fluorescent probes is of particular interest for detection of ATP and ROS in living cells, which support tumor progression.28–36 However, few studies to date have sought to combine 3D microfluidic tumor models with stimuli-responsive mitochondrial probes for studying the metabolic processes of CSCs.
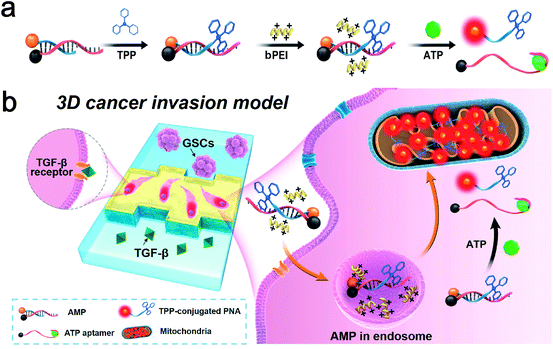
In this work, we report a 3D microfluidic tumor model coupled with an ATP-responsive mitochondrial probe (AMP) for investigation of metabolic processes of GSCs during the TGF-β induced EMT or under acidic pH conditions. The 3D microfluidic device contains one side channel for culturing GSCs, one middle channel filled with a matrix gel, and the other side channel for introduction of TGF-β or an acidic environment. To elucidate the metabolic processes of GSCs during differentiation and migration, the AMP is employed to detect ATP and the mitochondrial activity of GSCs. In the presence of intracellular ATP, the duplex structure of the AMP is disrupted due to the binding of its aptamer strand to ATP. The TPP (a mitochondriotropic ligand)-conjugated peptide nucleic acid (PNA) sequence of the AMP is then released to target mitochondria with the recovery of fluorescence. This AMP-assisted 3D microfluidic tumor model enables real-time analysis of the metabolic state of GSCs, providing a powerful platform for studying the biological properties of CSCs.
Results and discussion
Design and characterization of the ATP-responsive mitochondrial probe (AMP)
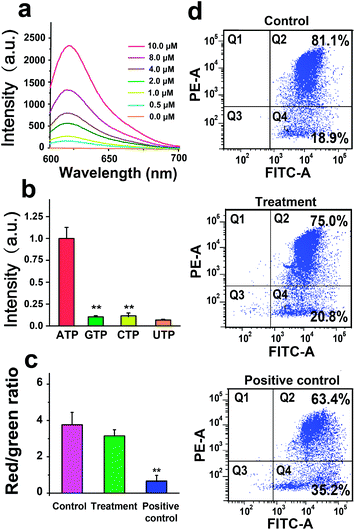
Although it has been long recognized that tumor cells show a predominantly glycolytic metabolism to obtain sufficient ATP, recent investigation reveals that a subpopulation of CSCs relies on OXPHOS for energy production in response to an acidic tumor microenvironment which inhibits glycolysis.37 An increase in ATP generated by mitochondria is suggestive of a switch from glycolysis to OXPHOS, the process of which could be monitored through the use of an ATP-responsive mitochondrial probe (AMP). The AMP consists of a DABCYL (or BHQ2)-labeled structure-switching ATP aptamer, a FITC (or Texas Red)-labeled peptide nucleic acid (PNA) sequence complementary to a part of the aptamer, and triphenylphosphonium (TPP, a mitochondriotropic ligand) conjugated with PNA (Table S1†). The selection of fluorophore and quencher pairs (FITC/DABCYL and Texas Red/BHQ2) is based on the matching of their emission and absorption spectra for fluorescence resonance energy transfer (FRET). The reaction between cysteine residues of PNA and iodobutyltriphenylphosphonium (IBTP) can displace iodide and form stable TPP–PNA conjugates (see the ESI† for experimental details). The AMP is delivered into GSCs by biodegradable polyethylenimines (bPEIs), and the specific binding between intracellular ATP and structure-switching aptamers results in disruption of the duplex structure of the AMP (Fig. 1). The TPP–PNA conjugates released from the AMP can accumulate in the mitochondrial matrix due to the driving nature of membrane potential. The fluorescence signals from chromophore-labeled PNA indicate the distribution and morphology of mitochondria in GSCs.We next investigate the performance of the AMP in response to ATP in PBS. As shown in Fig. 2a, the fluorescence intensity of the AMP (1 μM) increases with increasing the ATP concentration from 0 to 10 μM. Note that no fluorescence from the AMP is observed in the absence of ATP, because the fluorescent signal of Texas Red conjugated with PNA is quenched by the BHQ2-labeled ATP aptamer. To study the specificity, the AMP is treated with 1 μM ATP, GTP, UTP, or CTP, and only ATP results in an elevation of fluorescence intensity of the AMP (Fig. 2b). We then evaluate the biocompatibility of the AMP by measuring the mitochondrial membrane potential (MMP) of U251 cells treated with 1 μM the AMP. The potentiometric dye JC-1 is used to label mitochondria, and the JC-1 red/green fluorescence ratio measured by flow cytometry indicates that the AMP has a negligible effect on MMP (Fig. 2c and d). These investigations demonstrate the good sensitivity, specificity, and biocompatibility of AMPs.
Metabolic process of glioma stem cells (GSCs) detected by using the AMP
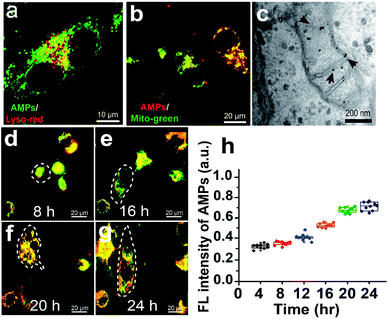
To study the lysosomal escape and mitochondrial targeting of the AMP, U251 cells treated with the bPEI–AMP complex are stained with Lyso-Tracker Red or Mito-Tracker Green to label lysosomes or mitochondria. As shown in Fig. 3a, the AMP can escape from lysosomes, as indicated by separated red (lysosomes) and green (AMPs) fluorescence in U251 cells. With regard to mitochondrial targeting, co-localization of red (AMPs) and green (mitochondria) fluorescence indicates the good targeting ability of the AMP to mitochondria after being activated by intracellular ATP (Fig. 3b). This is attributed to the mitochondrial targeting ability of TPP in TPP-conjugated PNA released from the AMP, verified by the observation of gold nanoparticle-labeled PNA in mitochondria of U251 cells in electron micrographs (Fig. 3c).The AMP is then used to measure the ATP level in GSCs derived from U251 cells and undifferentiated U251 cells (Fig. S1†). As shown in Fig. S2,† the level of intracellular ATP in undifferentiated U251 cells in FBS is approximately 25% lower than that in GSCs derived from U251 cells under the TGF-β treatment, which is consistent with previous findings that the ATP content of cancer stem cells is 20–50% higher than that of tumor cells.38 The undifferentiated U251 cells exhibit only green fluorescence from mitochondria within 16 h (Fig. 3d and e). With the prolonged culturing of U251 cells under TGF-β treatment, the emergence of red fluorescence from AMPs is observed due to the increased ATP levels (Fig. 3f and g). Quantitative analysis indicates a gradual increase in the AMP fluorescence intensity as a function of time (Fig. 3h).
Construction of a microfluidic 3D cancer invasion model
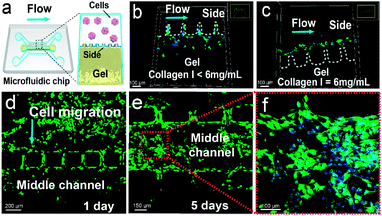
To investigate the metabolic process of GSCs in a physiologically relevant environment, we construct a microfluidic 3D tumor invasion model using a mixture of Matrigel and collagen I to form the ECM (Fig. 4a). The microfluidic device contains three parallel channels, and the straight part of each channel is 5 mm long (Fig. S3†). One side channel (1 mm wide and 170 μm high) is used for culturing U251 cells. The middle channel (0.6 mm wide and 170 μm high) is designed for loading the mixture of Matrigel and collagen I, which is isolated from the two side channels by small micropillars with intervals of 100 μm. The other side channel is used for introducing stimulation factors such as TGF-β and acidity. To maintain suitable cell-culture conditions, the medium is injected into each side channel at 20 μL h−1. This relatively low flow rate induces a shear stress of less than 0.002 Pa on the cells based on the Hagen–Poiseuille equation, which is much lower than the critical value of 0.012–0.015 Pa for inducing differentiation of mesenchymal stem cells.39 We also optimize the concentration of collagen I mixed with Matrigel, and find that 6 mg mL−1 of collagen I (the ratio of Matrigel to collagen I of 2) can maintain the intactness of the gel at a flow rate of 20 μL h−1 (Fig. 4b and c). Moreover, U251 cells can proliferate and invade into the gel under the aforementioned conditions (Fig. 4d–f). Therefore, this 3D microfluidic tumor model is suitable for studying the differentiation and migration of GSCs.TGF-β-induced EMT of GSCs in the 3D microfluidic model
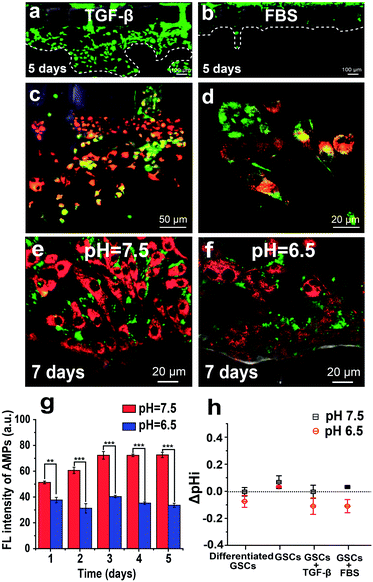
The TGF-β-induced EMT can endow GSCs with increased invasive potential. To monitor the energy metabolism of this process, we used the AMP-assisted 3D microfluidic tumor model, in which GSCs derived from U251 cells are cultured in one side channel, and TGF-β stimulation is induced from the other side channel. As shown in Fig. 5a and b, TGF-β treatment (10 ng mL−1) promotes invasive migration of GSCs into the gel, as compared to almost no migration of GSCs treated with the FBS medium for 5 days. The cytosolic ATP level of invaded GSCs in the gel is higher than that of non-invaded cells in the side channel, as indicated by the increased red fluorescence from the AMP in the invaded GSCs (Fig. 5c). Most invaded cells in the gel exhibit elongated or spindle mesenchymal morphologies instead of rounded amoeboid morphologies, revealing that TGF-β stimulation indeed induces the EMT of GSCs (Fig. 5d). These mesenchymal differentiated GSCs produce more ATP to support their increased motility through the gel mimicking the ECM.Invasive potential of GSCs in an acidic microenvironment
It is generally accepted that the neutral extracellular environment exhibits a neutral pH around 7.5, as compared to a low pH around 6.5 for the acidic extracellular environment.40 Low extracellular pH is a significant characteristic of solid tumors, closely associated with increased fermentative metabolism of tumor cells. To investigate the invasive potential of GSCs in an acidic microenvironment, we simulate a pH gradient from 6.5 to 7.5 between GSCs and the surrounding environment by injecting 2% FBS medium of pH 6.5 into the side channel with cells and pH 7.5 into the other side channel. To mitigate the effect of the extracellular environment on bPEI–AMP complexes, we first deliver the bPEI–AMP complex into cells at pH 7.5, and then change the pH of the cell culture medium to 6.5 inside the microfluidic platform. After a 7 day culture in the microfluidic device, GSCs under acidic stress (2% FBS at pH 6.5) show a lower intensity of red fluorescence from AMPs than those at pH 7.5, indicating the low-level ATP production by GSCs under acidic stress (Fig. 5e and f). Moreover, the fluorescence intensity of AMPs at pH 7.5 is always higher than that at pH 6.5 over a time period of 5 days (Fig. 5g). To force the differentiation of GSCs at low pH, we increase the concentration of FBS to 10%. After a 5 day culture in the microfluidic device, GSCs at both pH 7.5 and 6.5 display expanded differentiated shapes (Fig. S4a and b†). Once we replace the culture medium of 10% FBS at pH 6.5 with 10% FBS with TGF-β (10 ng mL−1) at pH 7.5, GSCs exhibit high malignant potential as indicated by fast growth and invasion into the gel within 2 days (Fig. S4c†). In contrast, CSCs do not invade the gel after restoring pH to 7.5 without addition of TGF-β (Fig. S4d†). Previous studies show that malignant cells can create an acidic extracellular environment and promote local invasion. In our study, the acidic microenvironment also screens out more malignant glioma cells.41,42 Furthermore, we quantify the change of pHi (ΔpHi) of GSCs using the pH sensitive fluorescent dye SNARF-1-AM, as pHi is important for regulating cell proliferation and apoptosis. As depicted in Fig. 5h, the similar values of ΔpHi of GSCs at pH 6.5 and 7.5 indicate that GSCs can adapt to the acidic environment.Conclusions
In conclusion, we integrate an ATP-responsive mitochondrial probe (AMP) with a 3D microfluidic tumor model to monitor metabolic processes of GSCs in more physiologically relevant environments. This microfluidic platform can directly observe the differentiation and migration of GSCs, and simultaneously detect intracellular ATP at the single cell level under different stimulations. The TGF-β-induced EMT can endow GSCs with increased ATP levels and enhanced invasive potential. The acidic extracellular environment results in a low-energy state of GSCs with low cytosolic ATP, while screening out more malignant glioma cells within the microfluidic device. Overall, this 3D microfluidic tumor model integrated with stimuli-responsive mitochondrial probes has been proven to be a versatile platform for studying the biology of CSCs.Conflicts of interest
There are no conflicts to declare.Acknowledgements
This work was supported financially by the National Natural Science Foundation of China (21804026, 21727814, and 91959101), and Youth Innovation Promotion Association CAS (2016035).Notes and references
- P. Dalerba and M. F. Clarke, Cell Stem Cell, 2007, 1, 241–242 CrossRef CAS PubMed.
- T. Brabletz, Cancer Cell, 2012, 22, 699–701 CrossRef CAS PubMed.
- L. Cheng, S. Bao and J. N. Rich, Biochem. Pharmacol., 2010, 80, 654–665 CrossRef CAS PubMed.
- R. A. Weinberg and C. L. Chaffer, Science, 2011, 331, 1559–1564 CrossRef PubMed.
- Q. Huang, S. Mao, M. Khan, W. Li, Q. Zhang and J.-M. Lin, Chem. Sci., 2020, 11, 253–256 RSC.
- S. Mao, Q. Zhang, H. Li, W. Zhang, Q. Huang, M. Khan and J.-M. Lin, Chem. Sci., 2018, 9, 7694–7699 RSC.
- A. Singh and J. Settleman, Oncogene, 2010, 29, 4741–4751 CrossRef CAS PubMed.
- K. Polyak and R. A. Weinberg, Nat. Rev. Cancer, 2009, 9, 265–273 CrossRef CAS PubMed.
- J. Anido, A. Sáez-Borderías, A. Gonzàlez-Juncà, L. Rodón, G. Folch, M. A. Carmona, R. M. Prieto-Sánchez, I. Barba, E. Martínez-Sáez, L. Prudkin, I. Cuartas, C. Raventós, F. Martínez-Ricarte, M. A. Poca, D. García-Dorado, M. M. Lahn, J. M. Yingling, J. Rodón, J. Sahuquillo, J. Baselga and J. Seoane, Cancer Cell, 2010, 18, 655–668 CrossRef CAS PubMed.
- S. Guelfi, H. Duffau, L. Bauchet, B. Rothhut and J.-P. Hugnot, Stem Cells Int., 2016, 33, 2759403 Search PubMed.
- L. Jiang, L. Xiao, H. Sugiura, X. Huang, A. Ali, M. Kuro-o, R. J. Deberardinis and D. A. Boothman, Oncogene, 2015, 34, 3908–3916 CrossRef CAS PubMed.
- E. Vlashi, K. Kim, C. Lagadec, L. D. Donna, J. T. McDonald, M. Eghbali, J. W. Sayre, E. Stefani, W. McBride and F. Pajonk, J. Natl. Cancer Inst., 2009, 101, 350–359 CrossRef CAS PubMed.
- P. E. Porporato, N. Filigheddu, J. M. B. Pedro, G. Kroemer and L. Galluzzi, Cell Res., 2018, 28, 265–280 CrossRef CAS PubMed.
- L. Lin, Y. Zhang, Z. Wu, W. Zhang and J.-M. Lin, Chem. Commun., 2019, 55, 10218–10221 RSC.
- P. Sancho, D. Barneda and C. Heeschen, Br. J. Cancer, 2016, 114, 1305–1312 CrossRef CAS PubMed.
- J. Ma, S. Yan, C. Miao, L. Li, W. Shi, X. Liu, Y. Luo, T. Liu, B. Lin, W. Wu and Y. Lu, Adv. Healthcare Mater., 2019, 8, 1801084 CrossRef PubMed.
- M. R. Carvalho, D. Lima, R. L. Reis, V. M. Correlo and J. M. Oliveira, Trends Biotechnol., 2015, 33, 667–678 CrossRef CAS PubMed.
- R. Bai, L. Li, M. Liu, S. Yan, C. Miao, R. Li, Y. Luo, T. Liu, B. Lin, Y. Ji and Y. Lu, Anal. Chem., 2018, 90, 5825–5932 CrossRef CAS PubMed.
- M. B. Byrne, M. T. Leslie, H. R. Gaskins and P. J. A. Kenis, Trends Biotechnol., 2014, 32, 556–563 CrossRef CAS PubMed.
- D. Truong, R. Fiorelli, E. S. Barrientos, E. L. Melendez, N. Sanai, S. Mehta and M. Nikkhah, Biomaterials, 2019, 198, 63–77 CrossRef CAS PubMed.
- H. Yi, Y. H. Jeong, Y. Kim, Y. Choi, H. E. Moon, S. H. Park, K. S. Kang, M. Bae, J. Jang, H. Youn, S. H. Paek and D. Cho, Nat. Biomed. Eng., 2019, 3, 509–519 CrossRef CAS PubMed.
- L. Lin, X. Lin, L. Lin, Q. Feng, T. Kitamori, J. M. Lin and J. Sun, Anal. Chem., 2017, 89, 10037–10044 CrossRef CAS PubMed.
- C. Lin, L. Lin, S. Mao, L. Yang, L. Yi, X. Lin, J. Wang, Z. Lin and J. M. Lin, Anal. Chem., 2018, 90, 10326–10333 CrossRef CAS PubMed.
- L. Lin, Q. Chen and J. Sun, TrAC, Trends Anal. Chem., 2018, 99, 66–74 CrossRef CAS.
- S. Feng, S. Mao, J. Dou, W. Li, H. Li and J.-M. Lin, Chem. Sci., 2019, 10, 8571–8576 RSC.
- Z. Wu, Y. Zheng, L. Lin, S. Mao, Z. Li and J.-M. Lin, Angew. Chem., Int. Ed., 2020, 59, 2225–2229 CrossRef CAS PubMed.
- M.-H. Park, E. Reategui, W. Li, S. N. Tessier, K. H. Wong, A. E. Jensen, V. T. Thapar, D. Ting, M. Toner, S. L. Stott and P. T. Hammond, J. Am. Chem. Soc., 2017, 139, 2741–2749 CrossRef CAS PubMed.
- M. Wang, Z. Mao, T.-S. Kang, C.-Y. Wong, J.-L. Mergny, C.-H. Leung and D.-L. Ma, Chem. Sci., 2016, 7, 2516–2523 RSC.
- K. Vellaisamy, G. Li, W. Wang, C.-H. Leung and D.-L. Ma, Chem. Sci., 2018, 9, 8171–8177 RSC.
- D.-L. Ma, S. Lin, W. Wang, C. Yang and C.-H. Leung, Chem. Sci., 2017, 2, 878–889 RSC.
- K. Vellaisamy, G. Li, C.-N. Ko, H.-J. Zhong, S. Fatima, H.-Y. Kwan, C.-Y. Wong, W.-J. Kwong, W. Tan, C.-H. Leung and D.-L. Ma, Chem. Sci., 2018, 9, 1119–1125 RSC.
- Z. Di, J. Zhao, H. Chu, W. Xue, Y. Zhao and L. Li, Adv. Mater., 2019, 31, 1901885 CrossRef PubMed.
- N. Li, W. Zhang, M. Khan, L. Lin and J. M. Lin, Biosens. Bioelectron., 2018, 99, 142–149 CrossRef CAS PubMed.
- L. Dang, D. W. White, S. Gross, B. D. Bennett, M. A. Bittinger, E. M. Driggers, V. R. Fantin, H. G. Jang, S. Jin, M. C. Keenan, K. M. Marks, R. M. Prins, P. S. Ward, K. E. Yen, L. M. Liau, J. D. Rabinowitz, L. C. Cantley, C. B. Thompson, M. G. V. Heiden and S. M. Su, Nature, 2009, 462, 739–744 CrossRef CAS PubMed.
- N. Li, W. Zhang, L. Lin, S. N. A. Shah, Y. Li and J.-M. Lin, Anal. Chem., 2019, 91, 2600–2604 CrossRef CAS PubMed.
- H. Imamura, K. P. H. Nhat, H. Togawa, K. Saito, R. Iino, Y. Kato-Yamada, T. Nagai and H. Noji, Proc. Natl. Acad. Sci. U. S. A., 2009, 106, 15651–15656 CrossRef CAS PubMed.
- P. E. Porporato, N. Filigheddu, J. M. B. Pedro, G. Kroemer and L. Galluzzi, Cell Res., 2018, 28, 265–280 CrossRef CAS PubMed.
- E. Vlashi, C. Lagadec, L. Vergnes, K. Reue, P. Frohne, M. Chan, Y. Alhiyari, M. B. Dratver and F. Pajonk, Breast Cancer Res. Treat., 2014, 146, 3614–3631 CrossRef PubMed.
- K. M. Kim, Y. J. Choi, J. H. Hwang, A. R. Kim, J. C. Hang, E. S. Hwang, J. Y. Park, S. H. Lee and J. H. Hong, PLoS One, 2014, 9, e92427 CrossRef PubMed.
- A. B. Hjelmeland, Q. Wu, J. M. Heddleston, G. S. Choudhary, J. MacSwords, J. D. Lathia, R. McLendon, D. Lindner, A. Sloan and J. N. Rich, Cell Death Differ., 2011, 47, 3614–3631 Search PubMed.
- Y.-X. Zhang, Y.-Y. Zhao, J. Shen, X. Sun, Y. Liu, H. Liu, Y. Wang and J. Wang, Nano Lett., 2019, 19, 2774–2783 CrossRef CAS PubMed.
- N. Rohani, L. Hao, M. S. Alexis, B. A. Joughin, K. Krismer, M. N. Moufarrej, A. R. Soltis, D. A. Lauffenburger, M. B. Yaffe, C. B. Burge, S. N. Bhatia and F. B. Gertler, Cancer Res., 2019, 79, 2774–2783 CrossRef PubMed.
Footnote |
| † Electronic supplementary information (ESI) available: Experimental sections and supplementary figures and table. See DOI: 10.1039/c9sc06185a |
| This journal is © The Royal Society of Chemistry 2020 |

