 Open Access Article
Simultaneous and ultrasensitive detection of multiple microRNAs by single-molecule fluorescence imaging†
Hongding
Zhang‡
ab,
Xuedong
Huang‡
a,
Jianwei
Liu
*a and
Baohong
Liu
 *a
*a
aDepartment of Chemistry, Shanghai Stomatological Hospital, State Key Laboratory of Molecular Engineering of Polymers, Institute of Biomedical Sciences, Fudan University, Shanghai 200438, P. R. China. E-mail: bhliu@fudan.edu.cn
bCollege of Chemistry and Chemical Engineering, Xinyang Normal University, Xinyang 464000, P. R. China
First published on 24th March 2020
Abstract
Cell status changes are typically accompanied by the simultaneous changes of multiple microRNA (miRNA) levels. Thus, simultaneous and ultrasensitive detection of multiple miRNA biomarkers shows great promise in early cancer diagnosis. Herein, a facile single-molecule fluorescence imaging assay was proposed for the simultaneous and ultrasensitive detection of multiple miRNAs using only one capture anti-DNA/RNA antibody (S9.6 antibody). Two complementary DNAs (cDNAs) designed to hybridize with miRNA-21 and miRNA-122 were labelled with Cy3 (cDNA1) and Cy5 (cDNA2) dyes at their 5′-ends, respectively. After hybridization, both miRNA-21/cDNA1 and miRNA-122/cDNA2 complexes were captured by S9.6 antibodies pre-modified on a coverslip surface. Subsequently, the Cy3 and Cy5 dyes on the coverslip surface were imaged by the single-molecule fluorescence setup. The amount of miRNA-21 and miRNA-122 was quantified by counting the image spots from the Cy3 and Cy5 dye molecules in the green and red channels, respectively. The proposed assay displayed high specificity and sensitivity for singlet miRNA detection both with a detection limit of 5 fM and for multiple miRNA detection both with a detection limit of 20 fM. Moreover, it was also demonstrated that the assay could be used to detect multiple miRNAs simultaneously in human hepatocellular cancer cells (HepG2 cells). The proposed assay provides a novel biosensing platform for the ultrasensitive and simple detection of multiple miRNA expressions and shows great prospects for early cancer diagnosis.
Introduction
As a class of endogenous noncoding RNAs, microRNAs (miRNAs) play crucial regulatory functions in many biological processes including genetic expression,1 cell differentiation,2 proliferation,3 and apoptosis.4 Numerous studies have demonstrated that the dysregulation of miRNA expression levels is relevant to the occurrence and progression of human diseases, especially a variety of carcinomas.5,6 Thus, miRNAs are regarded as promising biomarker candidates for early cancer diagnosis.7,8 Recent studies have also found that the progression of one cancer is typically accompanied by the simultaneous changes of multiple miRNA levels.9 So, the simultaneous and sensitive detection of multiple miRNAs is important to both clinical diagnostics and fundamental research.However, because of their intrinsic characteristics, such as a short sequence length, low abundance (about 0.01% in total RNA) in tissues and cells, instability and high sequence homology,10 miRNA detection and analysis still remain a challenge, especially for the simultaneous and sensitive detection of multiple miRNAs. The northern blot,11,12 reverse transcriptase polymerase chain reaction (RT-PCR),13,14 and microarrays15,16 are all examples of early assays for miRNA detection, but they have the issues of complex procedures and high cost. Moreover, the low sensitivity of these methods also limits their wide application. Thus, many sensing assays have been explored for ultrasensitive microRNA analysis, including electrochemical assays,17,18 electrochemiluminescence assays,19–21 colorimetric assays,22–24 fluorescence assays25–28 and surface enhanced Raman spectroscopy (SERS) assays.29–31 Various signal amplification strategies are typically designed in these methods to improve their sensitivity. This undoubtedly increases the complexity of the analysis process. In addition, most of these methods lack the ability to detect multiple miRNA species simultaneously with high sensitivity. Therefore, developing a simple and sensitive assay for the simultaneous analysis of multiple miRNA species is highly desirable.
In the past few decades, the single-molecule optical imaging method has revolutionised molecular measurements by pushing the detection limit down to the fundamental limit of digital analyte counting.32 Advances in optics, detectors and fluorophores make the ultrasensitive and quantitative detection of biomolecules possible without the demand for enzymatic amplification. Compared with traditional ensemble methods, single-molecule measurements provide much more information due to their ability to measure distributions of single molecule behaviour, allowing them to explore the hidden heterogeneity of samples.33,34 These merits make it superior in detecting and quantifying rare and aberrant species that would be lost in the noise of ensemble detection. Moreover, using fluorescent dyes of different colours as signal labels enables the direct measurement of signals from multiple targets simultaneously. Given these advantages, the single-molecule fluorescence imaging method shows great promise for the sensitive and simultaneous detection of multiple targets.
In this work, a sensitive and direct single-molecule fluorescence imaging assay was proposed for the simultaneous detection of multiple miRNA species using the S9.6 antibody. It has been demonstrated that the S9.6 antibody can effectively bind with miRNA/DNA complexes.35 Moreover, several biosensing assays have been successfully designed for the rapid detection of miRNAs.36,37 However, few methods can simultaneously detect multiple miRNAs using the S9.6 antibody due to the limitation of the methods themselves. In our method, two cDNAs that complement miRNA-21 and miRNA-122 were labelled with Cy3 and Cy5 dye, respectively. After miRNA-21 and miRNA-122 were hybridized with their complementary cDNAs, the miRNA-21/cDNA1 complex and miRNA-122/cDNA2 complex were similarly captured by the S9.6 antibody that was pre-modified on a coverslip surface. By imaging the Cy3 dyes from cDNA1 and Cy5 dyes from cDNA2 on the coverslip surface, the amount of miRNA-21 and miRNA-122 was quantified through counting the fluorescent spots of Cy3 and Cy5 dye molecules that correspond to miRNA-21/cDNA1 complexes and miRNA-122/cDNA2 complexes, respectively. Compared with other methods, this method achieved simple and simultaneous detection of double miRNA species using only one capture probe (S9.6 antibody) that could be easily extended to detect multiple miRNA species by adding more fluorescent label colours. Moreover, the proposed assay showed high sensitivity for the detection of multiple miRNAs without the assistance of any signal amplified strategies.
Experimental section
Chemicals
Poly(L-lysine)-poly(ethyleneglycol)-biotin (PLL-PEG-Biotin) (PLL(20 kDa)-g[3.5]-PEG(3.4 kDa)-biotin) and poly(L-lysine)-poly(ethyleneglycol) (PLL(20 kDa)-g[3.5]-PEG(2.0 kDa)) were obtained from Susos AG Inc. (Switzerland). Goat anti-mouse IgG labelled with biotin (Biotin-IgG) was purchased Abcam Trading Co., Ltd (Shanghai, China). The mouse anti-DNA/RNA antibody (S9.6 antibody) was obtained from KeraFAST (Boston, MA, USA). Streptavidin (SA), DEPC water, and PBS buffer without RNase (20×, pH 7.4) were purchased from Sangon Biological Engineering Technology and Services Co., Ltd. (Shanghai, China). Potassium hydroxide (KOH) and ethanol were obtained from Sinopharm Chemical Reagent Co., Ltd (Shanghai, China). The HepG2 cell line was purchased from the Cell Bank of Chinese Academy of Sciences (Shanghai, China). All the reagents were of analytical grade and used without any further purification. The miRNAs were prepared in DEPC water. Other solutions were prepared in PBS (1×, pH 7.4). The single-strand cDNAs labelled with dyes and miRNAs were obtained from Sangon Biological Engineering Technology and Services Co., Ltd. (Shanghai, China). The DNA and miRNA were purified by HPLC and their purity was confirmed by mass spectrometry. Their sequences are listed in Table S1.†Coverslip treatment
Before being used in the experiments, the coverslips (Fisher, 25 mm × 25 mm) were pre-treated as follows: firstly, the coverslips were cleaned in 1 M of KOH solution by ultrasonication for 10 min three times to remove grease on the coverslip surface. After that, the coverslips were rinsed with ultrapure water three times. Then, the coverslips were ultrasonicated in ethanol followed by washing in ultrapure water for 10 min with three repetitions. Finally, the coverslips were dried using a N2 stream.Preparation of sample cells and modification of the coverslip surface
The sample cell was made by gluing one glass slide (25 mm × 40 mm, 6 mm thick) that has a hole in the middle onto a coverslip via vacuum grease. Firstly, the coverslip was passivated with a mixture of PLL-PEG and PLL-PEG-Biotin (10![[thin space (1/6-em)]](https://www.rsc.org/images/entities/char_2009.gif) :
:![[thin space (1/6-em)]](https://www.rsc.org/images/entities/char_2009.gif) 1) and biotinylated at the same time following previously reported methods.38–40 Then, 50 μL of 0.2 mg mL−1 SA was added to the sample cell and incubated for 15 min at room temperature. After being washed with PBS buffer (1×, pH 7.4), 50 μL of 0.1 μg mL−1 biotin-IgG solution was added to the sample cell and reacted with SA for 15 min at room temperature. Then, the sample cell was treated with 50 μL of 5 ng mL−1 S9.6 antibody and incubated at 37 °C for 1 h. Finally, the pre-modified sample cell was washed with PBS buffer and stored at 4 °C for the next step.
1) and biotinylated at the same time following previously reported methods.38–40 Then, 50 μL of 0.2 mg mL−1 SA was added to the sample cell and incubated for 15 min at room temperature. After being washed with PBS buffer (1×, pH 7.4), 50 μL of 0.1 μg mL−1 biotin-IgG solution was added to the sample cell and reacted with SA for 15 min at room temperature. Then, the sample cell was treated with 50 μL of 5 ng mL−1 S9.6 antibody and incubated at 37 °C for 1 h. Finally, the pre-modified sample cell was washed with PBS buffer and stored at 4 °C for the next step.
Detection of miRNAs
For the singlet miRNA detection, 25 μL of solutions with various miRNA-21 or miRNA-122 concentrations were added to 25 μL of solutions including 2 nM cDNA1 or 2 nM cDNA2, and the mixture was hybridized at 37 °C for 1 h. Then, 50 μL of the above mixture was added into the pre-modified sample cell. After incubation at 37 °C for 70 min, the sample cell was washed with PBS buffer several times. Finally, the sample cell was added with 50 μL of PBS buffer for single-molecule fluorescence imaging. For the multiple miRNA detection, a mixture containing various concentrations of miRNA-21 and miRNA-122 was added to another mixture including 2 nM cDNA1 and 2 nM cDNA2. After being incubated at 37 °C for 1 h, the mixture was added into the pre-modified sample cell and reacted at 37 °C for 70 min. Finally, the sample cell was imaged by the single-molecule fluorescence setup.Study of the selectivity of the assay
For the selectivity study, 1 nM single-base mismatched miRNA of miRNA-21 and miRNA-122, three-base mismatched miRNA of miRNA-21 and miRNA-122, and noncomplementary miRNA (including miRNA-143, miRNA-141, and miRNA-16) were added into the detection system respectively instead of miRNA-21 or miRNA-122. Finally, these samples were imaged by the single-molecule fluorescence setup, and the image spots were counted.Cell culture and miRNA extraction
The human hepatoma cell (HepG2) line was cultured in a DMEM medium (Gibco, USA) that was mixed with 1% penicillin streptomycin (Gibco, USA) and 10% fetal bovine serum (FBS, Gibco, USA) at 37 °C under a 5% CO2 atmosphere. The small RNAs (<200 nt) were extracted by utilizing an RNA extract kit (Sagon, Shanghai, China) according to its manufacturer's protocol. The extracted miRNA-21 and miRNA-122 were measured simultaneously by the proposed assay.Single-molecule data collection and analysis
All the single-molecule imaging experiments were performed on a previously described home-built single-molecule fluorescence imaging system.40 The Cy3 and Cy5 dyes were simultaneously excited with a 532 nm laser and 632 nm laser, respectively. The fluorescence from the Cy3 and Cy5 dyes was split by a dichroic filter and collected by the two halves (green channel and red channel) of an EMCCD. For the acquisition of single-molecule data, 10 regions were imaged for each sample, and every image contained 60 successive frames. All the measurements were carried out at room temperature and the exposure time was 100 ms. The MATLAB (MathWorks, MA, U.S) program was used to analyse the single-molecule data. For each frame, the interest region with a size of 40 × 20 μm for each channel was employed to count the image spots.Results and discussion
Principles of the multiple miRNA assay
The designed principles for the simultaneous detection of multiple miRNAs are displayed in Scheme 1. In this work, miRNA-21 and miRNA-122 were selected as the model miRNAs to demonstrate the capability of the proposed assay for the simultaneous detection of multiple miRNAs. The complementary cDNAs of miRNA-21 and miRNA-122 were labelled with Cy3 and Cy5 dye molecules at their 5′-ends, respectively. As shown in Scheme 1, the coverslip surface was first passivated with PLL-PEG to reduce the non-adsorption of signal probes and biotinylated by PLL-PEG-Biotin at the same time.38–40 Then, the secondary IgG antibody was immobilized on a coverslip surface via the high affinity of biotin and SA. Finally, the S9.6 antibody was assembled on the coverslip surface through binding between the secondary IgG antibody and S9.6 antibody. After the mixture of miRNA-21 and miRNA-122 hybridize with their corresponding complementary cDNAs, the formed miRNA-21/DNA1 complexes and miRNA-122/DNA2 complexes were simultaneously captured by the S9.6 antibodies through their specific affinity. Consequently, the Cy3 and Cy5 dyes labelled in cDNA1 and cDNA2 respectively were assembled on the coverslip surface. By imaging and counting Cy3 and Cy5 dye molecules on the coverslip surface, miRNA-21 and miRNA-122 could be measured parallelly.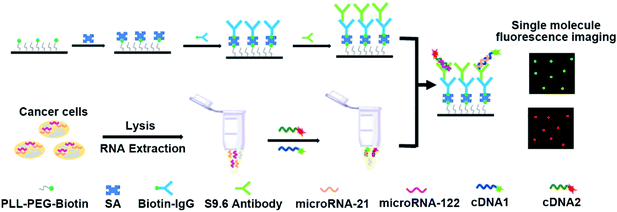 | ||
| Scheme 1 Schematic illustration of single-molecule fluorescence imaging assay for the simultaneous detection of multiple miRNAs. | ||
Validation of the proposed assay
The feasibility of the proposed assay to simultaneously detect miRNA-21 and miRNA-122 was verified as shown in Fig. 1. In the absence of either miRNA-21 or miRNA-122, no spots are observed at both the channels (green and red channels). This indicates that no miRNA/DNA complexes are formed and captured by the S9.6 antibody. From another point of view, it also suggests that the passivation of the coverslip surface works well to prevent the non-specific binding of unpaired cDNA probes to the coverslip. In the presence of miRNA-21, many fluorescent image spots at the green channel from Cy3 dyes are observed, but no image spots are observed at the red channel. This indicates that many miRNA-21/cDNA1 complexes are formed and captured by the S9.6 antibody, but no miRNA-122/cDNA2 complex is formed. Alternatively, in the presence of miRNA-122, numerous image spots are observed only at the red channel, showing that only the miRNA-122/cDNA2 complexes are formed and bound to the S9.6 antibody on the coverslip surface. When both miRNA-21 and miRNA-122 are present, image spots from both Cy3 and Cy5 dyes are simultaneously observed at the green and red channels, respectively. This indicates that both miRNA-21/cDNA1 complexes and miRNA-122/cDNA2 complexes are formed and captured by the S9.6 antibody on the coverslip surface. However, there are fewer overall image spots at the two channels in the presence of both miRNAs compared with the case of only one miRNA species being present. This is because the two types of miRNA/cDNA complexes compete with each other to combine with the S9.6 antibody. These results demonstrate that the single-molecule fluorescence counting assay can be used to simultaneously detect multiple miRNAs. In addition, the single-molecule fluorescence photobleaching experiments are further implemented to demonstrate that the spots observed in the image are single molecules. The results show that all Cy3 and Cy5 dye image spots displayed photobleaching and photo-blinking with one step, corresponding to single Cy3 and Cy5 dye molecules (Fig. S1†).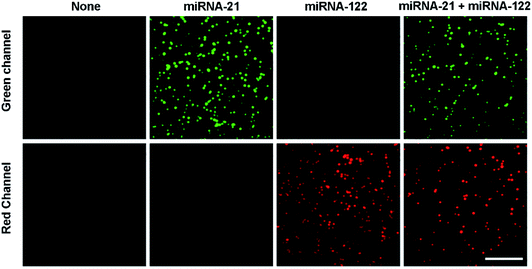 | ||
| Fig. 1 Simultaneous detection of multiple miRNAs by the single-molecule imaging assay. The concentration of both miRNA-21 and miRNA-122 is 500 pM. Scale bar represents 5 μm. | ||
Optimization of the experimental conditions
The distribution of S9.6 antibodies immobilized on the coverslip surface greatly influences the sensitivity of the proposed assay. A high density of S9.6 antibodies on the coverslip surface is beneficial for capturing more miRNA/DNA complexes and thus improves the sensitivity of miRNA detection. However, an S9.6 antibody distribution that is too dense on the coverslip surface could lead to excessive capturing of miRNA/DNA complexes. This will bring about an overlap of the image spots and hamper the distinction of individual fluorescent spots. The optimization results of S9.6 antibody concentrations are shown in Fig. S2.† When the concentration is above 10 ng mL−1, the image spots from the miRNA/DNA complexes are too dense to distinguish. Although individual molecules from an S9.6 antibody concentration of 10 ng mL−1 can be distinguished, some molecules are still connected together. Moreover, the image spots from concentrations below 5 ng mL−1 are fewer than those from the concentration of 5 ng mL−1. Thus, 5 ng mL−1 is selected as the optimized S9.6 antibody concentration. The binding time of the S9.6 antibody and IgG is also optimized. The results show that 60 min is the optimized binding time (Fig. S3†).On the other hand, the sensitivity of miRNA detection depends on the S9.6 antibody capturing efficiency towards miRNA/DNA complexes. Thus, the capturing time of the S9.6 antibody for the miRNA-21/cDNA1 complexes and miRNA-122/cDNA2 complexes is investigated in order to achieve high sensitivity. As shown in Fig. 2A, the number of image spots from captured miRNA-21/cDNA1 complexes increases greatly with the binding time extending to 60 min. After 60 min, the number of image spots levels off, showing that the capturing of miRNA/DNA complexes reaches saturation. At this moment, the highest capturing efficiency is obtained. For the miRNA-122/cDNA2 complexes, the optimal binding time with the S9.6 antibody is 70 min. Therefore, in order to obtain the highest capture efficiency for both complexes, a capturing time of 70 min is applied to all experiments.
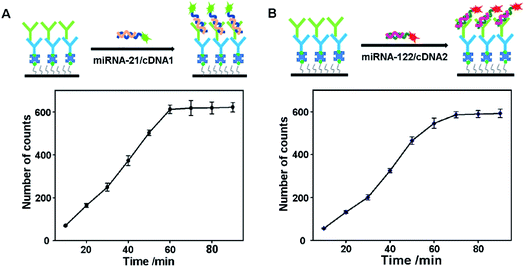 | ||
| Fig. 2 Influence of the binding time of the DNA/RNA complex and S9.6 antibody. (A) miRNA-21; (B) miRNA-122. Error bars represent the standard deviation of three experiments. | ||
Characterization of the single-molecule detection of miRNA-21 and miRNA-122
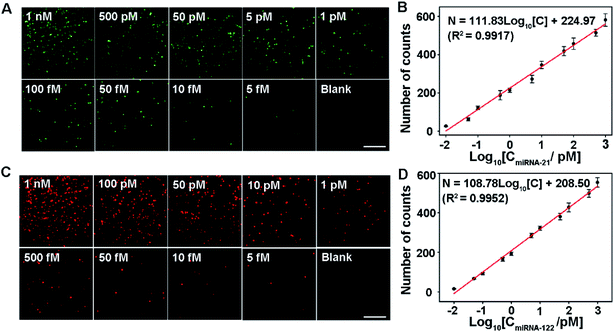
The analytical performance of the proposed assay is first demonstrated by measuring singlet miRNA. Under optimized conditions, two sets of miRNA-21 and miRNA-122 samples with various concentrations are measured, respectively. In order to reduce the sample error, ten regions are imaged for each sample. The average count number from the 10 regions is used to quantify the number of miRNAs. As shown in Fig. 3A, the number of image spots from Cy3 increases with the increase of miRNA-21 concentration. It shows a good linear relationship with the logarithm of the miRNA-21 concentration in the range from 10 fM to 1 nM. The linear regression equation is N = 111.83![[thin space (1/6-em)]](https://www.rsc.org/images/entities/char_2009.gif) log10[C] + 224.97 (R2 = 0.9917) (Fig. 3B), and the detection limit is 5 fM (shown in the lower right panel of Fig. 3A). For the singlet miRNA-122 detection, as shown in Fig. 3C and D, the number of counts from Cy5 shows a similar linear relationship with the logarithm of the miRNA-122 concentration. It follows the correlation equation of N = 108.78
log10[C] + 224.97 (R2 = 0.9917) (Fig. 3B), and the detection limit is 5 fM (shown in the lower right panel of Fig. 3A). For the singlet miRNA-122 detection, as shown in Fig. 3C and D, the number of counts from Cy5 shows a similar linear relationship with the logarithm of the miRNA-122 concentration. It follows the correlation equation of N = 108.78![[thin space (1/6-em)]](https://www.rsc.org/images/entities/char_2009.gif) log10[C] + 208.50 (R2 = 0.9952) (Fig. 3D) in the same range from 10 fM to 1 nM. The detection limit for miRNA-122 is 5 fM (shown in the lower right panel of Fig. 3C). These results indicate that the proposed assay can be used for the sensitive and simple detection of singlet miRNA without the need for signal amplification. Interestingly, we found that the linear slope value (111.83) for the miRNA-21 assay is slightly bigger than the value (108.78) for the miRNA-122 analysis, indicating that the S9.6 antibody has a slightly stronger affinity with the miRNA-21/cDNA1 complex than with the miRNA-122/cDNA2 complex.
log10[C] + 208.50 (R2 = 0.9952) (Fig. 3D) in the same range from 10 fM to 1 nM. The detection limit for miRNA-122 is 5 fM (shown in the lower right panel of Fig. 3C). These results indicate that the proposed assay can be used for the sensitive and simple detection of singlet miRNA without the need for signal amplification. Interestingly, we found that the linear slope value (111.83) for the miRNA-21 assay is slightly bigger than the value (108.78) for the miRNA-122 analysis, indicating that the S9.6 antibody has a slightly stronger affinity with the miRNA-21/cDNA1 complex than with the miRNA-122/cDNA2 complex.
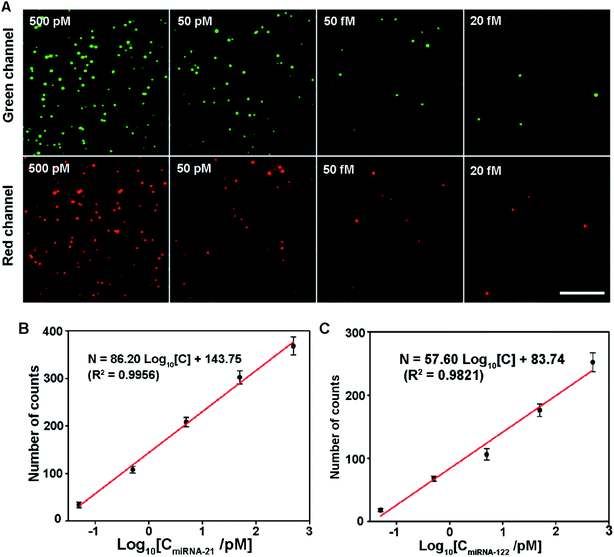
To further demonstrate the capability of the proposed assay for simultaneous detection of multiple miRNAs, the sensitivity was measured by simultaneously adding different concentrations of miRNA-21 and miRNA-122. The results are shown in Fig. 4. As both miRNA concentrations increase, the number of image spots from both Cy3 and Cy5 dyes rise gradually (Fig. 4A). In the concentration range from 500 pM to 50 fM, the number of counts from Cy3 and Cy5 dyes shows a linear logarithm relationship with the miRNA-21 and miRNA-122 concentrations, respectively (Fig. 4B and C). The linear regression equations are N = 86.20![[thin space (1/6-em)]](https://www.rsc.org/images/entities/char_2009.gif) log10[C] + 143.75 (R2 = 0.9956) and N = 57.60
log10[C] + 143.75 (R2 = 0.9956) and N = 57.60![[thin space (1/6-em)]](https://www.rsc.org/images/entities/char_2009.gif) log10[C] + 83.74 (R2 = 0.9821) for miRNA-21 and miRNA-122, respectively. The detection limit for both miRNAs is 20 fM. These results show that the proposed assay has excellent capability in the simultaneous detection of multiple miRNAs. At the same time, we found that different levels of one miRNA have effects on the other miRNA detection due to the competition between miRNA-21 and miRNA-122 at high concentrations (shown in Fig. S4†).
log10[C] + 83.74 (R2 = 0.9821) for miRNA-21 and miRNA-122, respectively. The detection limit for both miRNAs is 20 fM. These results show that the proposed assay has excellent capability in the simultaneous detection of multiple miRNAs. At the same time, we found that different levels of one miRNA have effects on the other miRNA detection due to the competition between miRNA-21 and miRNA-122 at high concentrations (shown in Fig. S4†).
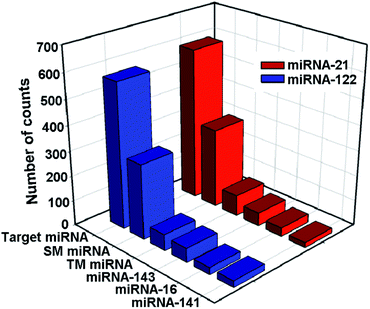
To evaluate the selectivity of the proposed method for the detection of miRNA-21 and miRNA-122, single-base mismatched miRNAs (SM miRNA1 for miRNA-21 and SM miRNA2 for miRNA-122), three-base mismatched miRNAs (TM miRNA1 for miRNA-21 and TM miRNA2 for miRNA-122), and noncomplementary miRNAs (including miRNA-143, miRNA-141, and miRNA-16) are chosen as negative controls. As shown in Fig. 5, the number of Cy3 image spots in the presence of miRNA-21 is 1.9, 7.2 and 11.4–30.2 times higher than that of the single-base mismatched miRNA (SM miRNA1), three-base mismatched miRNA (TM miRNA1), and noncomplementary miRNA (including miRNA-143, miRNA-141, and miRNA-16), respectively. Similarly, the number of Cy5 image spots in the presence of miRNA-122 is 1.9, 9.0 and 12.5–36.0 times higher than that of the single-base mismatched miRNA (SM miRNA2), three-base mismatched miRNA (TM miRNA2) and noncomplementary miRNA (including miRNA-143, miRNA-141, and miRNA-16), respectively. These results are comparable with or even better than those of previous reports23,41 and demonstrate that the proposed assay can selectively detect the target miRNAs and discriminate even a single-base difference.
Cell sample analysis
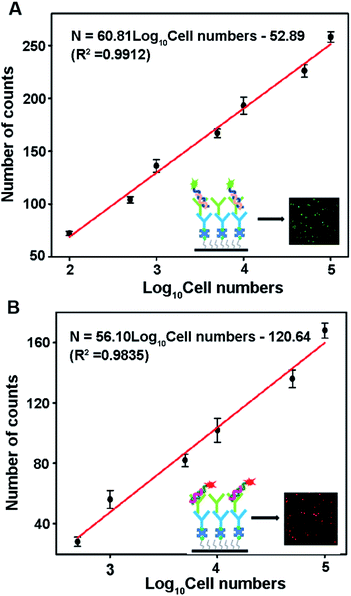
Both miRNA-21 and miRNA-122 are expressed in human hepatocellular (HepG2) cancer cells.42,43 To evaluate the detection capability of this method in complex samples, the proposed assay is used to simultaneously detect miRNA-21 and miRNA-122 concentrations in HepG2 cell samples. As shown in Fig. 6, both Cy3 and Cy5 counts corresponding to miRNA-21 and miRNA-122 respectively show good linear relationships with the logarithm of the cell number. The miRNA-21 count is fitted by a linear equation N = 60.81![[thin space (1/6-em)]](https://www.rsc.org/images/entities/char_2009.gif) log10[cell number] − 52.89 (R2 = 0.9912) in the range of 100–100
log10[cell number] − 52.89 (R2 = 0.9912) in the range of 100–100![[thin space (1/6-em)]](https://www.rsc.org/images/entities/char_2009.gif) 000 cells (shown in Fig. 6A). The miRNA-122 count is fitted by the equation N = 56.10
000 cells (shown in Fig. 6A). The miRNA-122 count is fitted by the equation N = 56.10![[thin space (1/6-em)]](https://www.rsc.org/images/entities/char_2009.gif) log10[cell number] − 120.64 (R2 = 0.9835) in the range of 500–100
log10[cell number] − 120.64 (R2 = 0.9835) in the range of 500–100![[thin space (1/6-em)]](https://www.rsc.org/images/entities/char_2009.gif) 000 cells (shown in Fig. 6B). The detection limits of miRNA-21 and miRNA-122 are 25 and 100 cells, respectively. The larger linear slope of the fitting equation and lower detection limit of miRNA-21 suggest that the miRNA-21 concentration in the HepG2 cell is higher than that of miRNA-122, which is consistent with previous reports.41 These results demonstrate that the proposed method can be applied to accurately detect multiple miRNAs in cancer cells.
000 cells (shown in Fig. 6B). The detection limits of miRNA-21 and miRNA-122 are 25 and 100 cells, respectively. The larger linear slope of the fitting equation and lower detection limit of miRNA-21 suggest that the miRNA-21 concentration in the HepG2 cell is higher than that of miRNA-122, which is consistent with previous reports.41 These results demonstrate that the proposed method can be applied to accurately detect multiple miRNAs in cancer cells.
Conclusions
In summary, an ultrasensitive and simple single-molecule fluorescence imaging assay was proposed to simultaneously detect multiple miRNAs with the S9.6 antibody specifically capturing miRNA/DNA complexes. The proposed assay has several advantages for miRNA detection: (1) the detection of multiple miRNAs can be simply achieved by designing various cDNAs with dye molecules of different colours, and using only one capturing antibody that simplifies the experiment and reduces the cost. (2) The ultrasensitive detection of miRNAs can be realized without the requirement of any signal amplification strategies, reducing the complexity of the analysis process. (3) The versatile assay can be extended to detect other miRNAs by designing their complement cDNAs and labelling different dye molecules. Moreover, the proposed assay is also demonstrated to be able to detect miRNAs in cancer cells. Therefore, the proposed assay provides a novel platform for the ultrasensitive detection of multiple miRNAs and shows great promise in early cancer diagnosis.Conflicts of interest
There are no conflicts of interest to declare.Acknowledgements
This work was supported by NSFC 21775028, 21375028, 21874028, STCSM (16391903900 and 17JC1401900), and the Collaborative Innovation Center of Chemistry for Energy Materials.Notes and references
- I. Alevizos and G. Illei, Nat. Rev. Rheumatol., 2010, 6, 391–398 CrossRef CAS PubMed.
- Z. Wang, W. Du, G. Piazza and Y. Xi, Acta Pharmacol. Sin., 2013, 34, 1374–1380 CrossRef CAS PubMed.
- B. Tian and J. Manley, Nat. Rev. Mol. Cell Biol., 2017, 18, 18–30 CrossRef CAS PubMed.
- J. Skommer, I. Rana, F. Marques, W. Zhu, Z. Du and F. Carchar, Cell Death Dis., 2014, 5, e1325–e1339 CrossRef CAS PubMed.
- A. Dhawan, J. Scott, A. Harris and F. Buffa, Nat. Commun., 2018, 9, 1–13 CrossRef PubMed.
- E. Lee, A. Collazo-Lorduy, M. Castillo-Martin, Y. Gong, L. Wang, W. Oh, M. Galsky, C. Cordon-Cardo and J. Zhu, Oncogene, 2018, 37, 5858–5872 CrossRef CAS PubMed.
- R. Hamam, D. Hamam, K. Alsaleh, M. Kassem, W. Zaher, M. Alfayez, A. Aldahmash and N. Alajez, Cell Death Dis., 2017, 8, e3045–e3057 CrossRef PubMed.
- A. Lujambio and S. Lowe, Nature, 2012, 482, 347–355 CrossRef CAS PubMed.
- J. Li, S. Liu, J. He, X. Liu, Y. Qu, W. Yan, J. Fan, R. Li, H. Xi, W. Fu, C. Zhang, J. Yang and J. Hou, Oncotarget, 2015, 6, 14993–15007 Search PubMed.
- J. Li, S. Tan, R. Kooger, C. Zhang and Y. Zhang, Chem. Soc. Rev., 2014, 43, 506–517 RSC.
- É. Várallyay, J. Burgyán and Z. Havelda, Nat. Protoc., 2008, 3, 190–196 CrossRef PubMed.
- S. Kim, Z. Li, P. Moore, A. Monaghan, Y. Chang, M. Nichols and B. John, Nucleic Acids Res., 2010, 38, e98–e105 CrossRef PubMed.
- J. Feng, K. Wang, X. Liu, S. Chen and J. Chen, Gene, 2009, 437, 14–21 CrossRef CAS PubMed.
- D. Pegtel, K. Cosmopoulos, D. Thorley-Lawson, M. van Eijndhoven, E. Hopmans, J. Lindenberg, T. Gruijl, T. Würdinger and J. Middeldorp, Proc. Natl. Acad. Sci. U. S. A., 2010, 107, 6328–6333 CrossRef CAS PubMed.
- J. Thomson, J. Parker, C. Perou and S. Hammond, Nat. Methods, 2004, 1, 47–53 CrossRef CAS PubMed.
- J. Yin, R. Zhao and K. Morris, Trends Biotechnol., 2008, 26, 70–76 CrossRef CAS PubMed.
- R. Tavallaie, J. McCarroll, M. Grand, N. Ariotti, W. Schuhmnn, E. Bakker, R. Tilley, D. Hibbert, M. Kavallaris and J. Gooding, Nat. Nanotechnol., 2018, 13, 1066–1071 CrossRef CAS PubMed.
- P. Gai, C. Gu, T. Hou and F. Li, ACS Appl. Mater. Interfaces, 2018, 10, 9325–9331 CrossRef CAS PubMed.
- W. Liu, A. Chen, S. Li, K. Peng, Y. Chai and R. Yuan, Anal. Chem., 2019, 91, 1516–1523 CrossRef CAS PubMed.
- J. Lu, L. Wu, Y. Hu, S. Wang and Z. Guo, Biosens. Bioelectron., 2018, 109, 13–19 CrossRef CAS PubMed.
- J. Liu, Y. Zhuo, Y. Chai and R. Yuan, Chem. Commun., 2019, 55, 9959–9962 RSC.
- R. Li, B. Yin and B. Ye, Biosens. Bioelectron., 2016, 86, 1011–1016 CrossRef CAS PubMed.
- C. Feng, X. Mao, H. Shi, B. Bo, X. Chen, T. Chen, X. Zhu and G. Li, Anal. Chem., 2017, 89, 6631–6636 CrossRef CAS PubMed.
- J. Dong, G. Chen, W. Wang, X. Huang, H. Peng, Q. Pu, F. Du, X. Cui, Y. Deng and Z. Tang, Anal. Chem., 2018, 90, 7107–7111 CrossRef CAS PubMed.
- J. Hu, M. Liu and C. Zhang, Chem. Sci., 2018, 9, 4258–4267 RSC.
- J. Conde, N. Oliva, M. Atilano, H. Song and N. Artzi, Nat. Mater., 2016, 15, 353–363 CrossRef CAS PubMed.
- Z. Jin, D. Geiβler, X. Qiu, K. Wegner and N. Hildebrandt, Angew. Chem., Int. Ed., 2015, 54, 10024–10029 CrossRef CAS PubMed.
- C. Liang, P. Ma, H. Liu, X. Guo, B. Yin and B. Ye, Angew. Chem., Int. Ed., 2017, 56, 9077–9081 CrossRef CAS PubMed.
- W. Ma, P. Fu, M. Sun, L. Xu, H. Kuang and C. Xu, J. Am. Chem. Soc., 2017, 139, 11752–11759 CrossRef CAS PubMed.
- J. Liu, Y. Wen, H. He, H. Chen and Z. Liu, Chem. Sci., 2018, 9, 7241–7246 RSC.
- Y. Pang, C. Wang, L. Lu, C. Wang, Z. Sun and R. Xiao, Biosens. Bioelectron., 2019, 130, 204–213 CrossRef CAS PubMed.
- L. Smith, M. Kohli and A. Smith, J. Am. Chem. Soc., 2018, 140, 13904–13912 CrossRef CAS PubMed.
- J. Gooding and K. Gaus, Angew. Chem., Int. Ed., 2016, 55, 11354–11366 CrossRef CAS PubMed.
- W. Moerner, Y. Shechtman and Q. Wang, Faraday Discuss., 2015, 184, 9–36 RSC.
- S. Boguslawski, D. Smith, M. Michalak, K. Mickelson, C. Yehle, W. Patterson and R. Carrico, J. Immunol. Methods, 1986, 89, 123–130 CrossRef CAS PubMed.
- A. Qavi, J. Kindt, M. Gleeson and R. Bailey, Anal. Chem., 2011, 83, 5949–5956 CrossRef CAS PubMed.
- H. Tran, B. Piro, S. Reisberg, H. Duc and M. Pham, Anal. Chem., 2013, 85, 8469–8474 CrossRef CAS PubMed.
- A. Gunnarsson, P. Jönsson, R. Marie, J. Tegenfeldt and F. HööK, Nano Lett., 2008, 8, 183–188 CrossRef CAS PubMed.
- M. Zhao, P. Nicovich, M. Janco, Q. Deng, Z. Yang, Y. Ma, T. Böcking, K. Gaus and J. Gooding, Langmuir, 2018, 34, 10012–10018 CrossRef CAS PubMed.
- H. Zhang, Y. Liu, K. Zhang, J. Ji, J. Liu and B. Liu, Anal. Chem., 2018, 90, 9315–9321 CrossRef CAS PubMed.
- G. Jie, Y. Zhao, X. Wang and C. Ding, Sens. Actuators, B, 2017, 252, 1026–1034 CrossRef CAS.
- L. Roberts, N. Engl. J. Med., 2008, 359, 420–422 CrossRef CAS PubMed.
- W. Zhou, Y. Tian, B. Yin and B. Ye, Anal. Chem., 2017, 89, 6120–6128 CrossRef CAS PubMed.
Footnotes |
| † Electronic supplementary information (ESI) available. See DOI: 10.1039/d0sc00580k |
| ‡ These authors have contributed equally to this work. |
| This journal is © The Royal Society of Chemistry 2020 |

