 Open Access Article
Using light intensity to control reaction kinetics and reversibility in photomechanical crystals†
Connor J.
Easley
a,
Fei
Tong
 a,
Xinning
Dong
 a,
Rabih O.
Al-Kaysi
 b and
Christopher J.
Bardeen
 *a
*a
aDepartment of Chemistry, University of California, Riverside, 501 Big Springs Road, Riverside, CA 92521, USA. E-mail: christopher.bardeen@ucr.edu
bCollege of Science and Health Professions-3124, King Saud bin Abdulaziz University for Health Sciences, King Abdullah International Medical Research Center (Nanomedicine), Ministry of National Guard Health Affairs, Riyadh 11426, Kingdom of Saudi Arabia
First published on 21st August 2020
Abstract
4-Fluoro-9-anthracenecarboxylic acid (4F-9AC) is a thermally reversible (T-type) photomechanical molecular crystal. The photomechanical response is driven by a [4 + 4] photodimerization reaction, while the photodimer dissociation determines the reset time. In this paper, both the chemical kinetics of dimer dissociation (using a microscopic fluorescence-recovery-after-photobleaching experiment) and mechanical reset dynamics (by imaging bending microneedles) for single 4F-9AC crystals are measured. The dissociation kinetics depend strongly on the initial concentration of photodimer, slowing down and becoming nonexponential at high dimer concentrations. This dose-dependent behavior is also observed in the mechanical response of bending microneedles. A new feature in the photomechanical behavior is identified: the ability of a very weak control beam to suppress dimer dissociation after large initial dimer conversions. This phenomenon provides a way to optically control the mechanical response of this photomechanical crystal. To gain physical insight into the origin of the nonexponential recovery curves, the experimental results are analyzed in terms of a standard first-order kinetic model and a nonlinear Finke–Watzky (FW) model. The FW model can qualitatively reproduce the transition from exponential to sigmoidal recovery with larger initial conversions, but neither model can reproduce the suppression of the recovery in the presence of a weak holding beam. These results highlight the need for more sophisticated theories to describe cooperative phenomena in solid-state crystalline reactions, as well as demonstrating how this behavior could lead to new properties and/or improved performance in photomechanical materials.
Introduction
The high degree of molecular organization in crystals can lead to novel electronic, optical and mechanical properties. One area of research has focused on the use of crystals composed of photochemically reactive molecules as materials that transform light into mechanical motion and work.1–16 Ideally, the photochemistry that underlies the light-to-work transformation should be reversible, so the material can be used multiple times. There are two classes of reversible materials.17,18 In photochemically reversible (P-type) systems, a second photon is required to initiate the reverse reaction. In thermally reversible (T-type) systems, the reverse reaction occurs spontaneously under ambient conditions without the need for a second light source. Both types of photochromic materials can potentially form the basis of a useful actuator, and it is desirable to gain a quantitative understanding of how both forward and reverse reactions proceed in crystal environments.The presence of a dense environment of reactive molecules in a crystal means that a chemical reaction does not proceed in isolation but instead affects its neighbors as molecular volumes and force-fields evolve. As McBride and Eckhardt originally pointed out,19–21 cooperative effects between molecules in the crystal lattice can drive changes in the crystal environment, which leads to changes in the reaction thermodynamics as the reaction proceeds. The “feedback effect”22 of the changing mechanical properties on the chemical kinetics, for example by encouraging nucleation, can lead to the breakdown of simple first-order kinetic models that describe chemical reactions in dilute solution and the gas phase. Some models of chemical kinetics in the solid-state that try to take this effect into account include the Johnson–Mehl–Avrami–Kolmogorov (JMAK) approach and related models,23–27 which rely on a geometric treatment of nucleation dynamics, and the Finke–Watzky (FW) model which relies on multiple kinetic pathways to product formation.28–31 Both models have been applied to solid-state photochemical reactions, where strong deviations from simple first-order kinetics are often observed. But so far, there is no universally accepted framework for analyzing these kinetics, nor is there a sense of whether these non-classical phenomena could be harnessed to give rise to new photomechanical behaviors or improved performance. Quantitative models for photomechanical bending have typically assumed standard first-order chemical kinetics,2,22,32,33 although it has been noted that such models cannot explain all experimental observations.34
In order to examine the connection between complex kinetics and photomechanical behavior more closely, we chose 4-fluoro-9-anthracenecarboxylic acid (4F-9AC) as a model photomechanical crystal system. In the crystal, this molecule arranges into parallel head-to-head stacks in which the anthracene cores are well-positioned to undergo a [4 + 4] photodimerization reaction. The head-to-head photodimer is unstable due to steric interactions between the carboxylic acid sidegroups and spontaneously dissociates back into the monomer pair in less than one minute at room temperature (Scheme 1) while maintaining crystal integrity.35–37 Thus 4F-9AC crystals exhibit T-type reversibility and can potentially function as photomechanical actuators.38–40 The kinetics of the dimer dissociation determine the mechanical reset time and also provide a unique opportunity to study cooperative effects in the crystal. Because this backreaction does not require photons, uncertainties about light intensity and penetration, as well as complications from nonradiative relaxation processes, are absent, considerably simplifying the kinetic analysis. Furthermore, varying the amount of initial light exposure allows us to control initial reactant (photodimer) concentrations, in contrast to photochemical reactions which typically start with 100% reactant. Experimentally, the photodimer dissociation can be followed using spectroscopy because the loss of aryl ring conjugation in the photodimer causes its absorption to shift deep into the ultraviolet (UV). A probing beam at 405 nm excites only the unreacted monomer, leading to excimer emission centered at approximately 510 nm. This fluorescence signal provides a convenient way to monitor the monomer population over time.
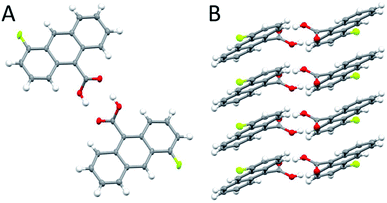 | ||
| Scheme 1 The crystal structure of 4F-9AC (A) viewed from the top of the head to head stack; (B) viewed from the side of the hydrogen-bonded stacks. | ||
In this paper, we measure both the chemical changes (using fluorescence) and mechanical changes (by imaging bending microneedles) for single 4F-9AC crystals after exposure to a pulse of UV light. If each photodimer breaks apart independently, we expected to see an exponential recovery of the monomer fluorescence, independent of the initial dimer concentration created by the dose of UV photons. Instead, we find that the dissociation kinetics depend strongly on the initial concentration of photodimer, slowing down and becoming nonexponential at high photodimer concentrations. We also identify a new feature in the photomechanical behavior: the ability of a very weak control beam to suppress the chemical/mechanical recovery after large dimer conversions. This new phenomenon provides a way to optically control the solid-state photochemical reaction in this photomechanical crystal. The highly nonlinear kinetic behavior suggests that photochemical reaction dynamics are fundamentally different in these crystals. Analyses based on standard linear and nonlinear kinetic models fail to reproduce the observed dynamics, highlighting the need for a more sophisticated theory to describe the cooperative phenomena that can occur in solid-state crystalline reactions. It is possible that these nonlinear kinetic phenomena may lead to new properties and/or improved performance in photomechanical crystals.
Experimental
4-Fluoro-9-anthracene carboxylic acid (4F-9AC) crystal preparation
The detailed synthesis of 4F-9AC has been described previously.37 All 4F-9AC crystals were made by sublimation at ambient pressure of 10 mg of powered 4F-9AC within three small cylinders, 1 cm in diameter and height, stacked vertically to collected deposited crystals (ESI Fig. S1†). The powdered compound and stack of small cylinders were covered with an amber vial, heated to between 180–190 °C and left for 24 hours or until most of the 4F-9AC sublimed and deposited as sub-millimeter size needles on the side of the first and second glass cylinders.Time-resolved fluorescence measurements
Crystalline 4F-9AC samples were mounted between two glass slides in air. The 400 nm excitation pulses were generated by a Coherent Libra Ti:sapphire femtosecond laser system producing 800 nm pulses that were frequency doubled in a Beta Barium Borate (BBO) crystal. The fluorescence was collected using a front face geometry with a Hamamatsu C4334 Streakscope streak camera with a time resolution of about 25 ps. The 1 kHz pulse train had an average power of 150 nW at the sample.Fluorescence and optical microscopy measurements
To measure the fluorescence recovery process, crystals of 4F-9AC were placed on a glass slide on a microscope stage. Larger, rectangular crystals were used for fluorescence measurements because these crystals resisted bending and deformation, preventing misalignment of the pump and probe beams. The stationarity of each crystal after UV exposure was checked before acquiring fluorescence recovery data. The crystal was irradiated with the 405 nm pump beam for a predetermined period and then probed with a separate, weaker beam, of the same wavelength. The radius of the probe spot (17 μm) was three times smaller than that of the pump spot (55 μm). Under these conditions, 90% of the probe beam is encompassed inside a spatial region where the pump intensity varies by only 20% (ESI Fig. S2†). The probe beam was modulated at a frequency of 99 Hz and the fluorescence signal was collected using a photomultiplier tube in conjunction with a lock-in amplifier. A custom Labview program was written to open and close the Melles Griot Electronic Shutter Controller (04 ISC 850) (to control the pump beam duration) while reading the fluorescence signal from the lock-in. In experiments where the probe beam was intermittently blocked to reduce sample exposure, the blocking was accomplished by manually putting a beam stop in the probe beam path for 8 s, then removing it for 2 s, and repeating this cycle for the duration of the data collection.The same microscopy set-up was used to record the mechanical movement of smaller, needle-shaped crystals that could bend under light exposure. For mechanical recovery measurements, the pump and hold beam spot sizes were both 55 μm. Instead of using the photomultiplier and lock-in amplifier, the crystal bend and recovery dynamics were imaged using an Amscope MU900 digital microscope camera.
Results and discussion
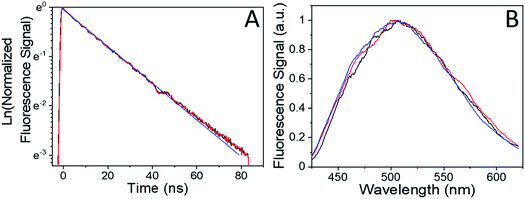
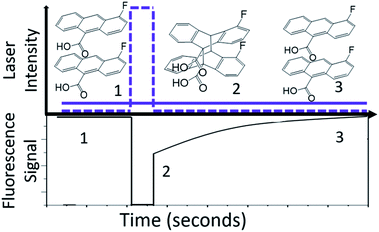
Our previous studies of the photophysics of 4F-9AC relied on thin-film polycrystalline samples grown by solvent evaporation.37 In this work, we concentrated on measuring the dynamics in single crystals grown by sublimation. In all cases, the crystal samples had rectangular or needle-like morphologies that reflect the one-dimensional stacking of 4F-9AC molecules. The hope was that these well-formed crystals would contain fewer structural defects than the irregularly shaped crystals from a solution deposited polycrystalline film. This hypothesis was confirmed by time-resolved fluorescence experiments. In previous work on polycrystalline 4F-9AC films, a biexponential decay was observed, with a fast component of 2 ns followed by a slower component with a time constant of 22 ns. In the single crystal samples studied here, only a single exponential decay was observed. The normalized fluorescence decay, along with the single exponential fit with a 27 ns decay time, are shown in Fig. 1A. Fig. 1B shows the fluorescence spectrum measured at different points in the decay. The spectrum is constant, consistent with a single emitting species. The fluorescence decay dynamics did not change with location on the crystal. Based on the broad, featureless lineshape and long lifetime, we assign this species to an excimer formed between neighboring 4F-9AC molecules. This excimer is generally regarded as a precursor to photodimer formation.41–43 After intense UV exposure photodimerized ∼50% of the crystal (i.e. 50% of the monomer fluorescence signal was lost), it was allowed to recover in the dark. The measured fluorescence spectrum and lifetime were the same as an unreacted crystal. There was no evidence that photodimerization cycling could lead to photooxidation or permanent chemical damage in the form of new emitters or fluorescence quenching.In order to monitor the kinetics of photodimer dissociation, we utilized the modified fluorescence-recovery-after-photobleaching (FRAP) experiment illustrated in Fig. 2. This type of experiment is commonly used to measure molecular diffusion in biological cells,44,45 and here it was adapted to monitor chemical dynamics in single microcrystals. A strong pump (bleach) pulse initiates a photochemical reaction that removes fluorescent species via photodimerization that breaks the anthracene ring conjugation. The photodimers produced by this pulse dissociate back to monomer pairs on a timescale of seconds to minutes, restoring the anthracene conjugation. The recovery of the fluorescence due to photodimer dissociation is monitored by a much weaker probe beam. In our experiments, the photobleaching pulse is a shuttered 405 nm laser beam with a peak intensity at the sample of 101 W cm−2, while the probe beam has an intensity of 10−2 W cm−2 at its focal spot. The diameter of the bleach focus was 3× greater than that of the probe to ensure that the probe saw a region where the pump intensity varied by less than 20%. The crystal thicknesses were typically less than 1 μm, comparable to the penetration depth of the 405 nm light. It is possible that attenuation of the 405 nm light caused the concentration of photodimer to vary throughout the depth of the crystal. However, the fact that the bleach scaled linearly with pump pulse duration is good evidence that the entire crystal experienced the photodimerization reaction, since if the crystal were much thicker than the light penetration depth, smaller pump pulses would not be able to bleach throughout the crystal and the fluorescence signal would not decline. Furthermore, we performed multiple experiments on single regions to assess fatigue and compared results across different days and different crystals. The sample-to-sample variation in fluorescence recovery rates was less than 10%, despite the fact that we sampled 4F-9AC crystals of varying shapes and sizes, again suggesting that optical propagation effects had negligible impact on the measured kinetics.
For the FRAP experiments, we define the bleach depth BD as
 | (1) |
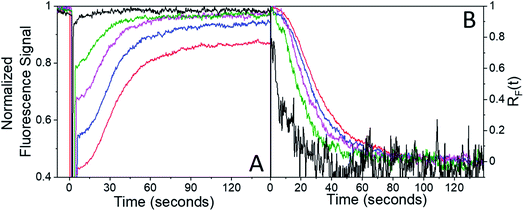
After the bleach pulse, the subsequent fluorescence recovery dynamics depend sensitively on the bleach depth BD. Five representative curves for the same crystal sample are shown in Fig. 3. A bleach of 3% results in an exponential recovery back to the original level. A 55% bleach, on the other hand, leads to a highly nonexponential curve that only recovers to 90% of the original signal level. The initial portion of the fluorescence recovery can be analyzed to extract an empirical bleach recovery function, RF(t) with asymptotic conditions RF(t = 0) = 1 and RF(t → ∞) = 0. F(τend) is the asymptotic fluorescence signal at the end of the scan, which varies with BD as discussed below. We can extract RF(t) from the experimental data in Fig. 3A,
 | (2) |
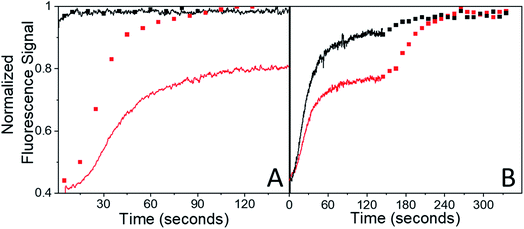
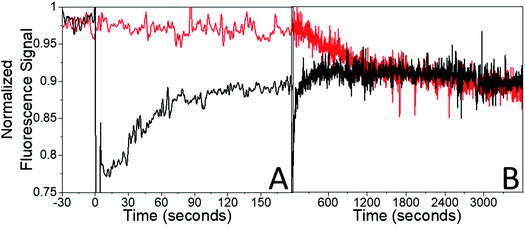
Ideally the sample should recover back to its original state, i.e. F(τend) = F(0). We first suspected that the observation of F(τend) < F(0) reflected permanent sample damage at the larger BD values. However, subsequent experiments showed that the F(τend) value was suppressed by the presence of the probe beam itself. Without any pump pulse, the weak probe beam has a negligible effect on the fluorescence signal, which shows less than a 1% decline over the course of 15 min. Given this result, we had assumed that fluorescence bleaching due to the probe could be neglected during the bleach recovery experiments. This was true for weak (BD < 0.10) bleach pulses, but not for larger BD values. For BD > 0.30, the presence of the weak probe prevented full recovery even after several minutes. The effect of the probe beam could be illustrated by intermittently blocking it during the recovery, lowering the probe photon dose by a factor of 5 while maintaining the same signal-to-noise level. For a 3% bleach, the continuous and intermittent probe recovery curves overlap (Fig. 4A), as expected. But when the bleach depth exceeded 30%, the presence of the probe beam prevented full recovery, while in the presence of the intermittent probe, complete recovery was again observed (Fig. 4A). This effect could also be observed during the course of a single experiment. If the probe beam was switched from continuous to intermittent, a rapid fluorescence recovery occurred from the plateaued value attained during continuous probe exposure (Fig. 4B).
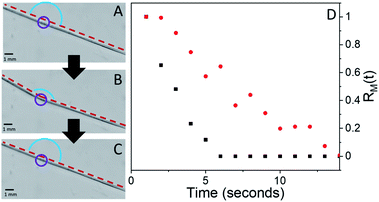
The interesting features of the chemical recovery of the crystal as measured by fluorescence are mirrored by the mechanical recovery as measured using microscopy. When a microneedle of 4F-9AC is irradiated at a specific spot, it bends due to the formation of local strain at the interface between reactant and product regions, as observed previously for the closely related compound 9-anthracenecarboxylic acid.52,53Fig. 5A–C show a series of video frames that capture the bending and recovery of a single microneedle, along with fits used to extract the bend angle (ESI Fig. S4†). We can define a mechanical recovery function RM(t), analogous to the RF(t) function defined in eqn (2):
 | (3) |
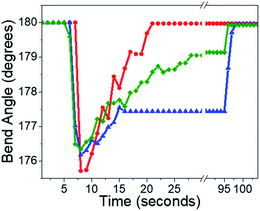
In Fig. 5D, we plot RM(t) for small (3%) and large (30%) BD experiments performed on the same microneedle. The RM(t) curves qualitatively resemble the RF(t) curves shown in Fig. 3: exponential recovery for small initial curvatures transitioning to sigmoidal for larger initial bends. However, the rate of mechanical recovery is 4× faster than the fluorescence recovery. This discrepancy between the reaction and mechanical response times has been observed before in other photomechanical crystal systems32,34,54 and probably reflects the nonlinear relation between population and mechanical action. Finally, complete recovery to θ(0) could be prevented by the presence of a weak 405 nm hold beam, as illustrated in Fig. 6. For large initial bends (large BD values), the bend angle only partially recovered in the presence of a weak 405 nm beam. From a practical standpoint, we can suppress the T-type nature of 4F-9AC by using a low-intensity “hold” beam that maintains the mechanical bend for an arbitrary period of time. Once this beam is turned off, the needle reverts to its original θ(0) shape within 10 s.
The presence of the probe beam did not affect the shape of the early-time RF(t) curve. Very similar RF(t) shapes were observed for both a probe beam with 10−2 W cm−2 and for intermittent blocking (ESI Fig. S5†). The presence of the probe beam simply introduces a constant offset in the F(τend) during the first few minutes of recovery. But for a specific constant condition (i.e. probe beam intensity), the system should eventually reach the same final equilibrium state regardless of initial conditions (i.e. initial bleach depth). If the different F(τend) vales persisted indefinitely, that would suggest some bistability in these crystals. It turns out that the offset F(τend) was not permanent: given enough time the system eventually did evolve to the same state for different bleach depths (amount of initial photodimer created) given the same probe beam conditions. This can be seen from the fluorescence recovery scans shown in Fig. 7. When τend = 180 s, the BD = 30% sample's fluorescence has not recovered to the probe-only signal level. But over the course of 1 hour (3600 s), the probe-only signal gradually declines to meet the BD = 30% signal level. Note that this decline is completely reversible – it reflects a slow build-up of dimer population, not permanent damage. If an intense bleach pulse creates a large initial photodimer population, it attains this equilibrium photostationary state within 3 minutes as opposed to 1 hour. If a weaker bleach pulse is applied, the initial recovery actually reaches the probe-only value, then declines slowly, following the unbleached signal (ESI Fig. S6†). The system always reaches the same final equilibrium state under weak illumination, but the kinetics of reaching this state are extremely sensitive to the sample's initial preparation.
Discussion and analysis
As seen in other molecular crystals, the photomechanical response of 4F-9AC crystals tracks the photochemical kinetics and relative concentrations of reactant and product. Nonlinear reaction kinetics directly impact the mechanical response, and thus any actuator function. In this context, we highlight the two most notable features of the experimental results shown in Fig. 4–7:(1) the shape of the bleach and mechanical recovery curve changes from exponential to sigmoidal as the initial amount of photodimer increases with larger BD values;
(2) the crystal exhibits an increased susceptibility to 405 nm light as BD increases, which allows a weak secondary beam to prevent full recovery back to the monomer and maintain a bend in the crystal.
To analyze the kinetics, we first assume that the fluorescence signal is linearly proportional to the amount of monomeric 4F-9AC in the laser spot, and that the fluorescence quantum yield is unaffected by the amount of reaction. This assumption is supported by the observation that the fluorescence lifetime does not change for a crystal that has been partially photodimerized. We also assume that the temperature change of the crystal is negligible. While we have not directly measured the temperature in situ, we emphasize the trend in rates is the opposite of what we would expect from transient heating: more laser energy (and presumably higher heating) actually leads to slower recovery kinetics, as does the presence of the hold laser beam. Given these assumptions, we proceed to analyze the data using kinetic models that describe the population changes. In the following, we consider two models: (1) the standard first order kinetic model, typically used to describe photochemical reactions in solution; and (2) a kinetic scheme based on the FW model that can approximate nucleation and leads to concentration-dependent reaction rates.
A simple first-order kinetic model is based on the scheme
 | (4) |
 | (5) |
 , independent of starting concentration (i.e. bleach depth). Fig. 8 shows the calculated RF(t) curves with k1 = 0.1 s−1 and I = 0 (no probe beam), overlaid with the experimental curves. According to the first-order kinetic model, RF(t) is always the same exponential function and does not depend on BD. The first-order kinetic model is unable to reproduce either the change in RF(t) or the lack of complete recovery at long times. Fluorescence recovery curves calculated using eqn (5), overlaid with the experimental curves, are given in the ESI (Fig. S7†).
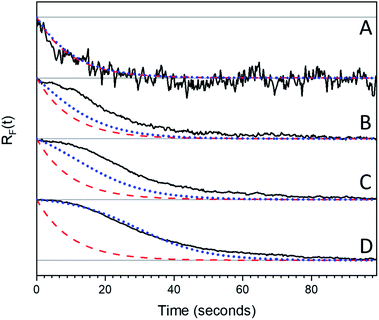 | ||
| Fig. 8 Experimental Rf(t) curves (black solid lines) are stacked by increasing photon dose and therefore bleach depth ((A) 0.5 seconds, (B) 2.5 seconds, (C) 4 seconds, (D) 5 seconds). These curves are over laid with exponential curves (red dashed lines) calculated using eqn (5) with I = 0 and k1 = 0.1 s−1 and curves calculated using the FW model (blue dotted lines) for different bleach depths eqn (7) was used with I = 0, k1 = 0.1 s−1 and k2 = 0.005 s−1. Note that the calculated exponential decays are the same for all bleach depths. | ||
The FW model utilizes the two-step reaction scheme
Here k1 and ϕ1 reflect reactions occurring in majority A regions and k2 and ϕ2 reflect the changed reaction rates in the presence of the photodimer B. For example, if k1 > k2, then the presence of dimer inhibits the dissociation. This reaction scheme leads to the nonlinear differential equation for [A]:
 | (6) |
 | (7) |
 depends on [A]0 which is experimentally obtained from the initial fluorescence bleach depth
  . Ideally, we would monitor the initial photodimer/monomer concentrations directly, for example using absorbance, but given the microscopic sample size and fast dynamics, these concentrations must be inferred from the change in fluorescence signal.
Fig. 8 shows RF(t) curves calculated using eqn (7) with k1 = 0.1 s−1, k2 = 0.005 s−1 and I = 0 (no probe beam), overlaid with the experimental curves. The recovery curves are exponential for small BD values, but for large BD values there is an induction period at the beginning that leads to sigmoidal behavior, as observed experimentally. The FW model captures the transition from exponential to sigmoidal at the extreme BD values, but it underestimates the amount of sigmoidal character for intermediate values. Experimentally, for BD > 0.5 there is already a sigmoidal character in the recovery that is not predicted by the FW model, irrespective of the k1/k2 values used. The inability of the FW model to generate sigmoidal decays for lower BD values arises from the fact that even a small amount of species A can cause the k1 rate to dominate the kinetic behavior, since it is assumed to be homogeneously distributed throughout the sample. To limit the role of k1, a large fraction of the sample must be converted to B, so the slower k2 process can become dominant and slow down the net reaction rate. Once an appreciable amount of A is formed (∼10%), the system always transitions from sigmoidal to exponential behavior.
An additional problem is the inability of either model to reproduce the long-lived offset for the larger BD values in the presence of the probe beam. Eqn (4) explicitly predicts that the t → ∞ population is independent of [A]0, the monomer population after the bleach pulse. For the FW model, we have two quantum yields, ϕ1 and ϕ2, and one might expect that larger ϕ2 values would allow a weak secondary beam to freeze in the dimer population. To test whether this is the case, in Fig. 9 we plot [A](t) recovery curves for a different BD values for a weak probe beam (σIϕ1 = 0.001 s−1) and different σIϕ2 values of 0.001 s−1, 0.01 s−1, 0.05 s−1, and 0.10 s−1. We did not attempt to dissect the product into its I, σ and ϕ2 constituents, but we can assume that any variation is due to the quantum yield ϕ2, with σ and I constant for the two populations. All the simulated signals converge smoothly to the same photostationary state, regardless of initial conditions (BD values). But the FW model does predict that the time to reach this state can be substantially lengthened by larger σIϕ2 values. In particular, the BD = 0.1 and BD = 0.4 curves in Fig. 9D are qualitatively similar to the experimental curves in Fig. 7B. This similarity suggests that the idea that there are two distinct populations in the sample, with forward quantum yields ϕ1 and ϕ2 that differ by a factor of 10 or more, has some basis in reality. Accordingly, we suspect that the holding behavior results from a population of 4F-9AC molecules that are in close proximity to photodimer domains and are more susceptible to photodimerization (i.e. have a much higher ϕ2 value).
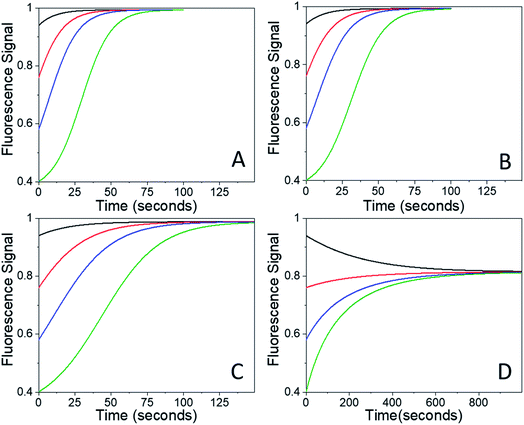 | ||
| Fig. 9 Fluorescence recovery curves calculated using eqn (7) for k1 = 0.1 s−1, k2 = 0.005 s−1, σIϕ1 = 0.001 s−1 and (A) σIϕ2 = 0.001 s−1, (B) σIϕ2 = 0.01 s−1, (C) σIϕ2 = 0.05 s−1, and (D) σIϕ2 = 0.10 s−1. Note different time axis in (D). Different values of ϕ2 lead to different long-time offsets, but the curves calculated using the FW model do not show the plateau behavior seen experimentally. | ||
The ability of a single crystal to support two separate photoactive populations of molecules with very different reactivities (k1versus k2, ϕ1versus ϕ2) is not completely surprising. The existence of such reaction heterogeneity must be assumed to explain the auto-catalytic and auto-inhibitory kinetics seen in many solid-state reactions, although different analytical models have been used to describe them. It is possible that distinct photodimer populations could exist in spatially distinct regions of the crystal due to heterogeneous strain, defect densities, or light penetration. Although it is tempting to assume that these separate populations evolve in parallel, without intermixing, we know that this partitioning cannot persist indefinitely because the crystals eventually achieve the same equilibrium state for the same probe beam intensity, regardless of the initial BD. A full description of the dynamics will probably require development of a model that explicitly takes time-dependent spatial distribution of reactions into account, as has been attempted for one-dimensional systems.55–58 Alternatively, it is possible that a more sophisticated, multi-dimensional model for nonlinear reaction kinetics may be applied to this problem.59 Both theoretical treatments are beyond the scope of this paper. What is most surprising about the 4F-9AC crystal system is the large (order of magnitude) change in kinetics for high photodimer concentrations. This change leads to dramatic changes in recovery rates and holding behaviors for large BD values.
We conclude with some practical observations. First, it should be noted that the intermolecular hydrogen-bonding in crystalline 4F-9AC may make it a case in which cooperative phenomena are especially pronounced. When a photodimer is formed, the butterfly distortion of the anthracene rings would be expected to affect the hydrogen-bonding to neighboring molecules.60,61 If the surrounding molecules are all monomers, then there would be an energetic driving force to restore the network of hydrogen-bonds in the unreacted crystal, destabilizing the lone photodimer. At large conversions, however, when the surrounding molecules have been dimerized, it is possible that a new network of hydrogen bonds can be formed that stabilizes the dimers and changes the dissociation energetics. This would provide a physical origin for the observed difference in k1 and k2 rates. Although most unimolecular isomerizations have been analyzed under the assumption of first-order kinetics,2,22,32,33 it is possible that nonlinear reaction kinetics may arise for bimolecular reactions or when strong intermolecular interactions are present. Further experiments to measure the dimer crystal structure, perhaps by trapping it at low temperatures, along with calculations of crystal energies, would be needed to confirm this hypothesis.
A second point is that even though its physical mechanism is not fully understood, the ability of a weak probe beam to lock in the photoproduct in a T-type photochromic material has practical implications. A P-type photochromic material will remain in the product state and hold its position until illumination at a second wavelength switches it back, allowing precise control of its reset time but at the cost of using two separate light sources. T-type materials generate an unstable photoproduct state that reverts back to the reactant when the light is turned off, providing reversibility with a single light source, but without the ability to control the reset time. In order to maintain a constant level of photoproduct and actuation in a T-type material, continuous high-intensity illumination normally would be required. But in the case of 4F-9AC, a much lower level of light exposure can hold the crystal at a nonzero curvature after a large initial pulse of light has been used to set the crystal response. After a partial recovery, the crystal can be held indefinitely by a much weaker (10−3 to 10−2) control beam. If this control light is suddenly turned off, the photodimer population quickly decays, accompanied by a return to the original crystal shape. In this way, nonlinear reaction kinetics provide a way to control the reset time in a T-type crystal using a single excitation wavelength, providing a simpler way to achieve the controllability of a P-type material.
Conclusion
We have analyzed the dynamics of a solid-state chemical reaction, the thermal dissociation of the 4F-9AC photodimer. This crystal is of interest as a T-type photomechanical molecular crystal. A microscopic fluorescence-recovery-after-photobleaching experiment was used to monitor the kinetics of dimer dissociation in single microcrystals. We find that the dissociation kinetics exhibit a strong dependence on the initial concentration of photodimer, slowing down as the initial concentration of photodimer increases and also producing a population with enhanced susceptibility to photodimerization. The slowdown in the dimer dissociation, accompanied by the increase in photoconversion efficiency, allows a relatively low light intensity to cancel out the thermal backreaction. This phenomenon, not yet fully understood, leads to an unexpected opportunity: a relatively weak beam that would have no observable effect on a pristine monomer crystal can control the mechanical response in a partially dimerized crystal. These results show that cooperative reaction kinetics are not just an interesting artifact of solid-state chemistry but can be harnessed for practical applications like making a T-type material into a switch-and-hold actuator.Conflicts of interest
There are no conflicts to declare.Acknowledgements
This research was supported by the National Science Foundation grant DMR-1810514 and by the MURI on Photomechanical Material Systems (ONR N00014-18-1-2624). R. O. K. acknowledges the support of KSAU-HS/KAIMRC through grant RC10/104.References
- T. Kim, L. Zhu, R. O. Al-Kaysi and C. J. Bardeen, Organic photomechanical materials, ChemPhysChem, 2014, 15, 400–414 CrossRef CAS PubMed.
- P. Naumov, S. Chizhik, M. K. Panda, N. K. Nath and E. Boldyreva, Mechanically Responsive Molecular Crystals, Chem. Rev., 2015, 115, 12440–12490 CrossRef CAS PubMed.
- T. J. White, Photomechanical Materials, Composites, and Systems, Wiley, Hoboken, New Jersey, 1st edn, 2017 Search PubMed.
- H. Wang, P. Chen, Z. Wu, J. Zhao, J. Sun and R. Lu, Bending, Curling, Rolling, and Salient Behavior of Molecular Crystals Driven by [2+2] Cycloaddition of a Styrylbenzoxazole Derivative, Angew. Chem., Int. Ed., 2017, 56, 9463–9467 CrossRef CAS PubMed.
- O. S. Bushuyev, A. Tomberg, T. Friscic and C. J. Barrett, Shaping Crystals with Light: Crystal-to-Crystal Isomerization and Photomechanical Effect in Fluorinated Azobenzenes, J. Am. Chem. Soc., 2013, 135, 12556–12559 CrossRef CAS PubMed.
- S. Kobatake, S. Takami, H. Muto, T. Ishikawa and M. Irie, Rapid and reversible shape changes of molecular crystals on photoirradiation, Nature, 2007, 446, 778–781 CrossRef CAS PubMed.
- M. Morimoto and M. Irie, A diarylethene cocrystal that converts light into mechanical work, J. Am. Chem. Soc., 2010, 132, 14172–14178 CrossRef CAS PubMed.
- H. Koshima, H. Nakaya, H. Uchimoto and N. Ojima, Photomechanical motion of furylfulgide crystals, Chem. Lett., 2012, 41, 107–109 CrossRef CAS.
- H. Koshima, N. Ojima and H. Uchimoto, Mechanical motion of azobenzene crystals upon photoirradiation, J. Am. Chem. Soc., 2009, 131, 6890–6891 CrossRef CAS PubMed.
- R. Samanta, S. Ghosh, R. Devarapalli and C. M. Reddy, Visible Light Mediated Photopolymerization in Single Crystals: Photomechanical Bending and Thermomechanical Unbending, Chem. Mater., 2018, 30, 577–581 CrossRef CAS.
- R. Medishetty, S. C. Sahoo, C. E. Mulijanto, P. Naumov and J. J. Vittal, Photosalient Behavior of Photoreactive Crystals, Chem. Mater., 2015, 27, 1821–1829 CrossRef CAS.
- K. Yadava and J. J. Vittal, Photosalient Behavior of Photoreactive Zn(II) Complexes, Cryst. Growth Des., 2019, 19, 2542–2547 CrossRef CAS.
- E. Uchida, R. Azumi and Y. Norikane, Light-Induced Crawling of Crystals on a Glass Surface, Nat. Commun., 2015, 6, 7310 CrossRef CAS PubMed.
- J. M. Cole, J. d. J. Velazquez-Garcia, D. J. Gosztola, S. G. Wang and Y.-S. Chen, Light-Induced Macroscopic Peeling of Single Crystal Driven by Photoisomeric Nano-Optical Switching, Chem. Mater., 2019, 31, 4927–4935 CrossRef CAS.
- Q. Yu, B. Aguila, J. Gao, P. Xu, Q. Chen, J. Yan, D. Xing, Y. Chen, P. Cheng, Z. Zhang and S. Ma, Photomechanical Organic Crystals as Smart Materials for Advanced Applications, Chem.–Eur. J., 2019, 25, 5611–5622 CrossRef CAS PubMed.
- D. Dattler, G. Fuks, J. Heiser, E. Moulin, A. Perrot, X. Yao and N. Giuseppone, Design of Collective Motions from Synthetic Molecular Switches, Rotors, and Motors, Chem. Rev., 2020, 120, 310–433 CrossRef CAS PubMed.
- H. Durr and H. Bouas-Laurent, Photochromism: Molecules and Systems, Elsevier, New York, 1990 Search PubMed.
- S. Kobatake and Y. Terakawa, Acid-Induced Photochromic System Switching of Diarylethene Derivatives Between P- and T-Types, Chem. Commun., 2007, 1698–1700 RSC.
- J. M. McBride, B. E. Segmuller, M. D. Hollingsworth, D. E. Mills and B. A. Weber, Mechanical Stress and Reactivity in Organic Solids, Science, 1986, 234, 830–835 CrossRef CAS PubMed.
- N. M. Peachey and C. J. Eckhardt, Energetics of Organic Solid-State Reactions: Lattice Dynamics in the 2,5-Distyrlpyrazine Photoreaction, J. Phys. Chem., 1993, 97, 10849–10856 CrossRef CAS.
- T. Luty and C. J. Eckhardt, General Theoretical Concepts for Solid State Reactions: Quantitative Formulation of the Reaction Cavity, Steric Compression, and Reaction-Induced Stress Using an Elastic Multipole Representation of Chemical Pressure, J. Am. Chem. Soc., 1995, 117, 2441–2452 CrossRef CAS.
- S. Chizhik, A. Sidelnikov, B. Zakharov, P. Naumov and E. Boldyreva, Quantification of Photoinduced Bending of Dynamic Molecular Crystals: from Macroscopic Strain to Kinetic Constants and Activation Energies, Chem. Sci., 2018, 9, 2319–2335 RSC.
- J. W. Christian, The Theory of Transformations in Metals and Alloys, Pergamon, Oxford, UK, 1981 Search PubMed.
- M. Bertmer, R. C. Nieuwendaal, A. B. Barnes and S. E. Hayes, Solid-State Photodimerization Kinetics of α-Trans-Cinnamic Acid to α-Truxillic Acid Studied Via Solid-State NMR, J. Phys. Chem. B, 2006, 110, 6270–6273 CrossRef CAS PubMed.
- I. Fonseca, S. E. Hayes, B. Blumich and M. Bertmer, Temperature Stability and Photodimerization Kinetics of β-Cinnamic Acid and Comparison to Its α-Polymorph as Studied by Solid-State NMR Spectroscopy Techniques and DFT Calculations, Phys. Chem. Chem. Phys., 2008, 10, 5898–5907 RSC.
- J. B. Benedict and P. Coppens, Kinetics of the Single-Crystal to Single-Crystal Two-Photon Photodimerization of α-Trans-Cinnamic Acid to α-Truxillic Acid, J. Phys. Chem. A, 2009, 113, 3116–3120 CrossRef CAS PubMed.
- J. Kohout, An Alternative to the JMAK Equation for a Better Description of Phase Transformation Kinetics, J. Mater. Sci., 2008, 43, 1334–1339 CrossRef CAS.
- M. A. Watzky and R. G. Finke, Transition Metal Nanocluster Formation Kinetic and Mechanistic Studies. A New Mechanism When Hydrogen Is the Reductant: Slow, Continuous Nucleation and Fast Autocatalytic Surface Growth, J. Am. Chem. Soc., 1997, 119, 10382–10400 CrossRef CAS.
- E. E. Finney and R. G. Finke, Is There a Minimal Chemical Mechanism Underlying Classical Avrami-Erofe'ev Treatments of Phase-Transformation Kinetic Data?, Chem. Mater., 2009, 21, 4692–4705 CrossRef CAS.
- T. Salzillo, S. Zaccheroni, R. G. D. Valle, E. Venuti and A. Brillante, Micro Raman Investigation of the Photodimerization Reaction of 9-Cyanoanthracene in the Solid State, J. Phys. Chem. C, 2014, 118, 9628–9635 CrossRef CAS.
- F. Tong, M. P. Hanson and C. J. Bardeen, Analysis of Reaction Kinetics in the photomechanical Molecular Crystal 9-Methylanthracene Using an Extended Finke–Watzky Model, Phys. Chem. Chem. Phys., 2016, 18, 31936–31945 RSC.
- T. Kim, L. Zhu, L. J. Mueller and C. J. Bardeen, Mechanism of photo-induced bending and twisting in crystalline microneedles and microribbons composed of 9-methylanthracene, J. Am. Chem. Soc., 2014, 136, 6617–6625 CrossRef CAS PubMed.
- N. K. Nath, L. Pejov, S. M. Nichols, C. Hu, N. Saleh, B. Kahr and P. Naumov, Model for photoinduced bending of slender molecular crystals, J. Am. Chem. Soc., 2014, 136, 2757–2766 CrossRef CAS PubMed.
- I. T. Desta, S. A. Chizhik, A. A. Sidelnikov, D. P. Karothu, E. V. Boldyreva and P. e. Naumov, Mechanically Responsive Crystals: Analysis of Macroscopic Strain Reveals “Hidden” Processes, J. Phys. Chem. A, 2020, 124, 300–310 CrossRef CAS PubMed.
- Y. Ito and H. Fujita, Formation of an unstable photodimer from 9-anthracenecarboxylic acid in the solid state, J. Org. Chem., 1996, 61, 5677–5680 CrossRef CAS.
- L. Zhu, R. O. Al-Kaysi, R. J. Dillon, F. S. Tham and C. J. Bardeen, Crystal structures and photophysical properties of 9-anthracene carboxylic acid derivatives for photomechanical applications, Cryst. Growth Des., 2011, 11, 4975–4983 CrossRef CAS.
- L. Zhu, F. Tong, C. Salinas, M. K. Al-Muhanna, F. S. Tham, D. Kisailus, R. O. Al-Kaysi and C. J. Bardeen, Improved Solid-State Photomechanical Materials by Fluorine Substitution of 9-Anthracene Carboxylic Acid, Chem. Mater., 2014, 26, 6007–6015 CrossRef CAS.
- L. Zhu, R. O. Al-Kaysi and C. J. Bardeen, Photoinduced Ratchet-Like Rotational Motion of Branched Molecular Crystals, Angew. Chem., Int. Ed., 2016, 55, 7073–7076 CrossRef CAS PubMed.
- R. O. Al-Kaysi, F. Tong, M. Al-Haidar, L. Zhu and C. J. Bardeen, Highly Branched Photomechanical Crystals, Chem. Commun., 2017, 53, 2622–2625 RSC.
- F. Tong, C. J. Bardeen and R. O. Al-Kaysi, Photomechanical Crystals Made from Anthracene Derivatives, in Mechanically Responsive Materials for Soft Robotics, ed. H. Koshima, Wiley-VCH, Weinheim, Germany, 2020 Search PubMed.
- B. Stevens, Photoassociation in aromatic systems, Adv. Photochem., 1971, 8, 161–226 CAS.
- J. L. Charlton, R. Dabestani and J. Saltiel, Role of triplet–triplet annihilation in anthracene dimerization, J. Am. Chem. Soc., 1983, 105, 3473–3476 CrossRef CAS.
- H. Bouas-Laurent, A. Castellan, J.-P. Desvergne and R. Lapouyade, Photodimerization of anthracenes in fluid solutions: (part 2) mechanistic aspects of the photocycloaddition and of the photochemical and thermal cleavage, Chem. Soc. Rev., 2001, 30, 248–263 RSC.
- D. Axelrod, D. E. Koppel, J. Schlessinger, E. Elson and W. W. Webb, Mobility Measurement by Analysis of Fluorescence Photobleaching Recovery Kinetics, Biophys. J., 1976, 16, 1055–1069 CrossRef CAS PubMed.
- N. Lorén, J. Hagman, J. K. Jonasson, H. Deschout, D. Bernin, F. Cella-Zanacchi, A. Diaspro, J. G. McNally, M. Ameloot, N. Smisdom, M. Nydén, A.-M. Hermansson, M. Rudemo and K. Braeckmans, Fluorescence Recovery after Photobleaching in Material and Life Sciences: Putting Theory into Practice, Q. Rev. Biophys., 2015, 48, 323–387 CrossRef PubMed.
- R. More, G. Busse, J. Hallmann, C. Paulmann, M. Scholz and S. Techert, Photodimerization of crystalline 9-anthracenecarboxylic acid: a nontopotactic autocatalytic transformation, J. Phys. Chem. C, 2010, 114, 4142–4148 CrossRef CAS.
- E. R. Cohen and H. Reiss, Kinetics of reactant isolation. I. One-dimensional problems, J. Chem. Phys., 1963, 38, 680–691 CrossRef CAS.
- J. Even and M. Bertault, Monte-Carlo simulations of chemical reactions in molecular crystals, J. Chem. Phys., 1999, 110, 1087–1096 CrossRef CAS.
- K. D. M. Harris, J. M. Thomas and D. Williams, Mathematical Analysis of Intra-Stack Dimerizations in Reactive Crystalline Solids, J. Chem. Soc., Faraday Trans., 1991, 87, 325–331 RSC.
- G. K. Kole, T. Kojima, M. Kawano and J. J. Vittal, Reversible Single-Crystal-to-Single-Crystal Photochemical Formation and Thermal Cleavage of a Cyclobutane Ring, Angew. Chem., Int. Ed., 2014, 53, 2143–2146 CrossRef CAS PubMed.
- S. M. Oburn, J. Quentin and L. R. MacGillivray, A Divergent Alkyne Diol Directs [2 + 2] Photoreactivity in the Solid State: Cocrystal, Supramolecular Catalysis, and Sublimation Effects, Molecules, 2019, 24, 3059 CrossRef CAS PubMed.
- R. O. Al-Kaysi and C. J. Bardeen, Reversible photoinduced shape changes of crystalline organic nanorods, Adv. Mater., 2007, 19, 1276–1280 CrossRef CAS.
- J. T. Good, J. J. Burdett and C. J. Bardeen, Using two-photon excitation to control bending motions in molecular-crystal nanorods, Small, 2009, 5, 2902–2909 CrossRef CAS PubMed.
- T. Salzillo and A. Brillante, Commenting on the Photoreactions of Anthracene Derivatives in the Solid State, CrystEngComm, 2019, 21, 3127–3136 RSC.
- T. Alfrey and W. G. Lloyd, Kinetics of High-Polymer Reactions: Effects of Neighboring Groups, J. Chem. Phys., 1963, 38, 318–321 CrossRef CAS.
- C. B. Arends, General Solution to the Problem of the Effect of Neighboring Groups in Polymer Reaction, J. Chem. Phys., 1963, 38, 322–324 CrossRef CAS.
- A. Silberberg and R. Simha, Kinetics of Reversible Reactions on Linear Lattices with Neighbor Effects, Biopolymers, 1968, 6, 479–490 CrossRef CAS PubMed.
- J. W. Evans and D. R. Burgess, Irreversible Reaction on a Polymer Chain with Range Two Cooperative Effects, J. Chem. Phys., 1983, 79, 5023–5028 CrossRef CAS.
- M. Kryvohuz and S. Mukamel, Nonlinear Response Theory in Chemical Kinetics, J. Chem. Phys., 2014, 140, 034111 CrossRef PubMed.
- R. More, M. Scholz, G. Busse, L. Busse, C. Paulmann, M. Tolkiehn and S. Techert, Hydrogen Bond Dynamics in Crystalline β-9-Anthracene Carboxylic Acid – a Combined Crystallographic and Spectroscopic Study, Phys. Chem. Chem. Phys., 2012, 14, 10187–10195 RSC.
- T. Salzillo, E. Venuti, C. Femoni, R. G. D. Valle, R. Tarroni and A. Brillante, Crystal Structure of the 9-Anthracene–Carboxylic Acid Photochemical Dimer and Its Solvates by X-Ray Diffraction and Raman Microscopy, Cryst. Growth Des., 2017, 17, 3361–3370 CrossRef CAS.
Footnote |
| † Electronic supplementary information (ESI) available. See DOI: 10.1039/d0sc03557b |
| This journal is © The Royal Society of Chemistry 2020 |

