 Open Access Article
Creative Commons Attribution 3.0 Unported Licence
A fluorophore's electron-deficiency does matter in designing high-performance near-infrared fluorescent probes†
Xue-Xiang
Zhang‡
 a,
Huan
Qi‡
b,
Ya-Lan
Liu
a,
Song-Qiu
Yang
a,
Huan
Qi‡
b,
Ya-Lan
Liu
a,
Song-Qiu
Yang
 a,
Peng
Li
c,
Yan
Qiao
 d,
Pei-Yu
Zhang
 *e,
Shu-Hao
Wen
e,
Hai-long
Piao
 *b and
Ke-Li
Han
 *ac
*ac
aState Key Laboratory of Molecular Reaction Dynamics, Dalian Institute of Chemical Physics, Chinese Academy of Sciences, Dalian 116023, P. R. China. E-mail: klhan@dicp.ac.cn
bCAS Key Laboratory of Separation Science for Analytical Chemistry, Dalian Institute of Chemical Physics, Chinese Academy of Sciences, Dalian 116023, P. R. China. E-mail: hpiao@dicp.ac.cn
cInstitute of Molecular Sciences and Engineering, Shandong University, Qingdao 266237, P. R. China
dDepartment of Pathophysiology, Basic Medical College of Zhengzhou University, Zhengzhou 450001, P. R. China
eShenzhen Jingtai Technology Co., Ltd, Floor 4, No. 9, Hualian Industrial Zone, Dalang Street, Longhua District, Shenzhen, P. R. China. E-mail: peiyu.zhang2018@gmail.com
First published on 21st September 2020
Abstract
The applications of most fluorescent probes available for Glutathione S-Transferases (GSTs), including NI3 which we developed recently based on 1,8-naphthalimide (NI), are limited by their short emission wavelengths due to insufficient penetration. To realize imaging at a deeper depth, near-infrared (NIR) fluorescent probes are required. Here we report for the first time the designing of NIR fluorescent probes for GSTs by employing the NIR fluorophore HCy which possesses a higher brightness, hydrophilicity and electron-deficiency relative to NI. Intriguingly, with the same receptor unit, the HCy-based probe is always more reactive towards glutathione than the NI-based one, regardless of the specific chemical structure of the receptor unit. This was proved to result from the higher electron-deficiency of HCy instead of its higher hydrophilicity based on a comprehensive analysis. Further, with caging of the autofluorescence being crucial and more difficult to achieve via photoinduced electron transfer (PET) for a NIR probe, the quenching mechanism of HCy-based probes was proved to be PET for the first time with femtosecond transient absorption and theoretical calculations. Thus, HCy2 and HCy9, which employ receptor units less reactive than the one adopted in NI3, turned out to be the most appropriate NIR probes with high-sensitivity and little nonenzymatic background noise. They were then successfully applied to detecting GST in cells, tissues and tumor xenografts in vivo. Additionally, unlike HCy2 with a broad isoenzyme selectivity, HCy9 is specific for GSTA1-1, which is attributed to its lower reactivity and the higher effectiveness of GSTA1-1 in stabilizing the active intermediate via H-bonds based on docking simulations.
Introduction
Three subclasses of cytosolic Glutathione S-Transferases (GSTs, EC 2.5.1.18), GSTA, GSTM and GSTP are regularly overexpressed in tumor cells, especially in those with drug-resistance.1–5 With little toxicity, high sensitivity, a fast and convenient detection process, and facile modification, more and more attention has been drawn to small molecule fluorescent probes.6–12 Recently, with the 1,8-naphthalimide (NI) scaffold, we have developed a two-photon fluorescent probe NI3 for GSTs after an elaborate investigation into the structure–activity relationships between nonenzymatic or enzymatic reactivities and the effective electrophilicity of the receptor unit.13 Despite NI's two-photon absorptivity, its short emission wavelength impeded more practical applications such as in vivo imaging. It would be desirable that both excitation and emission wavelengths are in the near-infrared (NIR) region (650–900 nm) due to deeper skin and tissue penetration, lower background autofluorescence interference, and less phototoxicity.14–19 In addition, NIR fluorophores usually possess a higher molar extinction coefficient ε, and as can be seen in eqn (1), this property is conducive to superior signal sensitivity (refer to deduction I in the ESI†). | (1) |
Hence, (E)-2-(2-(6-hydroxy-2,3-dihydro-1H-xanthen-4-yl)vinyl)-3,3-dimethyl-1-ethyl-3H-indol-1-ium iodide (HCy) was selected as the fluorophore in light of its NIR character, high brightness (εφ) and favorable photostability.20,21 What's more, a systematic study on whether and how replacement of the fluorophore could affect a probe's recognition behavior is lacking. Herein, to address this very issue and to develop highly sensitive NIR fluorescent probes for GSTs with negligible background noise for the first time, receptor units adopted in NI-based probes were linked with HCy to produce the NIR probes, which unexpectedly appeared to be more reactive than NI-based ones. Subsequent studies on the hydrophilicity and the electron-deficiency of the fluorophore demonstrated that the latter is the origin of the higher reactivity. Meanwhile, the fluorescence caging mechanism of HCy-based probes was inspected with femtosecond transient absorption spectra and theoretical calculations. Thus, instead of 4-cyano-2-nitro-benzenesulfonyl adopted in NI3, HCy2 and HCy9 with more inert receptor units turned out to be the most appropriate NIR probes for practical applications, including GST imaging in cells, tissues and even tumor xenografts in nude mice. In addition, the different isoenzyme selectivities of these two probes and the specificity of HCy9 for GSTA1-1 were discussed according to the docking simulations.
Results and discussion
Design, synthesis and evaluation of HCy-based NIR probes in vitro
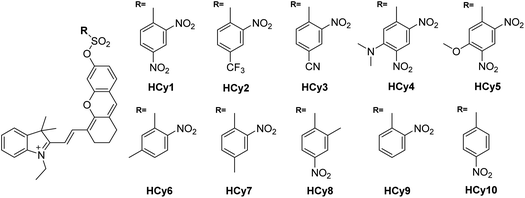
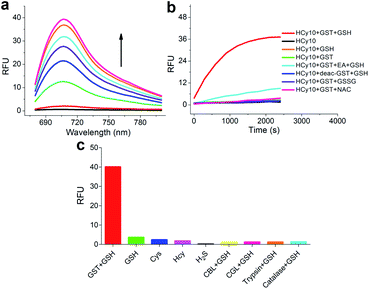
As in the design of NI-based probes, all corresponding receptor units were adopted and attached to HCy to give NIR probes HCy1–10 (Fig. 1 and S1†). The synthesis procedures for compounds HCy1–10 and corresponding characterization using NMR spectroscopy and mass spectrometry are provided in the ESI.† First, we examined if the sequence of the local electrophilicity ωk13,22,23 was influenced by the replacement of the fluorophore from NI to HCy, and the results showed that substantial agreement was reached between these two series (Table S1†), demonstrating that the receptor unit of HCy-based probes still dominates its reactivity (see also Fig. S2†). Then, these probes were subjected to GST detection in vitro, and as shown in Fig. S3,†HCy1 and HCy3–5 manifested bright fluorescence in the presence of GSH with no need for GSTs while HCy2 and HCy6–10 exhibited responses to GSTs with little nonenzymatic background noise. For the latter ones, as a representative, the fluorescence intensity of HCy10 showed a 20-fold increase at 710 nm in ca. 30 min upon encountering GSTs (Fig. 2a). Further, a series of contrast experiments proved that this enhancement arising from GSH addition catalyzed by GST activity (Fig. 2b), and specifically ethacrynic acid (EA, a common inhibitor for various GSTs24) could significantly suppresse the fluorescence increase by inhibiting these activities. Subsequent selectivity experiments illustrated the probe's specificity for GST activity (Fig. 2c). To confirm that HCy-based probes share the same detection mechanism with NI-based ones (Scheme S1†), UPLC-MS and spectra comparative analyses were implemented, and the results have revealed this conclusion (Fig. S4 and S5†).Exploring the cause of the different behaviors (both nonenzymatic and enzymatic) between HCy-based and NI-based probes
Interestingly, although the detection mechanism doesn't change with the replacement of the fluorophore from NI to HCy, some differences do appear. In the NI-series, only NI1 and NI5 with the most and the second most electrophilic groups, respectively, as the receptor unit showed unacceptable nonenzymatic background noise,13 while in the HCy-series, not only HCy1 and HCy5 but also HCy3 and HCy4 did (Fig. S3†). Notably, even HCy10, the receptor unit of which is a relatively inert one, displayed some perceivable nonenzymatic reactivity (Fig. S3j†), which didn't happen in the case of NI10.13 Then, how come? Inspired by eqn (1), we can obtain eqn (2) describing the nonenzymatic reaction signal. The above results are equivalent to the fact that the initial slope of an F–t curve for a HCy-based probe seems to be larger than the one for a NI-based probe bearing the same receptor unit. Thus, one may suspect two causes. One is the higher brightness (εφ) of HCy (28![[thin space (1/6-em)]](https://www.rsc.org/images/entities/char_2009.gif) 440 M−1 cm−1)20 relative to NI's (660 M−1 cm−1),25 which equivalently means amplifying the signal of a certain reaction behavior. The other one is the higher reactivity (knonc) of HCy-based probes. To identify if the second one hits the bull's eye, kinetic study on nonenzymatic reactions was conducted. As shown in Table 1, HCy-based probes are indeed more prone to reacting with GSH than NI-based ones, regardless of the specific receptor unit. These results demonstrated that a probe's reactivity is not only related to the receptor unit but also to the fluorophore. So, when regarding the reactivity, what causes the difference between HCy and NI?
440 M−1 cm−1)20 relative to NI's (660 M−1 cm−1),25 which equivalently means amplifying the signal of a certain reaction behavior. The other one is the higher reactivity (knonc) of HCy-based probes. To identify if the second one hits the bull's eye, kinetic study on nonenzymatic reactions was conducted. As shown in Table 1, HCy-based probes are indeed more prone to reacting with GSH than NI-based ones, regardless of the specific receptor unit. These results demonstrated that a probe's reactivity is not only related to the receptor unit but also to the fluorophore. So, when regarding the reactivity, what causes the difference between HCy and NI? | (2) |
| k nonc (HCy-) | k nonc (NI-)b | R 1 | |
|---|---|---|---|
| a The knonc data for HCy10 were 0.002 ± 0.000 s−1 M−1 while for NI10 they were undetectable. The data for HCy1 and HCy5 were not determined because of their excessively fast reaction rates with GSH. The data for other HCy-based probes were undetectable. b The data were drawn from ref. 13. c R 1 = knonc (HCy-)/knonc (NI-), characterizing the enlargement factor of the reaction rate when replacing the fluorophore NI with a more hydrophilic and electrophilic one, HCy. The list was sorted based on the mean values of R1 from the highest to the lowest. | |||
| 2 | 1.189 ± 0.116 | 0.025 ± 0.002 | 48.2 ± 8.5 |
| 4 | 3.446 ± 0.153 | 0.256 ± 0.042 | 13.9 ± 2.8 |
| 3 | 5.737 ± 0.690 | 0.960 ± 0.160 | 6.3 ± 1.8 |
After careful consideration, one can realize two possible rational reasons. The first one is the higher hydrophilicity of HCy due to its net positive charge, which is conducive to encountering similarly hydrophilic GSH molecules. The second one is the higher electron-deficiency of HCy due to the same positive charge, which favors the nucleophilic attack of GSH on the electrophilic center via the electronic effect and maybe electrostatic attraction (GSH bearing negative charges) as well. To discern which one accounts for this phenomenon, several parameters based on rate constants knonc, octanol–water partition coefficients log![[thin space (1/6-em)]](https://www.rsc.org/images/entities/char_2009.gif) P and the local electrophilicity ωk, respectively, were defined and inspected. Therein, the log
P and the local electrophilicity ωk, respectively, were defined and inspected. Therein, the log![[thin space (1/6-em)]](https://www.rsc.org/images/entities/char_2009.gif) P values of HCy-based probes calculated with the well-known ALOGPS 2.1 program26–28 are truly smaller irrespective of the specific receptor unit, indicating their higher hydrophilicity (Table 2). However, if the hydrophilicity were responsible, when altering the receptor unit, the parameter R2, or rather, R3 (refer to deduction II in the ESI†), which characterize the enlargement factor of hydrophilicity when changing the fluorophore from NI to HCy, should keep pace with R1 which characterizes the enlargement factor of the reaction rate when changing the fluorophore from NI to HCy. And as shown in Tables 1 and 2, the sequence 2 > 4 > 3 in terms of R1 is completely opposite to the 3 > 4 > 2 in terms of R2 or R3, thus eliminating the possibility of hydrophilicity being the reason. The log
P values of HCy-based probes calculated with the well-known ALOGPS 2.1 program26–28 are truly smaller irrespective of the specific receptor unit, indicating their higher hydrophilicity (Table 2). However, if the hydrophilicity were responsible, when altering the receptor unit, the parameter R2, or rather, R3 (refer to deduction II in the ESI†), which characterize the enlargement factor of hydrophilicity when changing the fluorophore from NI to HCy, should keep pace with R1 which characterizes the enlargement factor of the reaction rate when changing the fluorophore from NI to HCy. And as shown in Tables 1 and 2, the sequence 2 > 4 > 3 in terms of R1 is completely opposite to the 3 > 4 > 2 in terms of R2 or R3, thus eliminating the possibility of hydrophilicity being the reason. The log![[thin space (1/6-em)]](https://www.rsc.org/images/entities/char_2009.gif) P values calculated with another widely-accepted program, XLOGP3,29 gave the same conclusion (Table S2†). What about the second reason, namely the electron-deficiency of the fluorophore? By a rough approximation and evaluation, the changes of ωk were examined. As indicated in Table 3, HCy-based probes showed larger local electrophilicity than NI-based ones despite the specific receptor unit, demonstrating their higher tendency to be attacked by the nucleophile GSH and thus higher reactivity, and their higher electron affinity consolidates this conclusion (Table S1†). Furthermore, the changes of the parameter R4, which characterizes the enlargement factor of ωk when changing the fluorophore from NI to HCy, are along the ascending order of ωk and in line with that of R1 (Tables 1 and 3), again manifesting that HCy's higher electron-deficiency brings about the probes' higher reactivity. And the fact that the more electrophilic (i.e. ωk) the receptor unit is, the less the enlargement factor of ωk (i.e. R4) or knonc (i.e. R1) is, could be interpreted and comprehended readily as follows. In a probe molecule, just as demonstrated above, either a more electrophilic receptor unit or a more electron-deficient fluorophore will induce its higher reactivity with GSH. Hence, when a probe is endowed with a more electrophilic receptor unit, the additional elecrtrophilic effect brought about by the introduction of a more electron-deficient fluorophore seems not that notable, sort of like the law of diminishing marginal utility in economics (refer to deduction III in the ESI† for a little more strict proof). Additionally, previous literature7 reported three probes for GSTs, DNs-AcRh, DNs-Coum and DNs-CV, adopting the same DN group as the receptor unit with different fluorophores (Fig. S7†). In that delicate work the authors proved the sequence of DNs-AcRh < DNs-CV < DNs-Coum in terms of hydrophilicity with a tactfully designed experiment calling for the surfactant Triton X-100. However, they didn't notice the sequence of DNs-AcRh > DNs-Coum > DNs-CV in terms of both knonc and kcat (Tables S3 and S4†), and neither did they address the reason therein. Actually, the information just mentioned could afford the rejection of hydrophilicity as the reason. Notably, as shown in Tables S3,† the calculated log
P values calculated with another widely-accepted program, XLOGP3,29 gave the same conclusion (Table S2†). What about the second reason, namely the electron-deficiency of the fluorophore? By a rough approximation and evaluation, the changes of ωk were examined. As indicated in Table 3, HCy-based probes showed larger local electrophilicity than NI-based ones despite the specific receptor unit, demonstrating their higher tendency to be attacked by the nucleophile GSH and thus higher reactivity, and their higher electron affinity consolidates this conclusion (Table S1†). Furthermore, the changes of the parameter R4, which characterizes the enlargement factor of ωk when changing the fluorophore from NI to HCy, are along the ascending order of ωk and in line with that of R1 (Tables 1 and 3), again manifesting that HCy's higher electron-deficiency brings about the probes' higher reactivity. And the fact that the more electrophilic (i.e. ωk) the receptor unit is, the less the enlargement factor of ωk (i.e. R4) or knonc (i.e. R1) is, could be interpreted and comprehended readily as follows. In a probe molecule, just as demonstrated above, either a more electrophilic receptor unit or a more electron-deficient fluorophore will induce its higher reactivity with GSH. Hence, when a probe is endowed with a more electrophilic receptor unit, the additional elecrtrophilic effect brought about by the introduction of a more electron-deficient fluorophore seems not that notable, sort of like the law of diminishing marginal utility in economics (refer to deduction III in the ESI† for a little more strict proof). Additionally, previous literature7 reported three probes for GSTs, DNs-AcRh, DNs-Coum and DNs-CV, adopting the same DN group as the receptor unit with different fluorophores (Fig. S7†). In that delicate work the authors proved the sequence of DNs-AcRh < DNs-CV < DNs-Coum in terms of hydrophilicity with a tactfully designed experiment calling for the surfactant Triton X-100. However, they didn't notice the sequence of DNs-AcRh > DNs-Coum > DNs-CV in terms of both knonc and kcat (Tables S3 and S4†), and neither did they address the reason therein. Actually, the information just mentioned could afford the rejection of hydrophilicity as the reason. Notably, as shown in Tables S3,† the calculated log![[thin space (1/6-em)]](https://www.rsc.org/images/entities/char_2009.gif) P values for these three probes with both ALOGPS 2.1 and XLOGP3 programs agree quite well with the reported experimental results, indicating the reliability of this calculation method. In addition, the sequence of DNs-AcRh > DNs-Coum > DNs-CV in terms of ωk is consistent with the one related to knonc or kcat (Tables S3, S4 and Fig. S8†). Taken together, all these results corroborate that it is not the higher hydrophilicity but the higher electron-deficiency of the fluorophore that makes the probe more reactive.
P values for these three probes with both ALOGPS 2.1 and XLOGP3 programs agree quite well with the reported experimental results, indicating the reliability of this calculation method. In addition, the sequence of DNs-AcRh > DNs-Coum > DNs-CV in terms of ωk is consistent with the one related to knonc or kcat (Tables S3, S4 and Fig. S8†). Taken together, all these results corroborate that it is not the higher hydrophilicity but the higher electron-deficiency of the fluorophore that makes the probe more reactive.
![[thin space (1/6-em)]](https://www.rsc.org/images/entities/char_2009.gif) P) for probes HCy2–4 and NI2–4 calculated with the ALOGPS 2.1 program26–28 and comparisons of hydrophilicity
P) for probes HCy2–4 and NI2–4 calculated with the ALOGPS 2.1 program26–28 and comparisons of hydrophilicity
log![[thin space (1/6-em)]](https://www.rsc.org/images/entities/char_2009.gif) P (NI-) P (NI-) |
log![[thin space (1/6-em)]](https://www.rsc.org/images/entities/char_2009.gif) P (HCy-) P (HCy-) |
R 2 | R 3 | |
|---|---|---|---|---|
a
R
2 = log![[thin space (1/6-em)]](https://www.rsc.org/images/entities/char_2009.gif) P (NI-)/log P (NI-)/log![[thin space (1/6-em)]](https://www.rsc.org/images/entities/char_2009.gif) P (HCy-).
b
R
3 = xw (HCy-)/xw (NI-) = (1 + P (NI-))/(1 + P (HCy-)), refer to deduction II in the ESI for more about the parameter xw. The list was sorted based on the values of R2 or R3 from the highest to the lowest. P (HCy-).
b
R
3 = xw (HCy-)/xw (NI-) = (1 + P (NI-))/(1 + P (HCy-)), refer to deduction II in the ESI for more about the parameter xw. The list was sorted based on the values of R2 or R3 from the highest to the lowest.
|
||||
| 3 | 2.82 | 2.00 | 1.41 | 2.25 |
| 4 | 3.22 | 2.46 | 1.31 | 2.13 |
| 2 | 3.61 | 3.01 | 1.20 | 1.82 |
Will kcat undergo a corresponding rise when replacing the fluorophore NI with HCy, just as in the case of knonc? To check this, a kinetic study on enzymatic reactions was executed (Tables S5–S7†), and the answer was found to be yes. For instance, regarding GSTA1-1, the kcat for NI2 and HCy2 are, respectively, 0.158 ± 0.009 and 0.408 ± 0.023 s−1, and for NI9 and HCy9 they are, respectively, 0.010 ± 0.001 and 0.099 ± 0.006 s−1.13 The larger enhancement factor of knonc than of kcat (e.g. for NI2 → HCy2, the corresponding numbers are 48.2 and 2.6, respectively) implies that the stronger enzymatic reactivity of HCy-based probes stems from their stronger nonenzymatic reactivity. Besides, the Km values of HCy-based probes are universally smaller than those of NI-based ones,13 indicating their stronger binding ability with GSTs. Consequently, the larger kcat and smaller Km make HCy-based probes more prone to recognizing and detecting GSTs to the extent that the catalytic efficiency kcat/Km of HCy9 for GSTA1-1 is 0.124 ± 0.021 s−1 μM−1, a value comparable to that of NI3 (0.103 ± 0.011 s−1 μM−1),13 the receptor unit of which is a more electrophilic one, implying HCy9's practical detection ability for GSTA in cells (vide infra). Another noteworthy result is that the susceptibility of knonc (6.44) towards ωk is still larger than that of kcat (0.72) (Fig. S9†), analogous to the case in NI-based probes,13 thus affording the space for selecting practical probes with both high sensitivity and low nonenzymatic background noise. Noticeably, HCy10 and HCy8 exhibited inappropriately low enzymatic reactivity (Fig. S9 and Table S5†), indicating the essential role the o-NO2 group plays in GST catalysis, in agreement with previous literature.7,13,30 An overall consideration of the sensitivity and background noise (Fig. S6†) showed HCy2 and HCy9 as the outstanding probes for potential practical applications in the following sections. This result overturns 4-cyano-2-nitro-benzenesulfonyl as the master key for all practical GST probes, although it was proved to be the most appropriate receptor unit for AcRh-based8 and NI-based13 probes.
Insight into the caging of autofluorescence of intact NIR probes
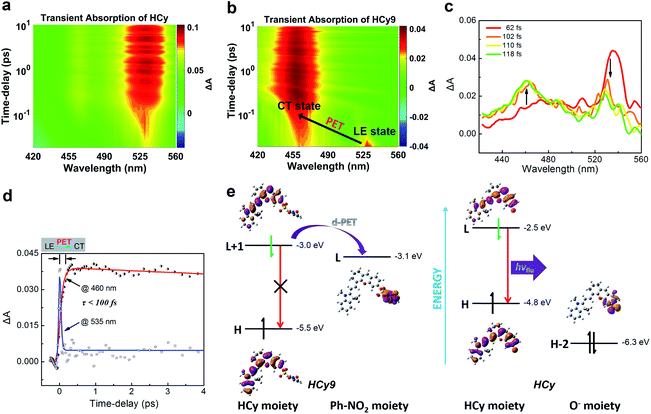
It should be noted that relative to non-NIR probes, NIR ones are generally more difficult to regulate via photoinduced electron transfer (PET) due to the relatively smaller excitation energy, which results in the failure to produce charge separation.31–36 In other words, NIR fluorophores usually have a lower LUMO and/or higher HOMO, and this will reduce the driving force (ΔGPET) of the PET process regardless of the donor-type (d-PET) or acceptor-type (a-PET) (Scheme S2†). This can be reflected by the stronger autofluorescence of HCy9 (refer to the black line in Fig. S3i† when t = 0) relative to NI9.13 Additionally, as an isomer of HCy10, HCy9 was found to exhibit obviously stronger autofluorescence than the former (cf. the black lines in Fig. S3i and j† when t = 0). Consequently, we examined if the quenching mechanism of HCy9 was still PET and explored the specific inherent reason for the above phenomena. For this purpose, with HCy as the control molecule, measurements of the femtosecond transient absorption (TA) spectra and calculations of electronic transitions based on time-dependent density functional theory (TD-DFT) were performed. Upon excitation using a laser at 630 nm, a distinct transient absorption band of HCy centered at ca. 535 nm appeared instantly (<100 fs; Fig. 3a), which should be attributed to the locally excited (LE) state. This state could last for more than 10 ps (Fig. 3a). As for HCy9, the same excited-state absorption (ESA) signal centered at ca. 535 nm was observed in the first 60 fs upon excitation at 630 nm (Fig. 3b, d and S10†). However, in the next 60 fs, the band at 535 nm disappeared gradually, accompanied by the formation of a brand-new one centered at ca. 460 nm (Fig. 3b–d), indicating the generation of a new state. The time scales obtained by fitting the data at 535 and 460 nm, respectively, are comparable (<100 fs), suggesting that the new state is derived from the LE state. In TD-DFT calculations, regarding HCy9, the oscillator strength f of the transition S0 → S1 is quite small (0.007) (Table S8†), indicating that the S1 state can be hardly formed directly from the ground state S0 upon excitation. Instead, the S1 state may be derived from a higher state S2 (Kasha's rule), which can be populated directly from the S0 state upon excitation since the f of the corresponding transition is considerable (1.274). Noticeably, the S0 → S2 transition corresponds to HOMO → LUMO+1 (Table S8†), and both molecular orbitals locate on the HCy moiety (Fig. 3e, left), demonstrating that the S2 state is the LE state. Meanwhile, the S0 → S1 transition corresponds to HOMO → LUMO (Table S8†), and the LUMO locates on the receptor unit moiety, demonstrating that the S1 state is the charge-transfer (CT) state. Hence, the transformation from S2 to S1 is essentially the PET process, and the new state generated in the second 60 fs corresponds to the CT state (Fig. 3b–d). As a comparison, the lowest excited state S1 of HCy can be populated directly from the S0 state (f = 1.124) (Table S8†), and the corresponding HOMO and LUMO both locate in the same region (Fig. 3e, right), indicating that the S1 state is the LE state, from which the fluorescence can be emitted unimpededly. Incidentally, to our knowledge, this is the first time that the real PET process of a NIR fluorescent probe has been captured experimentally. In brief, the quenching mechanism of HCy9 is still PET, and the lower quenching efficiency relative to that of NI9 is presumably due to the reduced driving force (0.1 eV in Fig. 3evs. 0.4 eV for NI9)13 arising from the lower LUMO of the NIR fluorophore (−3.0 eV vs. −2.7 eV).13 And the higher quenching efficiency of HCy10 relative to HCy9 is probably related to the lower LUMO of the quencher moiety (i.e. the receptor unit) (−3.1 eV in Fig. 3evs. −3.3 eV for HCy10 in Fig. S11 and Table S8†), recovering the driving force from 0.1 eV in HCy9 to 0.3 eV in HCy10, which is close to the 0.4 eV in NI9. This is in line with HCy10's higher ωk (Table S1†), which means that the properties (e.g. reactivity) of the receptor unit can also affect the probe's fluorescence behavior.Assessment of applications of HCy-based probes in cells, tissues and tumors in vivo
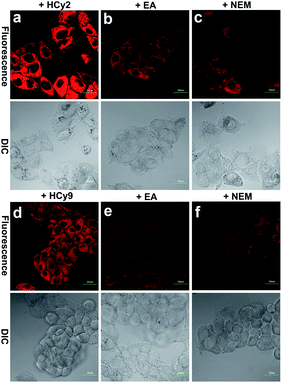
Since HepG2 cells are rich in GSTA1-1, as demonstrated by western blotting analysis in the literature,13 10 μM HCy2 or HCy9 in HEPES buffer (20 mM, 0.25% DMSO, 5% glucose, pH 7.4) was used to incubate HepG2 cells, after which fluorescence images were captured. As shown in Fig. S12, S13 and Video in the ESI,† in both cases, the cells could be lit up gradually in 30 min. To examine if the fluorescence resulted from GST activity, HepG2 cells were pretreated with the GST inhibitor EA or the GSH-depleting agent N-ethylmaleimide (NEM), respectively. For either HCy2 or HCy9, both EA and NEM could induce an obvious fluorescence loss (Fig. 4), verifying their capability for detecting GST activity in living cells. By contrast, for HCy1 and HCy3–5, hardly any fluorescence decrease was observed when HepG2 cells were preincubated with EA (Fig. S14†), ruling out their qualification as probes for GST activity, which is in line with in vitro results (Fig. S6b†). Subsequently, a colocalization analysis demonstrated that the produced fluorescent dye HCy tended to accumulate in the lysosomes probably due to its charge characteristics (Fig. S15–18†),37 in agreement with the results in the literature.37–39Although HCy2 and HCy9 were both amenable to cellular imaging for GST activity, they were found to differ obviously in sensitivity during the imaging process. As investigated by both fluorescence imaging and flow cytometry, HCy2 was more sensitive to GST than HCy9 under the same conditions (Fig. S19a, b and d†), in agreement with their kcat values (Table S5†). This can be unquestionably attributed to their difference in ωk (Table S1†). Nonetheless, as discussed previously, in addition to ωk, the o-NO2 group is essential for GST catalysis as well, which was also confirmed by comparing the performances of HCy9 and HCy10 in cell samples (Fig. S19b–d†). It is worthwhile to mention that the ωk of HCy10 is larger than that of HCy9 (Table S1;† recall that the knonc of HCy10 can be determined while the data for HCy9 were undetectable; see also Fig. S3i and j†). And this result demonstrates indirectly that the fluorescence in HCy9-incubated HepG2 cells was not induced by GSH alone but by GST activity.
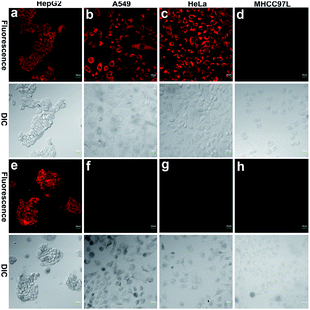
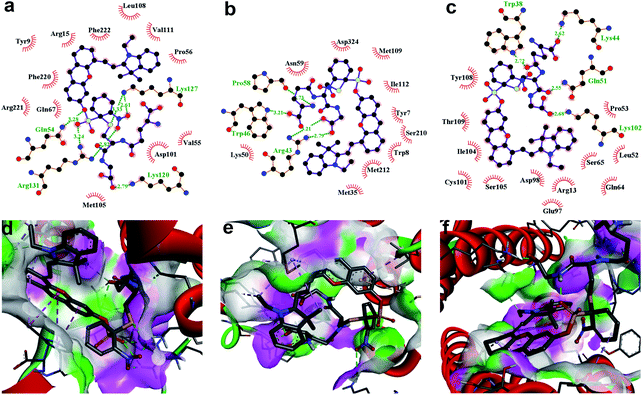
To further demonstrate that both HCy9 and HCy2 are GST-activity-specific, another three cell lines besides HepG2 were employed, namely A549, HeLa and MHCC97L, according to the western blotting results in the literature.13 Therein, A549 cells are rich in GSTP1-1 with a tiny amount of GSTA1-1 contained, and HeLa cells are rich in GSTM1-1 and GSTP1-1. By contrast, MHCC97L cells contain no GSTA1-1, GSTM1-1 or GSTP1-1. As shown in Fig. 5d and h, MHCC97L cells incubated with HCy2 or HCy9 exhibited little fluorescence, indicating the probes' specificity for GSTs. Interestingly, both A549 and HeLa cells incubated with HCy2 displayed bright fluorescence while rather dim fluorescence was observed when HCy9 was used for incubation (Fig. 5b, c, f and g). Taking the specific GST isoenzymes contained in HepG2, A549 or HeLa into account, these results are consistent with the kcat values of HCy2 and HCy9 towards different GST isoenzymes (Tables S5–S7†). In other words, HCy2 has broad isoenzyme selectivity whereas HCy9 shows specificity for GSTA1-1. To address this issue, docking simulations of the σ complex30,40–42 (i.e. Meisenheimer complex) for HCy9 or HCy2 into these three GST isoenzymes were implemented. For the GS-HCy9 σ complex, in regard to GSTA1-1, abundant H-bonds are formed between residues in the active-site and the receptor unit moiety of HCy9 (Fig. 6a). And in particular, two H-bonds are centered on the o-NO2 group, which is highly favorable for lowering the activation energy barrier by stabilizing the σ complex and thus facilitates GST catalysis. In contrast, as regards GSTM1-1 and GSTP1-1, all the H-bonds are centered on the GSH moiety (Fig. 6b and c). These results were based on well-known Ligplot+ analysis.43 And another notable piece of analysis software, DS Visualizer, gave a similar result (Fig. S20†). In addition, as can also be reflected in 3D visualization, the colored section of H-bond surfaces is focused on the receptor unit moiety for GSTA1-1 whereas for GSTM1-1 and GSTP1-1, they are scarcely located on this moiety (Fig. 6d–f). As for the GS-HCy2 σ complex, there exist H-bonds between the receptor unit moiety and residues in the active-sites of all three isoenzymes (Fig. S21†). Although relative to the number of “effective” H-bonds for the GS-HCy9 σ complex in GSTA1-1, the ones for the GS-HCy2 σ complex in all three isoenzymes appear fewer; this makes sense since the activation energy barrier for HCy2 is lower, and a smaller number of “effective” H-bonds could suffice for the catalysis process. The lower activation energy barrier arises from the higher ωk. Therefore, to some extent we can say that the difference in reactivities of HCy2 and HCy9 leads to their different behaviors in isoenzyme selectivity, in agreement with the conclusion in previous literature.7
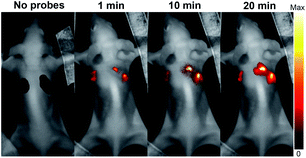
It is often desirable that probes could afford deeper imaging in practical applications. Herein, as a NIR fluorescent probe, HCy2 proved to be competent to detect GSTs at a depth of 50 μm in liver and lung tissues (Fig. S22†), which, respectively, contain abundant GSTA or GSTP isoenzymes.44,45 Actually, the NIR characteristics make HCy2 behave well even at a depth deeper than 50 μm so that fluorescence images at various depths could afford a 3D reconstruction of the tissue sections (Fig. S23 and S24†). The outstanding performances of HCy2 inspired us to inspect if these NIR probes could be applied for in vivo fluorescence imaging. Hence, HCy2 and HCy9 were then subjected to monitoring of GST activity in HepG2 tumor xenografts embedded in nude mice. As shown in Fig. S25,† while the left control tumor displayed faint fluorescence, the right tumor turned brighter gradually in 20 min after injection with HCy9, demonstrating that even this less sensitive probe relative to HCy2 was able to realize GST detection in vivo in real time. And undoubtedly, with respect to HCy9, herein HCy2 is also more sensitive to GST (Fig. 7), similar to the results observed in cells (Fig. S19†). To sum up, the NIR properties endow the probes screened in this work with competence for deep imaging.
Conclusions
In summary, high-performance NIR fluorescent probes for GSTs have been developed in this work, and we have found that the reactivity (both nonenzymatic and enzymatic) of a probe is related to both the receptor unit and the fluorophore. Specifically, the higher the electron-deficiency of the fluorophore is, the more prone to reacting with GSH the probe is, which makes HCy-based probes universally more sensitive to GSH and GST activity than NI-based ones. On the other hand, the difference in the receptor unit between HCy2 and HCy9 results in their different reactivities and thus distinct isoenzyme selectivities. By virtue of the high brightness and NIR character of HCy, HCy2 and HCy9 have been proven to be competent to detect GST in a variety of biological samples including cells, tissues and tumors in vivo. Additionally, although NIR fluorophores are generally difficult to quench via PET, the quenching mechanism of HCy-based probes herein has been demonstrated to be PET experimentally and theoretically. Besides, the fluorescence behavior of a probe has also been found to be connected with both the fluorophore and the receptor unit. That is to say, although the properties of a probe can be artificially divided into two parts according to eqn (1), namely the photoluminescence mechanism and the recognition or reaction mechanism, the probe should be treated as an entirety. These results will provide a distinct framework for designing more practical NIR fluorescent probes for GSTs in the future.Conflicts of interest
There are no conflicts to declare.Acknowledgements
All animal experiment procedures were performed according to the protocols approved by the Animal Ethics and Use Committee of Dalian Medical University. This paper is dedicated to the 70th anniversary of the Dalian Institute of Chemical Physics, Chinese Academy of Sciences. This research was supported in part by the National Natural Science Foundation of China (grant no. 21533010, 2183309, 21673237, 81672440, 21907093, and 21503224) and the National Key Research and Development Program of China (grant 2017YFA0204800). The authors thank Pramod Pandey and Qi-Chao Yao for their selfless help.Notes and references
- J. D. Hayes and D. J. Pulford, Crit. Rev. Biochem. Mol. Biol., 1995, 30, 445–600 Search PubMed.
- A. Bennaceur-Griscelli, J. Bosq, S. Koscielny, F. Lefrere, A. Turhan, N. Brousse, O. Hermine and V. Ribrag, Clin. Cancer Res., 2004, 10, 3029–3034 Search PubMed.
- M. A. Harkey, M. Czerwinski, J. Slattery and H. P. Kiem, Cancer Invest., 2005, 23, 19–25 Search PubMed.
- J. D. Hayes, J. U. Flanagan and I. R. Jowsey, Annu. Rev. Pharmacol. Toxicol., 2005, 45, 51–88 Search PubMed.
- C. C. McIlwain, D. M. Townsend and K. D. Tew, Oncogene, 2006, 25, 1639–1648 Search PubMed.
- Y. Fujikawa, Y. Urano, T. Komatsu, K. Hanaoka, H. Kojima, T. Terai, H. Inoue and T. Nagano, J. Am. Chem. Soc., 2008, 130, 14533–14543 Search PubMed.
- J. Zhang, A. Shibata, M. Ito, S. Shuto, Y. Ito, B. Mannervik, H. Abe and R. Morgenstern, J. Am. Chem. Soc., 2011, 133, 14109–14119 Search PubMed.
- A. Shibata, Y. Nakano, M. Ito, M. Araki, J. Zhang, Y. Yoshida, S. Shuto, B. Mannervik, R. Morgenstern, Y. Ito and H. Abe, Analyst, 2013, 138, 7326–7330 Search PubMed.
- Y. Fujikawa, F. Morisaki, A. Ogura, K. Morohashi, S. Enya, R. Niwa, S. Goto, H. Kojima, T. Okabe, T. Nagano and H. Inoue, Chem. Commun., 2015, 51, 11459–11462 Search PubMed.
- L. Qin, X. W. He, L. X. Chen and Y. K. Zhang, ACS Appl. Mater. Interfaces, 2015, 7, 5965–5971 Search PubMed.
- L. Unger-Angel, B. Rout, T. Ilani, M. Eisenstein, L. Motiei and D. Margulies, Chem. Sci., 2015, 6, 5419–5425 Search PubMed.
- J. Zhang, Z. Jin, X. X. Hu, H. M. Meng, J. Li, X. B. Zhang, H. W. Liu, T. Deng, S. Yao and L. Feng, Anal. Chem., 2017, 89, 8097–8103 Search PubMed.
- X. X. Zhang, H. Qi, M. H. Lu, S. Q. Yang, P. Li, H. L. Piao and K. L. Han, Research, 2020, 2020, 7043124 Search PubMed.
- A. N. Bashkatov, E. A. Genina, V. I. Kochubey and V. V. Tuchin, J. Phys. D: Appl. Phys., 2005, 38, 2543–2555 Search PubMed.
- J. R. Johnson, N. Fu, E. Arunkumar, W. M. Leevy, S. T. Gammon, D. Piwnica-Worms and B. D. Smith, Angew. Chem., Int. Ed., 2007, 46, 5528–5531 Search PubMed.
- L. Yuan, W. Lin, Y. Yang and H. Chen, J. Am. Chem. Soc., 2012, 134, 1200–1211 Search PubMed.
- W. Zhang, F. Huo, F. Cheng and C. Yin, J. Am. Chem. Soc., 2020, 142, 6324–6331 Search PubMed.
- W. Zhang, F. Huo, Y. Yue, Y. Zhang, J. Chao, F. Cheng and C. Yin, J. Am. Chem. Soc., 2020, 142, 3262–3268 Search PubMed.
- Y. Yang, T. Zhou, M. Jin, K. Zhou, D. Liu, X. Li, F. Huo, W. Li and C. Yin, J. Am. Chem. Soc., 2020, 142, 1614–1620 Search PubMed.
- L. Yuan, W. Lin, S. Zhao, W. Gao, B. Chen, L. He and S. Zhu, J. Am. Chem. Soc., 2012, 134, 13510–13523 Search PubMed.
- J. Ning, T. Liu, P. Dong, W. Wang, G. Ge, B. Wang, Z. Yu, L. Shi, X. Tian, X. Huo, L. Feng, C. Wang, C. Sun, J. N. Cui, T. D. James and X. Ma, J. Am. Chem. Soc., 2019, 141, 1126–1134 Search PubMed.
- R. G. Parr, L. Von Szentpaly and S. B. Liu, J. Am. Chem. Soc., 1999, 121, 1922–1924 Search PubMed.
- L. R. Domingo, P. Perez and J. A. Saez, RSC Adv., 2013, 3, 1486–1494 Search PubMed.
- J. H. T. M. Ploemen, B. Vanommen, J. J. P. Bogaards and P. J. Vanbladeren, Xenobiotica, 1993, 23, 913–923 Search PubMed.
- X. X. Zhang, H. Wu, P. Li, Z. J. Qu, M. Q. Tan and K. L. Han, Chem. Commun., 2016, 52, 8283–8286 Search PubMed.
- I. V. Tetko, J. Gasteiger, R. Todeschini, A. Mauri, D. Livingstone, P. Ertl, V. A. Palyulin, E. V. Radchenko, N. S. Zefirov, A. S. Makarenko, V. Y. Tanchuk and V. V. Prokopenko, J. Comput.-Aided Mol. Des., 2005, 19, 453–463 Search PubMed.
- VCCLAB, Virtual Computational Chemistry Laboratory, 2005, http://www.vcclab.org.
- M. Kamiya, D. Asanuma, E. Kuranaga, A. Takeishi, M. Sakabe, M. Miura, T. Nagano and Y. Urano, J. Am. Chem. Soc., 2011, 133, 12960–12963 Search PubMed.
- T. Cheng, Y. Zhao, X. Li, F. Lin, Y. Xu, X. Zhang, Y. Li, R. Wang and L. Lai, J. Chem. Inf. Model., 2007, 47, 2140–2148 Search PubMed , http://www.sioc-ccbg.ac.cn/?p=42%26software=xlogp3.
- R. N. Armstrong, Chem. Res. Toxicol., 1997, 10, 2–18 Search PubMed.
- T. Egawa, K. Hanaoka, Y. Koide, S. Ujita, N. Takahashi, Y. Ikegaya, N. Matsuki, T. Terai, T. Ueno, T. Komatsu and T. Nagano, J. Am. Chem. Soc., 2011, 133, 14157–14159 Search PubMed.
- Y. Koide, Y. Urano, K. Hanaoka, T. Terai and T. Nagano, ACS Chem. Biol., 2011, 6, 600–608 Search PubMed.
- E. Sasaki, H. Kojima, H. Nishimatsu, Y. Urano, K. Kikuchi, Y. Hirata and T. Nagano, J. Am. Chem. Soc., 2005, 127, 3684–3685 Search PubMed.
- B. Ozmen and E. U. Akkaya, Tetrahedron Lett., 2000, 41, 9185–9188 Search PubMed.
- K. Kiyose, S. Aizawa, E. Sasaki, H. Kojima, K. Hanaoka, T. Terai, Y. Urano and T. Nagano, Chem.–Eur. J., 2009, 15, 9191–9200 Search PubMed.
- A. Sanchez-Galvez, P. Hunt, M. A. Robb, M. Olivucci, T. Vreven and H. B. Schlegel, J. Am. Chem. Soc., 2000, 122, 2911–2924 Search PubMed.
- B. L. Wang, C. Jiang, K. Li, Y. H. Liu, Y. Xie and X. Q. Yu, Analyst, 2015, 140, 4608–4615 Search PubMed.
- Z. Luo, L. Feng, R. An, G. Duan, R. Yan, H. Shi, J. He, Z. Zhou, C. Ji, H. Y. Chen and D. Ye, Chemistry, 2017, 23, 14778–14785 Search PubMed.
- Y. Urano, M. Sakabe, N. Kosaka, M. Ogawa, M. Mitsunaga, D. Asanuma, M. Kamiya, M. R. Young, T. Nagano, P. L. Choyke and H. Kobayashi, Sci. Transl. Med., 2011, 3, 110ra119 Search PubMed.
- X. Ji, R. N. Armstrong and G. L. Gilliland, Biochemistry, 1993, 32, 12949–12954 Search PubMed.
- A. S. Johansson, G. Stenberg, M. Widersten and B. Mannervik, J. Mol. Biol., 1998, 278, 687–698 Search PubMed.
- L. Prade, R. Huber, T. H. Manoharan, W. E. Fahl and W. Reuter, Structure, 1997, 5, 1287–1295 Search PubMed.
- R. A. Laskowski and M. B. Swindells, J. Chem. Inf. Model., 2011, 51, 2778–2786 Search PubMed.
- J. Hansson, K. Berhane, V. M. Castro, U. Jungnelius, B. Mannervik and U. Ringborg, Cancer Res., 1991, 51, 94–98 Search PubMed.
- J. A. Moscow, C. R. Fairchild, M. J. Madden, D. T. Ransom, H. S. Wieand, E. E. O'Brien, D. G. Poplack, J. Cossman, C. E. Myers and K. H. Cowan, Cancer Res., 1989, 49, 1422–1428 Search PubMed.
Footnotes |
| † Electronic supplementary information (ESI) available: Detailed experimental and computational methods, characterization, fluorescence imaging video and supplementary figures and tables. See DOI: 10.1039/d0sc04411c |
| ‡ These authors contributed equally. |
| This journal is © The Royal Society of Chemistry 2020 |

