 Open Access Article
Creative Commons Attribution 3.0 Unported Licence
Correction: Novel near-infrared II aggregation-induced emission dots for in vivo bioimaging
Jiacheng
Lin
ab,
Xiaodong
Zeng
ab,
Yuling
Xiao
ab,
Lin
Tang
a,
Jinxia
Nong
a,
Yufang
Liu
a,
Hui
Zhou
ab,
Bingbing
Ding
a,
Fuchun
Xu
c,
Hanxing
Tong
d,
Zixin
Deng
a and
Xuechuan
Hong
*abc
aState Key Laboratory of Virology, Key Laboratory of Combinatorial Biosynthesis and Drug Discovery (MOE), Hubei Provincial Key Laboratory of Developmentally Originated Disease, Wuhan University School of Pharmaceutical Sciences, Wuhan 430071, China. E-mail: xhy78@whu.edu.cn
bShenzhen Institute of Wuhan University, Shenzhen, 518057, China
cInnovation Center for Traditional Tibetan Medicine Modernization and Quality Control, Medical College, Tibet University, Lhasa, 850000, China
dDepartment of General Surgery, Zhongshan Hospital, Fudan University, Shanghai, 200032, China
First published on 2nd April 2020
Abstract
Correction for ‘Novel near-infrared II aggregation-induced emission dots for in vivo bioimaging’ by Jiacheng Lin et al., Chem. Sci., 2019, 10, 1219–1226.
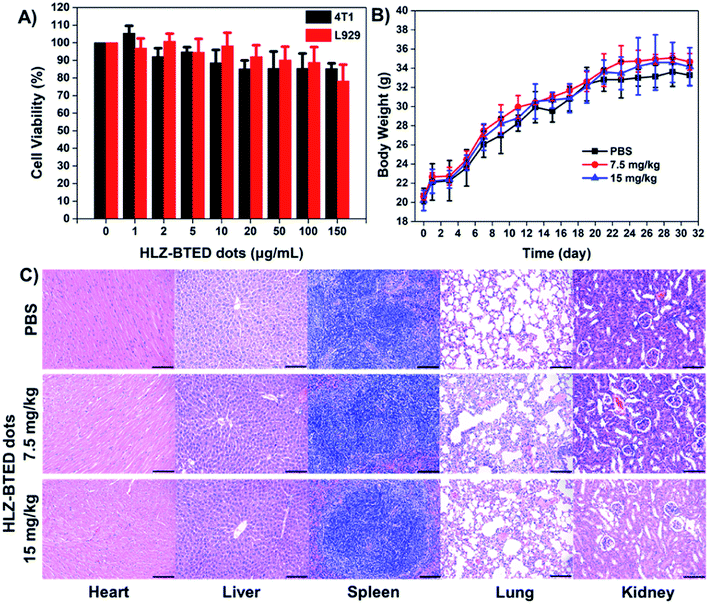
The authors apologize for the unintentional error in Fig. 4 in the manuscript. During the figure assembly process, we made a mistake in the hematoxylin and eosin (H&E) stained images of liver in the PBS control and 7.5 mg kg−1HLZ-BTED dots treatment groups in Fig. 4C. The H&E image of liver in 7.5 mg kg−1HLZ-BTED dots treatment group was accidentally used for both the PBS control and 7.5 mg kg−1HLZ-BTED dots treatment groups. This error does not affect the conclusions of this work. The correct H&E images in Fig. 4 should be as follows.
The Royal Society of Chemistry apologises for these errors and any consequent inconvenience to authors and readers.
| This journal is © The Royal Society of Chemistry 2020 |

