MoC based Mott–Schottky electrocatalyst for boosting the hydrogen evolution reaction performance†
Xinyang
Ji‡
a,
Kaixuan
Wang‡
a,
Yao
Zhang
c,
Haohao
Sun
d,
Yuanyuan
Zhang
a,
Tiange
Ma
a,
Zhuo
Ma
*c,
PingAn
Hu
 b and
Yunfeng
Qiu
 *ab
*ab
aSchool of Chemistry and Chemical Engineering, Harbin Institute of Technology, No. 92 West Dazhi Street, Nan Gang District, Harbin, 150001, People's Republic of China. E-mail: qiuyf@hit.edu.cn; Fax: + 86 451 86403583; Tel: +86 451 86403583
bKey Laboratory of Micro-systems and Micro-structures Manufacturing, Harbin Institute of Technology, No. 2 Yikuang Street, Nan Gang District, Harbin 150080, People's Republic of China
cSchool of Life Science and Technology, Harbin Institute of Technology, No. 92 West Dazhi Street, Nan Gang District, Harbin, 150001, People's Republic of China. E-mail: zhuoma@hit.edu.cn; Fax: +86 451 86403165; Tel: +86 451 86403165
dCollege of Pharmacy, Jiamusi University, No. 258 Xuefu Street, Jiamusi, 154007, People's Republic of China
First published on 6th November 2019
Abstract
Searching for promising HER electrocatalysts is an urgent task for the practical application of hydrogen production by water electrolysis. The Mott–Schottky effect between a metal with larger work function and n-type semiconductor with a higher Fermi level will facilitate the electron transfer from the semiconductor toward the metal. As a result, it is possible to design optimal H* adsorption active sites with thermoneutral hydrogen adsorption free energy (ΔGH*). Herein, MoC nanoparticles with a diameter of about 3.4 nm embedded in N, P-codoped carbon were converted from well-defined polyoxometalates (around 1 nm) and polypyrrole nanocomposites by carbonization and further wrapped on the surface of CNTs. On the basis of improved electron transfer rate, increased carrier densities, and enhanced active site activities on MoC after lowering the work function due to the Mott–Schottky effect with n-type domains in N, P-codoped carbon, our electrocatalysts could drive the current density of 10 mA cm−2 at 175 mV with a Tafel slope of 62 mV dec−1 and TOF value of 1.49 s−1 at 150 mV, as well as long-term H2 production stability. The present study provides a new guideline for the design and preparation of Mott–Schottky HER electrocatalysts.
Introduction
With the increasing energy crisis and environment contaminations, it is urgent to develop renewable energy to replace the fossil fuel energy.1–13 Hydrogen energy is regarded as attractive renewable energy due to its superior advantages, including tandem production ways from solar energy and clean combustion products.14 In particular, a hydrogen energy vehicle has been announced in the 13th Five-Year Plan of Chinese National Strategic Emerging Industries Development and will continue to develop in the coming 14th Five-Year Plan.15 Water electrolysis is one of the most promising ways for hydrogen production, in which the electrocatalytic hydrogen evolution reaction is an important half-reaction.16–19 Basically, noble metal-based electrocatalysts including Pt nanocrystals, Pt-based alloys, and conductive substrate-supported Pt composites were widely used as a benchmark for HER electrocatalysts.20,21 However, the substantial application of noble metal-based electrocatalysts are greatly hindered due to their high cost, scarcity, poor resistance to poisons (methanol or CO), unsatisfactory long-term stability, and so on. Thus, tremendous efforts have been made to develop the non-noble metal based HER electrocatalysts as substitutes to replace Pt-based electrocatalysts.11,12,22–24Very recently, a series of state-of-the-art electrocatalysts have been prepared for HER, such as carbonaceous nanomaterials, metal phosphides, dichalcogenides, alloys, nitrides, carbides, as well as binary or ternary metal nanocomposites.25–30 Basically, the HER process in acidic solution contains two steps.31 The first step is regarded as the Volmer-reaction with a Tafel slope of 118 mV dec−1, in which the H3O+ was electrochemically reduced to form H* atoms on active sites (* represents active site). The second step was the Heyrovsky-reaction with a Tafel slope of 40 mV dec−1, in which the ion and atom reaction occurred. Alternatively, the second step also proceeded through a Tafel-reaction with a Tafel slope of 30 mV dec−1, in which two adjacent H* were combined to form one H2 molecule. Optimal electrocatalysts should have appropriate H* adsorption free energy (ΔGH*) according to the Sabatier principle, neither too strong nor too weak. To this end, the rational design of electrocatalysts was a great challenge for obtaining high HER performance. Among all the developed HER electrocatalysts, molybdenum carbides have attracted tremendous attention due to the various valence states of Mo, well-defined nanostructures, tunable phases and compositions, and metallic conductivity.32–34 It is assumed that ΔGH* on active sites can be modulated by adjusting the above features. For instance, β-Mo2C has a similar valence band shape to Pt, demonstrating more Pt-like Fermi level for better HER performance in comparison to the other molybdenum carbides.35 So far, various Mo2C, Mo2C/conductive support hybrid electrocatalysts have been developed to expose more active sites, improve the conductivity, or optimize the ΔGH*. Among all reported Mo sources, polyoxometalates (POMs) are early transition-metal oxygen anionic clusters with a nanosized structure. For instance, the Keggin type H3PMo12O40 cluster with a diameter of about 1 nm could serve as both Mo and P sources simultaneously for the synthesis of P-doped molybdenum carbides, displaying improved HER activities.36,37
On the basis of vast experimental and theoretical studies, it is found that the electron density around the Fermi level of MoC was too low, resulting in a poor Volmer reaction step for HER. The Mo3+/Mo2+ ratio was as high as 10.9 in MoC; thus, Mo3+ with low electron density was unable to donate sufficient electrons to H*.38 To this end, transition metal ion doping, crystalline phase control, composition modulation, etc. for molybdenum carbides were successfully used to modulate the bond strength of Mo–H for optimal ΔGH* to boost the HER performance.39–41 In addition, according to solid-state physics, there is the Mott–Schottky effect between the metallic molybdenum carbides and n-type carbon supports, due to which the electron state of Mo will be modulated.42,43 To this end, the rational design of molybdenum carbides with controllable composition, good dispersion in a carbon matrix, and hierarchical nanostructure is thought to be a promising yet challenging task for high HER performance.
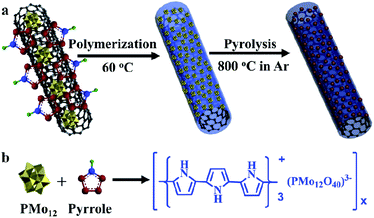
Herein, this work reported a strategy to obtain MoC based Mott–Schottky HER electrocatalysts. In theory, metallic MoC has a lower Fermi level in comparison to N, P-codoped carbon (around 4.5 eV);44,45 thus, electrons will transfer from carbon to MoC. As a result, the electron density of MoC was increased, and the Fermi level became higher after equilibrium. Accordingly, the reduction of adsorbed H3O+ will become favorable on active sites. Polyoxometalates were used to polymerize pyrrole in the presence of CNTs as shown in Scheme 1; then, the core–shell precursors were facilely prepared, and were subjected to calcination. About 3.4 nm MoC nanoparticles were well dispersed in N, P-codoped carbon, which wrapped the CNTs' inner core. The pyrrole amounts and annealing temperatures were systematically exploited to optimize the HER performance. Meanwhile, the Mott–Schottky mechanism was disclosed in detail.
Experimental
Materials and methods
The Keggin-type PMo12 was purchased from Macklin Ltd, and pyrrole was purchased from Aladdin Ltd. The above two reagents were used as received without further treatment. Carbon nanotubes (CNTs) were purchased from Nanjing XFnano Ltd.Characterizations
Scanning electron microscopy (SEM) and energy-dispersive X-ray spectrometry (EDS) analysis were conducted using a Hitachi SU8010 scanning electron microscope to study the morphology and elemental distribution of the catalyst. Transmission electron microscopy (TEM) and high-resolution TEM (HRTEM) were performed on a field-emission TEM (TecnaiG2F30, FEI, US). X-ray photoelectron spectroscopy (XPS) was carried out with an X-ray photoelectron spectrometer [Thermo Scientific K-Alpha XPS, using Al (Kα) radiation as a probe] to get information about the valence state of the surface element. X-ray diffraction (XRD) patterns were characterized on a Diffractometer-6000 with Cu Kα radiation (λ = 0.1542 nm) in the range from 5 to 90° (2θ) to identify material species. Raman spectra were recorded on a confocal microscope-based Raman spectrometer (LabRAM XploRA; incident power = 1 mW; pumping wavelength = 532 nm). Conventional Brunauer–Emmett–Teller (BET) was used to determine the material surface area.Electrochemical tests were conducted on a CHI760E electrochemical workstation (CH Instrument, China). The HER tests were carried out in a typical three-electrode system with GCE as the working electrode, Ag/AgCl (saturated KCl solution), and graphite rod as the reference and counter electrodes, respectively. The HER experiments were performed in N2-saturated 0.5 M H2SO4 (bubbled by N2 for 30 min). The polarization curves were obtained in the potential range from −0.2 to −0.5 V versus Ag/AgCl at room temperature with a scan rate of 5 mV s−1. All the polarization curves were obtained after several CV cycles for initial equilibrium. The electrochemical double-layer capacitance (Cdl) was calculated by using the CV curves, which were measured at a scan rate of 10, 20, 40, 60, 80, 100, 120 and 150 mV s−1 in a non-faradaic potential region from 0.17 to 0.27 V versus RHE. Electrochemical impedance spectroscopy (EIS) was performed from 0.1 to 105 Hz at a potential when the current density reaches 10 mA cm−2 with an amplitude of 10 mV. The durability test was evaluated by LSV after 1000 cycles of CV scans at a scan rate of 50 mV s−1 in the range of −0.2 to 0.1 V versus RHE in 0.5 M H2SO4. Stability tests were performed by chronopotentiometry at a current density of 10 mA cm−2 in 0.5 M H2SO4.
Turn over frequency (TOF) values were determined according to the following eqn (1):46
| TOF = j/2nF | (1) |
Results and discussion
Synthesis and characterizations
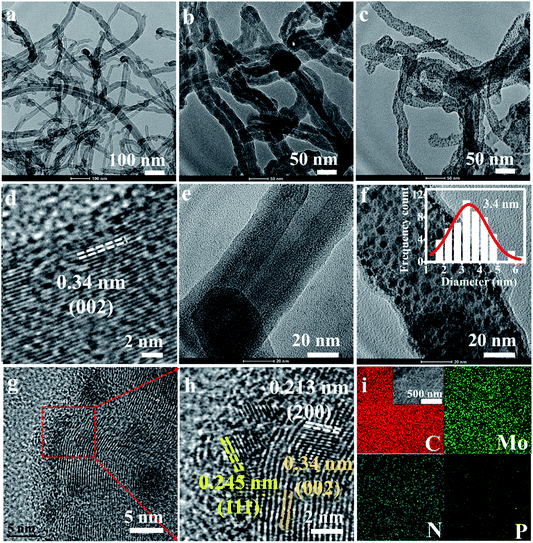
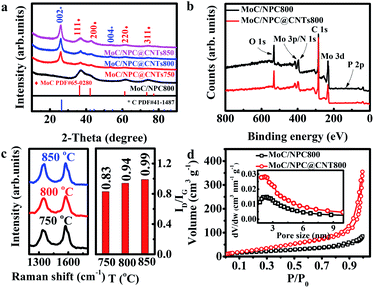
Commercial CNTs were first treated by H2SO4/HNO3 (volume ratio: 1/3) mixing acid solution at 80 °C for 3 h. Surface oxidation of CNTs would result in abundant carboxylic acid groups, which favored the subsequent anchoring of polymer, while the carbon layer packing with an interlayer distance of 0.34 nm was well maintained as seen in Fig. 1a and d.47 PMo12 possessed superior oxidation ability, and was able to polymerize pyrrole at 60 °C to form a polymer layer on the outer surface of the CNTs, which has been modified with abundant anchoring sites.37,48 It was seen that PMo12 (around 1 nm) nanoclusters were well distributed in the polypyrrole matrix in Fig. 1b and e; no aggregation was observed. After carbonization at 800 °C for 1 h, PMo12 precursors were transformed into nanoparticles with an average diameter of 3.4 nm, as shown in Fig. 1c and f. The HRTEM image in Fig. 1g demonstrated that nanocrystals were tightly bounded on the surface of the CNTs. And interlayer distances of 0.245 nm and 0.213 nm were ascribed to the crystalline facets of (111) and (200) for MoC as shown in Fig. 1h. Meanwhile, nanocrystals were covered by an ultrathin layer of carbon sheets derived from polypyrrole. Those carbon layers were severely curved, and there might exist polarized carbon at the exposed sheet edges. Inspired from previous work, defective graphene edges containing pentagons possessed a desired hydrogen binding energy and would contribute to improving the HER performance.49 The uniform distribution of C, Mo, N, and P elements was well verified by the EDS mapping analysis in Fig. 1i. To check the annealing temperature effect on the morphologies, precursors were also carbonized at 750 and 850 °C. As seen by the SEM images, in Fig. S2,† the CNTs were evenly covered by a thin layer. Irregular nanoparticles at 750 °C and uniform nanoparticles with a diameter of 3.8 nm at 850 °C were observed in Fig. S3.† The slightly larger diameter at 850 °C in comparison to that at 800 °C was ascribed to the severe aggregation of the crystalline nucleus.The phase of MoC was identified by XRD and the results are shown in Fig. 2a. The characteristic peaks at 2θ angles of 26.4° and 54.5° were consistent with the (002) and (004) facets of carbon (PDF#41-1487). It is also observed that four peaks at 2θ angles of 36.4°, 42.3°, 61.3°, and 73.4° were ascribed to the characteristic peaks of cubic MoC (PDF#65-0280).50 XPS spectra in Fig. 2b indicated the presence of Mo, C, N, P, and O in both MoC/NPC800 and MoC/NPC@CNTs800. The P and N contents were 1.89 atom% and 3.18 atom% for MoC/NPC800, and 0.57 atom% and 6.52 atom% for MoC/NPC@CNTs800, respectively. Higher N content in the latter sample was favorable to alter the electron density and spin density of carbon, and induced stronger electronic state changes for MoC in comparison to the former sample. Note that defects have existed in carbon after thermal annealing, which was confirmed in the Raman spectra in Fig. 2c (left). Peaks centered at around 1358 cm−1 were ascribed to the D peak of carbon, which was widely used to reflect the vibration of sp3-hybridized carbon atoms in defects and edges. Meanwhile, peaks that appeared at around 1592 cm−1 were assigned to the G peak of carbon, which was related to the E2g vibration of sp2-carbon atoms. As summarized in Fig. 2c (right), ID/IG ratio increased from 0.83 to 0.99 when the annealing temperature elevated from 750 to 850 °C, indicating that structural destruction of the sp2-carbon skeleton became more serious at the higher annealing temperature. Generally, a larger ID/IG ratio of the D-band to G-band indicates more defects and exposed edges in carbonaceous materials,51 which would facilitate the mass transport during electrochemical reactions. However, more defects will also lead to a decrease in intrinsic conductivity. And some N–C or P–C bonds were decomposed into gas products at a high temperature of 850 °C, resulting in low N or P contents in the final catalysts, consistent with previous work.49 Too low N or P contents will lower the modulation ability toward the charge density and spin ordering of carbon, thus compromising the HER activity. Brunauer–Emmett–Teller (BET) surface areas were determined by the adsorption–desorption isotherm curves in Fig. 2d. The BET surface area was 107.8 m2 g−1 for MoC/NPC@CNTs800, higher than that of MoC/NPC800 (65.8 m2 g−1). Both samples demonstrated similar size distribution around 2 nm, as seen in the inset of Fig. 2d.
HER measurements
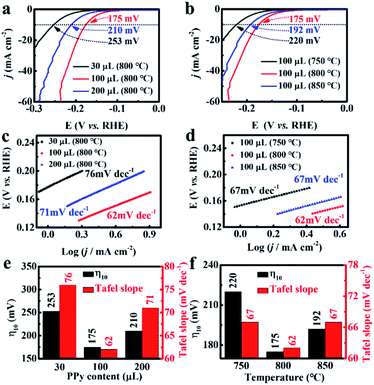
Using polyoxometalate polymerization and carbonization combination strategy, MoC nanoparticles with a diameter of 3.4 nm were uniformly distributed in N, P-codoped defective carbon, and covered on the CNTs to form core–shell nanostructures. Note that there existed a Mott–Schottky effect between the metallic MoC with larger work function and N, P-codoped carbon with a relatively higher Fermi level.52,53 As a result, the electron state on MoC was effectively adjusted after accepting electrons from carbon at equilibrium, leading to the increase in the Fermi level of MoC, and thus favoring the initial H3O+ reduction process for HER.54 We first evaluated the HER performance of MoC/NPC@CNTs synthesized using various pyrrole monomer amounts. As seen in Fig. 3a, the polarization curves were collected in N2-saturated 0.5 M H2SO4 at a scan rate of 5 mV s−1. The addition of a 100 μL pyrrole monomer resulted in the smallest overpotential of 175 mV after an iR-correction than 30 μL (253 mV) and 200 μL (210 mV). In the case of 30 μL pyrrole monomer, the resultant polypyrrole was insufficient to anchor polyoxometalates on the surface of the CNTs; thus, only a few MoC particles were observed after annealing at 750 °C as shown in Fig. S4a.† The number of active sites was too low to drive the HER process, thus showing large overpotential. When the pyrrole volume was 200 μL, thick polypyrrole encapsulating polyoxometalates was wrapped on the surface of the CNTs. As shown in Fig. S4b,† the MoC nanoparticles were covered by a thick layer of carbon with a thickness of ∼4.1 nm after pyrolysis, indicating that most active sites were blocked in the carbon matrix. As confirmed by the LSV curves, excessive amounts of pyrrole gave rise to inferior HER activities with respect to larger overpotential.In addition, experiments using three carbonization temperatures were performed to prepare MoC/NPC@CNTs with the addition of a 100 μL pyrrole monomer. As seen in Fig. 3b, the overpotential for MoC/NPC@CNTs750 and MoC/NPC@CNTs850 were 220 mV and 192 mV, respectively, which are larger than that of MoC/NPC@CNTs800. The reaction kinetics were further unveiled by analyzing the Tafel slopes of all electrocatalysts prepared under different preparation conditions. The MoC/NPC@CNTs800 synthesized with 100 μL pyrrole monomer demonstrated a Tafel slope of 62 mV dec−1, smaller than that of the other two samples with 30 μL (76 mV dec−1) and 200 μL (71 mV dec−1) as shown in Fig. 3c. It is also seen that the catalysts annealed at a temperature of 800 °C resulted in a smaller Tafel slope than the other two cases at temperatures of 750 °C (67 mV dec−1) and 850 °C (67 mV dec−1) in Fig. 3d. As summarized in Fig. 3e and f, one can see that the optimal MoC/NPC@CNTs could be synthesized with 100 μL pyrrole monomer at a carbonization temperature of 800 °C with respect to the smallest overpotential and Tafel slope. It is assumed that the annealing temperature was correlated to the carbonization degree, defects of carbon, heteroatom contents, and size and exposure degree of MoC nanocrystals, respectively. The lower annealing temperature of 750 °C is not high enough for the carbonization of polypyrrole. The higher annealing temperature of 850 °C caused the substantial sintering of MoC nanoparticles, which reduced the density of active sites. In sharp contrast to these two temperatures, materials annealed at 800 °C were able to well balance all these features, which is directly correlated with the exposure of active sites, improvement of conductivity and mass transport for driving the HER kinetics. In order to further prove the optimal carbonization condition of 800 °C, exchange current density (j0) of MoC/NPC@CNTs800 was calculated to be 15.03 μA cm−2 according to the Tafel equation, indeed higher than that of MoC/NPC@CNTs750 (4.19 μA cm−2) and MoC/NPC@CNTs850 (13.49 μA cm−2). Briefly, MoC/NPC@CNTs800 prepared with a 100 μL pyrrole monomer was selected as a representative sample to disclose the electrochemical kinetics and related mechanism in the next part.
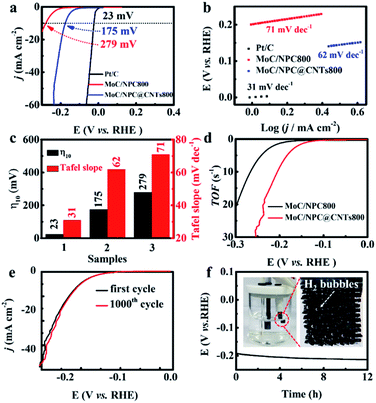
The impact of CNTs on HER performance was disclosed in Fig. 4. In the absence of the CNTs, TEM images of MoC/NPC800 in Fig. S5† indicated that uniform MoC nanoparticles with an average diameter of 3.4 nm were embedded in N P-codoped carbon. The polarization curve in Fig. 4a showed an overpotential of 175 mV for MoC/NPC@CNTs800 to reach the current density of 10 mA cm−2, lower than that of MoC/NPC800 (279 mV) prepared in the absence of CNTs, but still inferior to the commercial Pt/C (23 mV). The presence of the CNTs was effective to improve the conductivity of the catalyst, and thus fasten the electrocatalytic kinetics. This assumption is further proven by the smaller Tafel slope of 62 mV dec−1 for MoC/NPC@CNTs800 than that of MoC/NPC800 (71 mV dec−1) in Fig. 4b. The benchmark Pt/C demonstrated the smallest Tafel slope of 31 mV dec−1. The overpotential and Tafel slopes for MoC/NPC@CNTs800 and benchmark electrocatalysts in Fig. 4c clearly unveiled the positive effect of CNTs for the catalyst design. In comparison to previously reported Mo-containing HER electrocatalysts, MoC/NPC@CNTs800 outperformed some of them in terms of smaller overpotential and the Tafel slopes in Table S1.† TOF plots were shown in Fig. 4d, indicating that the TOF value for MoC/NPC@CNTs800 was 1.49 s−1 at 150 mV, larger than that of MoC/NPC800 (0.45 s−1 at 150 mV). As summarized in Table S1,† the TOF value for our HER electrocatalyst at 150 mV was comparable to previous work. The stability was tested by accelerated deterioration test (ADT) and the results are shown in Fig. 4e. After continuous CV scans at 50 mV s−1, it was seen that the 1000th CV profile of MoC/NPC@CNTs800 almost overlapped with the initial CV curve. Meanwhile, chronopotentiometry test for MoC/NPC@CNTs800 was also carried out as shown in Fig. 4f, showing a stable voltage plateau for 12 h. At the end of 12 h, the inset in Fig. 4f displayed that H2 bubbles were clearly seen on the surface of the electrode, showing a good catalytic activity retention after stability test. After a long-term test, MoC/NPC@CNTs800 was subject to be measured by TEM. The low-resolution TEM image in Fig. S6a† illustrated that the basic morphology was well maintained, and the HRTEM image in Fig. S6b† also demonstrated the interlayer distances for MoC and carbon layers, respectively, consistent with the fresh sample in Fig. 1g and h.
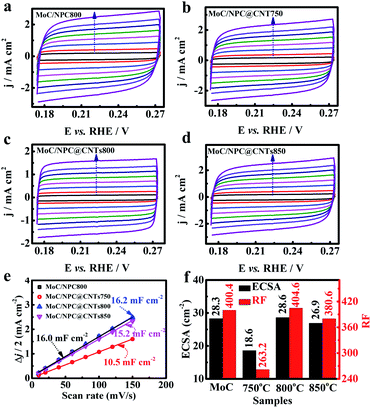
In the above paragraph, it is seen that the inner core CNTs played an important role to improve the HER performance of MoC/NPC@CNTs800. Of note, more exposed active sites were favorable for mass transport. High carbonization temperature was able to convert partial polypyrrole into gas products and the residual carbonaceous materials. Meanwhile, the carbothermal reaction between Mo oxides and carbon will also result in the defects in the carbon skeleton, which has been observed by Han's group.55 The decomposition process and carbothermal reaction were both necessary factors for the creation of porous structures. Generally, higher temperatures will cause severe structural defects, and thus larger exposure of active sites. As seen in Fig. 5a–d, CV curves of MoC/NPC800, MoC/NPC@CNTs750, MoC/NPC@CNTs800, and MoC/NPC@CNTs850 were measured at various scan rates in non-faradaic potential, respectively. The electrochemical surface area (ECSA) was proportional to the electrochemical double layer capacitance (Cdl) according to eqn (2):
| ECSA = Cdl/Cs | (2) |
Generally, the specific capacitance value of Cs is selected as 40 μF cm−2 for a smooth surface electrode.56,57 As seen by the plots of Δj/2 versus scan rates in Fig. 5e, MoC/NPC@CNTs750 displayed the smallest Cdl value of 10.5 mF cm−2. When the temperature elevated to 800 and 850 °C, the Cdl values increased to 16.2 and 15.2 mF cm−2, respectively. Interestingly, MoC/NPC800 synthesized in the absence of CNTs demonstrated a Cdl value of 16.0 mF cm−2, comparable to MoC/NPC@CNTs800. Using eqn (2), ECSA values were calculated to be 28.3, 18.6, 28.6, 26.9 cm−2 in Fig. 5f, respectively. Furthermore, the roughness factor (RF) was calculated by dividing ECSA with the geometric area of the electrode. We did not observe the significant increase in the RF value for MoC/NPC@CNTs800 (404.6) in comparison to MoC/NPC800 (400.4). Basically, larger RF value means exposure of more active sites, which will be favorable for adsorbing more H* on the catalyst surface. However, one can see that the improved HER performance of MoC/NPC@CNTs800 was not ascribed to this factor. Other factors should be involved in improving the HER performance.
Mechanism analysis
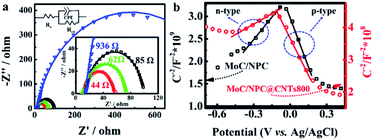
With this problem in hand, we further investigated the EIS spectra of MoC/NPC800 and MoC/NPC@CNTs prepared at three annealing temperatures in Fig. 6a. After well-fitting, one can obtain the charge transfer resistance (Rct) for all catalysts at 175 mV. MoC/NPC@CNTs800 demonstrated the smaller Rct of 44 Ω than MoC/NPC@CNTs750 (85 Ω) and MoC/NPC@CNTs850 (62 Ω). Of note, MoC/NPC800 showed Rct as high as 936 Ω, which solidly confirmed that the presence of CNTs in nanocomposites was effective to improve the electron transfer rate. As for the smallest Rct for MoC/NPC@CNTs800 in comparison to the other two annealing temperatures, it can be explained that the carbonization degree is lower at 750 °C, and more defects appeared at 850 °C (see Raman results). The too-high annealing temperature for heteroatom-doped carbon, CNTs, or graphene are generally avoided because of the loss of heteroatoms and excessive sp3-domains. According to solid-state physics theory, the Mott–Schottky effect existed between the metallic MoC with lower Fermi level and N, P-codoped carbon with higher Fermi level. Thus, Mott–Schottky plots were recorded in 1.0 M PBS electrolyte in Fig. 6b. According to Poisson's equation, the Mott–Schottky relationship can be described as eqn (3) | (3) |
Specific activity was an intrinsic parameter for evaluating the HER performance for different catalysts. Specific current density (js) can be obtained by dividing the geometric current density (jg) with RF.61 As calculated by eqn (4):
 | (4) |
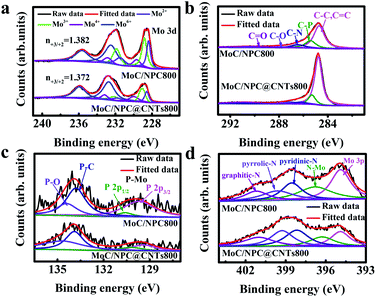 | ||
| Fig. 7 Fine XPS spectra deconvolution analysis. (a) Mo 3d, (b) C 1s, (c) P 2p and (d) N 1s for MoC/NPC800 (top) and MoC/NPC@CNTs800 (bottom), respectively. | ||
Taken together, the improved HER performance of MoC/NPC@CNTs800 can be ascribed to the following reasons. (1) Conductivity was improved due to the presence of the inner core of CNTs, as indicated by the smallest Rct in Table S2.† (2) Donor density for n-type domains in MoC/NPC@CNTs800 was greatly improved, as confirmed by Hall and Mott–Schottky's relationship. (3) The Fermi level was significantly enhanced due to the Mott–Schottky effect between MoC and n-type domains in MoC/NPC@CNTs800. Improved Fermi level of MoC will favor the Volmer-reaction for the initial reduction of H3O+. (4) Smaller Mo3+/Mo2+ ratio in MoC/NPC@CNTs800 strengthens the Mo–H bond on Mo2+ sites to overcome the initial weak Mo3+–H bond strength in MoC, driving the ΔGH* towards the thermoneutrality.
Conclusions
In summary, a series of MoC/NPC@CNTs electrocatalysts were successfully synthesized via polyoxometalate triggered polymerization and subsequent carbonization method. Ultrasmall MoC nanocrystals were well-dispersed in the N, P-codoped carbon matrix, which was uniformly covered on the CNTs' surface. Systematic characterizations and electrocatalytic kinetic studies unveiled that the Mott–Schottky effect contributed more to the favorable adsorption of H* due to the increased Fermi level of MoC after accepting electrons from n-type domains in carbon. Meanwhile, the inner core of CNTs not only facilitated the electron transfer from carbon to MoC but also improved the overall conductivity, thus leading to a fast electron transport. In particular, a smaller Mo3+/Mo2+ ratio indicated that the Mo–H bond strength became stronger in MoC/NPC@CNTs800, effectively driving the Volmer reaction step for HER. Present work opens a new avenue for the improvement of HER performance via introducing the Mott–Schottky effect by a smart combination of metallic phase and semiconductor. Furthermore, for future study, it is reasonable to obtain both HER active sites on the metallic phase with higher Fermi level and OER active sites on n-type semiconductive metal oxides or dichalcogenides with lower Fermi level, thus opening novel research possibilities for developing promising water splitting electrocatalysts.Conflicts of interest
There are no conflicts of interest to declare.Acknowledgements
We gratefully acknowledge the financial support from the National Natural Science Foundation of China (Grants 61390502), Beijing National Laboratory for Molecular Sciences (BNLMS) (No. BNLMS20160119), Key Laboratory of Micro-systems and Micro-structures Manufacturing of Ministry of Education, Harbin Institute of Technology (No. 2015KM006), and Heilongjiang Postdoctoral Foundation (LBH-Q16091), the Fundamental Research Funds for the Central Universities (Grant No. HIT. NSRIF. 201854).Notes and references
- A. Li, H. Ooka, N. Bonnet, T. Hayashi, Y. Sun, Q. Jiang, C. Li, H. Han and R. Nakamura, Angew. Chem., Int. Ed., 2019, 131, 5108–5112 CrossRef.
- F.-C. Shen, S.-N. Sun, Z.-F. Xin, S.-L. Li, L.-Z. Dong, Q. Huang, Y.-R. Wang, J. Liu and Y.-Q. Lan, Appl. Catal., B, 2019, 243, 470–480 CrossRef CAS.
- C. Tang, R. Zhang, W. Lu, L. He, X. Jiang, A. M. Asiri and X. Sun, Adv. Mater., 2017, 29, 1602441 CrossRef PubMed.
- J. Wang, W. Cui, Q. Liu, Z. Xing, A. M. Asiri and X. Sun, Adv. Mater., 2016, 28, 215–230 CrossRef CAS PubMed.
- H. Sun, Z. Ma, Y. Qiu, H. Liu and G.-G. Gao, Small, 2018, 14, 1800294 CrossRef PubMed.
- Z. Ma, K. Wang, Y. Qiu, X. Liu, C. Cao, Y. Feng and P. Hu, Energy, 2018, 143, 43–55 CrossRef CAS.
- B. You and Y. Sun, Acc. Chem. Res., 2018, 51, 1571–1580 CrossRef CAS PubMed.
- Y. Zhang, H. Sun, Y. Qiu, X. Ji, T. Ma, F. Gao, Z. Ma, B. Zhang and P. Hu, Carbon, 2019, 144, 370–381 CrossRef CAS.
- X. Li, Z. Wang, Y. Qiu, Q. Pan and P. Hu, J. Alloys Compd., 2015, 620, 31–37 CrossRef CAS.
- J. Staszak-Jirkovský, C. D. Malliakas, P. P. Lopes, N. Danilovic, S. S. Kota, K.-C. Chang, B. Genorio, D. Strmcnik, V. R. Stamenkovic, M. G. Kanatzidis and N. M. Markovic, Nat. Mater., 2015, 15, 197 CrossRef PubMed.
- G. Ye, Y. Gong, J. Lin, B. Li, Y. He, S. T. Pantelides, W. Zhou, R. Vajtai and P. M. Ajayan, Nano Lett., 2016, 16, 1097–1103 CrossRef CAS PubMed.
- M. Zeng and Y. Li, J. Mater. Chem. A, 2015, 3, 14942–14962 RSC.
- X. Wang, L. Yu, B. Y. Guan, S. Song and X. W. Lou, Adv. Mater., 2018, 30, 1801211 CrossRef PubMed.
- D. Parra, L. Valverde, F. J. Pino and M. K. Patel, Renewable Sustainable Energy Rev., 2019, 101, 279–294 CrossRef CAS.
- Y. Shi and B. Zhang, Chem. Soc. Rev., 2016, 45, 1529–1541 RSC.
- S. Anantharaj, S. R. Ede, K. Sakthikumar, K. Karthick, S. Mishra and S. Kundu, ACS Catal., 2016, 6, 8069–8097 CrossRef CAS.
- I. Roger, M. A. Shipman and M. D. Symes, Nat. Rev. Chem., 2017, 1, 0003 CrossRef CAS.
- D. Li, J. Shi and C. Li, Small, 2018, 14, 1704179 CrossRef PubMed.
- T. Liu, M. Li, C. Jiao, M. Hassan, X. Bo, M. Zhou and H.-L. Wang, J. Mater. Chem. A, 2017, 5, 9377–9390 RSC.
- G. Liu, Y. Qiu, Z. Wang, J. Zhang, X. Chen, M. Dai, D. Jia, Y. Zhou, Z. Li and P. Hu, ACS Appl. Mater. Interfaces, 2017, 9, 37750–37759 CrossRef CAS PubMed.
- H. Zhang, P. An, W. Zhou, B. Y. Guan, P. Zhang, J. Dong and X. W. Lou, Sci. Adv., 2018, 4, eaao6657 CrossRef PubMed.
- Y. Zhang, H. Sun, Y. Qiu, E. Zhang, T. Ma, G.-G. Gao, C. Cao, Z. Ma and P. Hu, Energy, 2018, 165, 537–548 CrossRef CAS.
- T. Ma, Y. Qiu, Y. Zhang, X. Ji and P.-A. Hu, ACS Appl. Nano Mater., 2019, 2, 3091–3099 CrossRef CAS.
- Y. Huang, Z. Ma, Y. Hu, D. Chai, Y. Qiu, G. Gao and P. Hu, RSC Adv., 2016, 6, 51725–51731 RSC.
- H. Yan, C. Tian, L. Wang, A. Wu, M. Meng, L. Zhao and H. Fu, Angew. Chem., Int. Ed., 2015, 54, 6325–6329 CrossRef CAS PubMed.
- Y. Jiao, Y. Zheng, K. Davey and S.-Z. Qiao, Nat. Energy, 2016, 1, 16130 CrossRef CAS.
- Y. Yin, J. Han, Y. Zhang, X. Zhang, P. Xu, Q. Yuan, L. Samad, X. Wang, Y. Wang, Z. Zhang, P. Zhang, X. Cao, B. Song and S. Jin, J. Am. Chem. Soc., 2016, 138, 7965–7972 CrossRef CAS PubMed.
- X. Zhang, X. Yu, L. Zhang, F. Zhou, Y. Liang and R. Wang, Adv. Funct. Mater., 2018, 28, 1706523 CrossRef.
- J.-S. Moon, J.-H. Jang, E.-G. Kim, Y.-H. Chung, S. J. Yoo and Y.-K. Lee, J. Catal., 2015, 326, 92–99 CrossRef CAS.
- Y. Jiang, Y. Lu, J. Lin, X. Wang and Z. Shen, Small Methods, 2018, 2, 1700369 CrossRef.
- J. Hu, B. Huang, C. Zhang, Z. Wang, Y. An, D. Zhou, H. Lin, M. K. H. Leung and S. Yang, Energy Environ. Sci., 2017, 10, 593–603 RSC.
- J.-S. Li, Y. Wang, C.-H. Liu, S.-L. Li, Y.-G. Wang, L.-Z. Dong, Z.-H. Dai, Y.-F. Li and Y.-Q. Lan, Nat. Commun., 2016, 7, 11204 CrossRef CAS PubMed.
- S. Wang, J. Wang, M. Zhu, X. Bao, B. Xiao, D. Su, H. Li and Y. Wang, J. Am. Chem. Soc., 2015, 137, 15753–15759 CrossRef CAS PubMed.
- M. Miao, J. Pan, T. He, Y. Yan, B. Y. Xia and X. Wang, Chem.–Eur. J., 2017, 23, 10947–10961 CrossRef CAS PubMed.
- C. Wan, Y. N. Regmi and B. M. Leonard, Angew. Chem., Int. Ed., 2014, 53, 6407–6410 CrossRef CAS PubMed.
- M. A. R. Anjum and J. S. Lee, ACS Catal., 2017, 7, 3030–3038 CrossRef CAS.
- Y.-Y. Chen, Y. Zhang, W.-J. Jiang, X. Zhang, Z. Dai, L.-J. Wan and J.-S. Hu, ACS Nano, 2016, 10, 8851–8860 CrossRef CAS PubMed.
- H. Lin, Z. Shi, S. He, X. Yu, S. Wang, Q. Gao and Y. Tang, Chem. Sci., 2016, 7, 3399–3405 RSC.
- C. Wan and B. M. Leonard, Chem. Mater., 2015, 27, 4281–4288 CrossRef CAS.
- K. Xiong, L. Li, L. Zhang, W. Ding, L. Peng, Y. Wang, S. Chen, S. Tan and Z. Wei, J. Mater. Chem. A, 2015, 3, 1863–1867 RSC.
- H. Lin, N. Liu, Z. Shi, Y. Guo, Y. Tang and Q. Gao, Adv. Funct. Mater., 2016, 26, 5590–5598 CrossRef CAS.
- Z.-H. Xue, H. Su, Q.-Y. Yu, B. Zhang, H.-H. Wang, X.-H. Li and J.-S. Chen, Adv. Energy Mater., 2017, 7, 1602355 CrossRef.
- J. Hou, Y. Sun, Y. Wu, S. Cao and L. Sun, Adv. Funct. Mater., 2018, 28, 1704447 CrossRef.
- J. R. d. S. Politi, F. Viñes, J. A. Rodriguez and F. Illas, Phys. Chem. Chem. Phys., 2013, 15, 12617–12625 RSC.
- Y.-J. Yu, Y. Zhao, S. Ryu, L. E. Brus, K. S. Kim and P. Kim, Nano Lett., 2009, 9, 3430–3434 CrossRef CAS PubMed.
- D. Merki, S. Fierro, H. Vrubel and X. Hu, Chem. Sci., 2011, 2, 1262–1267 RSC.
- A. G. Osorio, I. C. L. Silveira, V. L. Bueno and C. P. Bergmann, Appl. Surf. Sci., 2008, 255, 2485–2489 CrossRef CAS.
- P. Gómez-Romero and M. Lira-Cantú, Adv. Mater., 1997, 9, 144–147 CrossRef.
- Y. Jia, L. Zhang, A. Du, G. Gao, J. Chen, X. Yan, C. L. Brown and X. Yao, Adv. Mater., 2016, 28, 9532–9538 CrossRef CAS PubMed.
- C. He and J. Tao, Chem. Commun., 2015, 51, 8323–8325 RSC.
- Z. Wen, S. Ci, Y. Hou and J. Chen, Angew. Chem., Int. Ed., 2014, 53, 6496–6500 CrossRef CAS PubMed.
- Y. Yu, Z. Guo, Q. Peng, J. Zhou and Z. Sun, J. Mater. Chem. A, 2019, 7, 12145–12153 RSC.
- H. B. Yang, J. Miao, S.-F. Hung, J. Chen, H. B. Tao, X. Wang, L. Zhang, R. Chen, J. Gao, H. M. Chen, L. Dai and B. Liu, Sci. Adv., 2016, 2, e1501122 CrossRef PubMed.
- X.-H. Li and M. Antonietti, Chem. Soc. Rev., 2013, 42, 6593–6604 RSC.
- D. Zhou, Y. Cui, P.-W. Xiao, M.-Y. Jiang and B.-H. Han, Nat. Commun., 2014, 5, 4716 CrossRef CAS PubMed.
- C. C. L. McCrory, S. Jung, J. C. Peters and T. F. Jaramillo, J. Am. Chem. Soc., 2013, 135, 16977–16987 CrossRef CAS PubMed.
- Y. Zhou and H. C. Zeng, Small, 2018, 14, 1704403 CrossRef PubMed.
- F. Cardon and W. P. Gomes, J. Phys. D: Appl. Phys., 1978, 11, L63–L67 CrossRef CAS.
- R. He, J. Hua, A. Zhang, C. Wang, J. Peng, W. Chen and J. Zeng, Nano Lett., 2017, 17, 4311–4316 CrossRef CAS PubMed.
- M. Barawi, I. J. Ferrer, J. R. Ares and C. Sánchez, ACS Appl. Mater. Interfaces, 2014, 6, 20544–20549 CrossRef CAS PubMed.
- A. T. Swesi, J. Masud and M. Nath, Energy Environ. Sci., 2016, 9, 1771–1782 RSC.
Footnotes |
| † Electronic supplementary information (ESI) available: SEM images of MoC/NPC@CNTs prepared at various temperatures; TEM images of MoC/NPC@CNTs prepared at 750 °C and 850 °C, as well as using 30 and 200 μL pyrrole, respectively; TEM images of MoC/NPC800; comparisons of HER parameters; comparisons of MoC based electrocatalysts in our work with and without CNTs; post-characterization; specific activity. See DOI: 10.1039/c9se00897g |
| ‡ These authors made equal contributions to this work. |
| This journal is © The Royal Society of Chemistry 2020 |

