Accelerative oxygen evolution by Cu-doping into Fe-Co oxides†
Qiaoqiao
Zhang‡
,
Ning
Liu‡
and
Jingqi
Guan
 *
*
Key Laboratory of Surface and Interface Chemistry of Jilin Province, College of Chemistry, Jilin University, Changchun 130023, PR China. E-mail: guanjq@jlu.edu.cn
First published on 7th November 2019
Abstract
Development of cost-efficient, high-performance and robust earth-abundant electrocatalysts for the oxygen evolution reaction (OER) is a continuous challenge. Herein, we develop a facile sol–gel strategy to fabricate a ternary Fe-Co-Cu oxide for efficient electrocatalysis of water oxidation. Low overpotentials of 256, 271, and 226 mV at 10 mA cm−2 can be achieved over FeCoCuOx supported on a GCE, a Pt electrode, and Ni foam, respectively, in an alkaline electrolyte. Due to the enhanced charge transfer ability and electrochemically active surface area, trimetallic FeCoCuOx is more active than binary FeCoOx and among the most active OER catalysts to date.
Introduction
The oxygen evolution reaction (OER) is the core for some renewable energy technologies, such as electrocatalytic water-splitting, reversible fuel cells, and rechargeable metal–air batteries.1–4 Due to the sluggish kinetics of the OER, high-efficiency electrocatalysts are demanded to overcome the high reaction barrier, facilitate the reaction rate, and reduce the overpotential to improve the energy efficiency.5,6 Although iridium and ruthenium oxides possess good OER activity, their widespread application is impeded by the scarcity and high cost. Exploitation of cost-efficient, high-performance and robust noble-metal-free earth-abundant OER electrocatalysts is an ongoing challenge.7Over the past few decades, various kinds of transition-metal-based catalysts have been reported to achieve electrochemical water oxidation in alkaline media, which include oxides or (oxy)hydroxides,8–11 nitrides,12–14 chalcogenides,15–17 phosphides,18,19 selenides,20,21 and carbon-based hybrid materials.22,23 It has been reported that the metal phosphides, sulfides and selenides would be partially or completely transformed into metal oxides and/or (oxy)hydroxides during the OER, especially when operated at a high overpotential.24 Therefore, from the perspective of application, metal oxides or (oxy)hydroxides are preferred OER catalysts.25,26 Compared with the crystalline counterparts, amorphous metal oxides show a higher surface area, better chemical stability, and stronger corrosion resistance.7 Although amorphous metal oxides lack long-term orderly arrangement of atoms, they maintain the short-range order within several atoms. The coordination number of the M–O polyhedron in amorphous metal oxides plays a crucial role in the OER. The configurations and electronic properties of the M–O polyhedron can be influenced by metal element doping.25
Fe-Co-based oxides and (oxy)hydroxides showed excellent OER performance in alkaline media.27,28 The catalytic OER activity can be improved by doping Cr,29 Ni,30 and W25 into the Fe-Co-based system due to the production of defects or synergistic mechanisms. It has been reported that the introduction of copper into the Fe-Ni-based oxides increases the ECSA and intrinsic catalytic activity owing to a synergistic effect of Ni, Fe, and Cu.24 Here, we adopt a sol–gel method to introduce copper into the Fe-Co-based oxide system in an atomically homogeneous dispersion, which is named FeCoCuOx. The good dispersion of various metal ions favors the exposure of more active sites for the OER.
Results and discussion
The structure of the as-prepared FeCoCuOx was analyzed by XRD. As shown in Fig. 1a, two broad peaks centered at ca. 35° and 61.5° can be observed, which is typically characteristic of amorphous oxide materials. Moreover, no definite diffraction peaks due to metal oxides/(oxy)hydroxides can be seen, further implying the amorphous state of FeCoCuOx. The morphology of FeCoCuOx was characterized by SEM. As illustrated in Fig. 1b, no regular morphology and crystals can be observed. The morphology of FeCoCuOx was further investigated by TEM. As shown in Fig. 1c, irregular clumps are typically observed in agreement with the SEM result. From the HRTEM image of FeCoCuOx (Fig. 1d), no lattice fringes can be seen, indicating that no crystals were formed. The dispersion of various metal elements in FeCoCuOx was studied by a SEM-EDS mapping test. As exhibited in Fig. 2, Fe, Co, and Cu are homogeneously dispersed in the sample. The atomic ratio of Fe/Co/Cu is close to 1![[thin space (1/6-em)]](https://www.rsc.org/images/entities/char_2009.gif) :
:![[thin space (1/6-em)]](https://www.rsc.org/images/entities/char_2009.gif) 1
1![[thin space (1/6-em)]](https://www.rsc.org/images/entities/char_2009.gif) :
:![[thin space (1/6-em)]](https://www.rsc.org/images/entities/char_2009.gif) 1 as analyzed by the SEM-EDS, which is in agreement with the ICP results. The metal content of Fe, Co, and Cu in FeCoCuOx is 20.1, 21.3, and 23.1 wt% determined by ICP-AES, respectively.
1 as analyzed by the SEM-EDS, which is in agreement with the ICP results. The metal content of Fe, Co, and Cu in FeCoCuOx is 20.1, 21.3, and 23.1 wt% determined by ICP-AES, respectively.
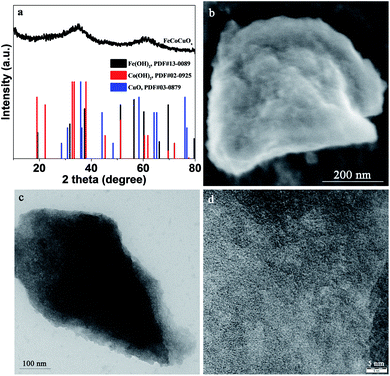 | ||
| Fig. 1 (a) XRD patterns of FeCoCuOx and referred samples (Fe(OH)2, Co(OH)2, and CuO), (b) HRSEM image of FeCoCuOx, (c) TEM image of FeCoCuOx, and (d) HRTEM image of FeCoCuOx. | ||
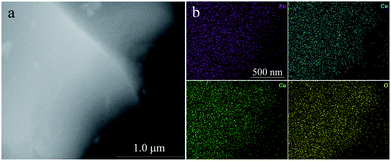 | ||
| Fig. 2 (a) SEM image of FeCoCuOx used in the EDS mapping test and (b) the corresponding EDS mapping of Fe, Co, Cu, and O. | ||
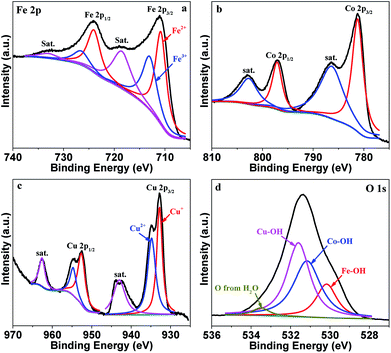
The surface composition and metal valence state of FeCoCuOx were analyzed by XPS. As displayed in Fig. S1,† Fe, Co, Cu, and O are mainly detected. The high-resolution XPS spectra of Fe 2p, Co 2p, Cu 2p, and O 1s are depicted in Fig. 3. The Fe 2p XPS spectrum is resolved into two pairs of 2p1/2/2p3/2 doublets for Fe2+ (710.8/724.0 eV) and Fe3+ (713.0/726.5 eV) with an energy separation of 13.1 eV.31–34 The surface Fe2+/Fe3+ molar ratio is calculated to be around 1.3. Co 2p3/2 and Co 2p1/2 are located at 781.16 eV and 797.16 eV, respectively, with an energy separation of 16.0 eV, indicating the dominant existence of Co2+.35–40 Two obvious satellite peaks centered at 786.4 and 802.7 eV further indicate the presence of Co2+. Cu 2p3/2 and Cu 2p1/2 can be fitted into Cu+ 2p3/2 (932.8 eV), Cu2+ 2p3/2 (934.8 eV), Cu+ 2p1/2 (952.6 eV), and Cu2+ 2p1/2 (954.7 eV).41 The Cu+/Cu2+ atomic ratio is calculated to be ca. 1![[thin space (1/6-em)]](https://www.rsc.org/images/entities/char_2009.gif) :
:![[thin space (1/6-em)]](https://www.rsc.org/images/entities/char_2009.gif) 1. The O 1s XPS spectrum can be deconvoluted into the peaks for Fe–OH (530.2 eV), Co–OH (531.2 eV), Cu–OH (531.7 eV), and O from water (533.3 eV).42,43
1. The O 1s XPS spectrum can be deconvoluted into the peaks for Fe–OH (530.2 eV), Co–OH (531.2 eV), Cu–OH (531.7 eV), and O from water (533.3 eV).42,43
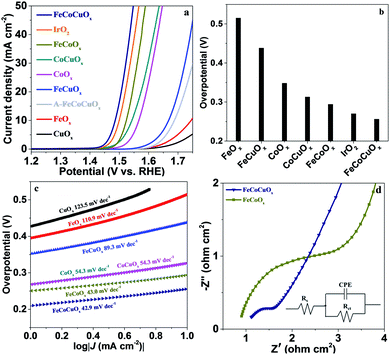
The electrocatalytic activity of FeCoCuOx toward the OER was first evaluated by supporting it on a glassy carbon electrode (GCE) and by linear sweep voltammetry (LSV) tests conducted in 1.0 M KOH electrolyte at a scan rate of 1.0 mV s−1 (Fig. 4). The reference electrode was calibrated before the test (Fig. S2†). As expected, CuOx and FeOx show poor OER performance due to the lack of efficient OER active sites for the former and bad electrical conductivity for the latter (Fig. 4a). The introduction of Cu into FeOx would improve the water oxidation performance, showing an overpotential of 438 mV at 10 mA cm−2, still higher than that on CoOx (348 mV) (Fig. 4b). The introduction of Cu into the CoOx can also decrease the overpotential from 348 mV to 313 mV. It is interesting to find that the OER activity of FeCoOx can be further increased by the addition of Cu (Fig. S3†). For FeCoCuOx, the overpotential at 10 mA cm−2 is only 256 mV, which is higher than or well comparable with that of previously reported electrocatalysts tested under similar conditions (Table S1†). The OER activity of FeCoCuOx would exaggeratedly decrease after it was annealed at 500 °C in air for 2 h (Fig. 4a). The annealed FeCoCuOx (A-FeCoCuOx) shows distinct strong diffraction peaks in the XRD pattern (Fig. S4†), implying that amorphous FeCoCuOx was transformed into a crystalline oxide. The control experiment indicates that the crystallized oxide shows worse OER activity than the non-crystallized one. The FeCoCuOx catalyst shows a higher TOF of 0.034 s−1 per total 3d metal atoms with 90% iR-correction at η = 300 mV than state-of-the-art IrO2 (0.01 s−1).44 The excellent OER performance of FeCoCuOx can be demonstrated by the low Tafel slope. As manifested in Fig. 4c, the Tafel slope of FeCoCuOx-on-GCE is 42.9 mV dec−1, which is lower than that of CuOx (123.5 mV dec−1), FeOx (110.9 mV dec−1), FeCuOx (89.3 mV dec−1), CoOx (54.3 mV dec−1), CoCuOx (54.3 mV dec−1), and FeCoOx (43.0 mV dec−1).
The positive role of Cu in improving the OER activity of the FeOx, CoOx, and FeCoOx systems should be mainly ascribed to the modified charge transfer kinetics. The electrode reaction mechanism was controlled by the charge transfer step and ion diffusion process.45 As depicted in Fig. 4d and S5,‡ the addition of copper to these systems significantly accelerates the charge transfer. For FeCoCuOx-on-GCE, a rough semicircle at high frequency is ascribed to the faradaic charge-transfer resistance (Rct) in parallel with the double-layer capacitance (CPE). The fitted result shows that the Rct is as low as 0.53 Ω cm2, indicating good conductivity and low internal resistance of the FeCoCuOx electrode, which favors electrocatalysis.
To investigate the possible effect of the surface area on the OER, we determined the electrochemically active surface area (ECSA) by performing CV measurements at varying scan rates. The double-layer capacitance (Cdl) is usually used to represent the corresponding ECSA, which can be obtained from the linear slope by plotting Δj = (|jcharge − joff charge|) in a faradaic silence potential range against the scan rates.24 As shown in Fig. S6,† the Cdl values for CuOx, FeOx, CoOx, FeCuOx, CoCuOx, FeCoOx, and FeCoCuOx are measured to be 0.043, 0.14, 0.35, 1.3, 6.5, 8.5, 28.6 mF cm−2, respectively. The OER activity of FeCoCuOx should be partially ascribed to its high ECSA with more electrochemical active sites. However, the ECSA is not linearly consistent with the specific surface area. As obtained by nitrogen sorption measurements (Fig. S7†), the BET specific surface areas of FeOx, CoOx, FeCoOx, FeCuOx, CoCuOx, and FeCoCuOx are 390, 33, 306, 252, 143, and 220 m2 g−1, respectively.
The electrocatalytic water oxidation activity of FeCoCuOx was further evaluated by supporting it on a Pt electrode. As demonstrated in Fig. 5a, the bare Pt electrode shows low OER activity with an overpotential of 701 mV at 10 mA cm−2. FeOx and CuOx supported on the Pt electrode show higher OER activity than those supported on the glassy carbon substrate, which should be attributed to a synergistic mechanism between Fe/Cu and Pt. Similar to the results obtained on the GCE, the introduction of copper into the FeOx, CoOx, and FeCoOx systems can enhance the OER activity tested on the Pt electrode. The overpotential at 10 mA cm−2 decreased from 304 mV for FeCoOx to 271 mV for FeCoCuOx (Fig. S8†). The FeCoCuOx-on-Pt electrode shows a Tafel slope of 52.5 mV dec−1 in 1.0 M KOH (Fig. 5b), slightly higher than that on the GCE.
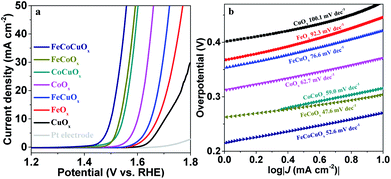 | ||
| Fig. 5 (a) Polarization curves of FeOx, CoOx, CuOx, FeCuOx, CoCuOx, FeCoOx, and FeCoCuOx supported on Pt electrodes in 1.0 M KOH solution without iR-compensation. (b) Tafel plots derived from (a). | ||
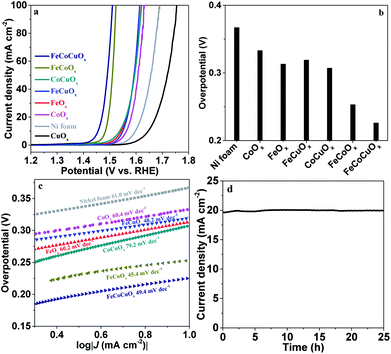
To obtain a high-quality electrode, we supported FeCoCuOx on nickel foam (NF) with good conductivity and high surface area. The OER performance of the as-obtained FeCoCuOx/NF was measured in 1.0 M KOH electrolyte. As exhibited in Fig. 6a, CuOx-on-Ni foam shows worse OER activity than bare Ni foam, indicating the poor water oxidation ability of CuOx. FeOx-on-Ni foam shows better OER activity than CoOx-on-Ni foam due to the synergistic effect between Fe and Ni, which has been reported.46,47 Doping copper into the CoOx system can improve the OER activity by lowering the overpotential at 10 mA cm−2 from 333 mV for CoOx-on-Ni to 307 mV for CoCuOx-on-Ni (Fig. 6b). It is interesting to observe that the addition of copper to the FeCoOx system can further improve the catalytic performance. The overpotential at 10 mA cm−2 for FeCoOx-on-Ni and FeCoCuOx-on-Ni is 253 and 226 mV, respectively (Fig. S9†), outperforming some benchmark NiFe-based composite electrodes in alkaline media.48,49 The Tafel slope of FeCoCuOx-on-Ni is 49.4 mV dec−1, which is close to that of FeCoCuOx-on-GCE and FeCoCuOx-on-Pt (Fig. 6c). The small Tafel slope of FeCoCuOx implies the facile electron transfer for water oxidation on the surface of the composite.50 The OER stability of FeCoCuOx-on-Ni was investigated (Fig. 6d). FeCoCuOx needs a small overpotential of about 250 mV to achieve 20 mA cm−2 and can maintain relatively stable catalytic activity for more than 25 h.
From the above results, it can be inferred that Cu is not the efficient active site for the OER since CuOx shows poor electrocatalytic water oxidation activity by supporting it on a GCE, a Pt electrode, and Ni foam. The OER activity of FeCoOx is much higher than that of monometallic FeOx and CoOx on different substrates, suggesting a cooperative mechanism between Fe and Co during the OER in agreement with previous reports.28,51–54 However, it is still controversial which one is the actual active site for the OER. Very recently, Hu et al. reported that a dimeric Co-Fe moiety might be the active site for the OER on a single-atom Co precatalyst in the presence of Fe3+.52 The main role of Cu in accelerating the OER of FeCoOx should be ascribed to the promoted charge transfer kinetics as manifested by EIS.
The structure of FeCoCuOx after the OER stability test was characterized by XRD. Since it is very difficult to obtain sufficient sample for the XRD analysis by supporting it on the GCE, we supported it on a FTO (fluorine doped tin oxide) coated glass electrode for the OER and XRD tests. As manifested in Fig. S10,† besides the characteristic peaks for FTO in the XRD patterns, no additional peaks can be found, suggesting that no crystalline oxides were formed during the OER. The TEM image further verifies that FeCoCuOx after the OER test still maintains the amorphous state (Fig. S11†). The change of surface metal valence states in FeCoCuOx was characterized by XPS of the used catalyst. Since it was very difficult to reclaim the used catalysts from GC electrodes to perform XPS analysis, we used FTO coated glass with a large area as the substrate to support the electrocatalyst for the OER. After reaction, the used sample was washed with water several times, dried, and then scraped off from FTO to carry out XPS. The position of the Fe 2p3/2 XPS peaks shifts from 711.0 eV before the OER to 713.2 eV after OER electrocatalysis (Fig. 7a), suggesting that a large proportion of Fe2+ was oxidized to Fe3+. The fitted result shows that the surface Fe3+/Fe2+ ratio increases from 0.77![[thin space (1/6-em)]](https://www.rsc.org/images/entities/char_2009.gif) :
:![[thin space (1/6-em)]](https://www.rsc.org/images/entities/char_2009.gif) 1 in the fresh sample to 6.6
1 in the fresh sample to 6.6![[thin space (1/6-em)]](https://www.rsc.org/images/entities/char_2009.gif) :
:![[thin space (1/6-em)]](https://www.rsc.org/images/entities/char_2009.gif) 1 in the used sample. There is a slight shift of Co 2p to higher binding energy (from 781.1 to 781.8 eV) after the OER (Fig. 7b), indicating that a part of Co2+ was oxidized to Co3+ during water oxidation. The Cu 2p3/2 XPS spectrum shows that the Cu species remains after the OER (Fig. 7c), but the binding energy shifts to a higher value of 934.8 eV, revealing that Cu+ was completely oxidized to Cu2+ during the OER measurement. From the fitted O 1s XPS spectrum (Fig. 7d), the relative content of Fe–OH, Co–OH, and Cu–OH remains unchanged, suggesting the chemical stability of FeCoCuOx. The electrolyte after the OER was analyzed by ICP-AES, which did not detect obvious Fe/Co/Cu ions (<1 ppm) in the solution, further demonstrating the good stability of FeCoCuOx for the OER.
1 in the used sample. There is a slight shift of Co 2p to higher binding energy (from 781.1 to 781.8 eV) after the OER (Fig. 7b), indicating that a part of Co2+ was oxidized to Co3+ during water oxidation. The Cu 2p3/2 XPS spectrum shows that the Cu species remains after the OER (Fig. 7c), but the binding energy shifts to a higher value of 934.8 eV, revealing that Cu+ was completely oxidized to Cu2+ during the OER measurement. From the fitted O 1s XPS spectrum (Fig. 7d), the relative content of Fe–OH, Co–OH, and Cu–OH remains unchanged, suggesting the chemical stability of FeCoCuOx. The electrolyte after the OER was analyzed by ICP-AES, which did not detect obvious Fe/Co/Cu ions (<1 ppm) in the solution, further demonstrating the good stability of FeCoCuOx for the OER.
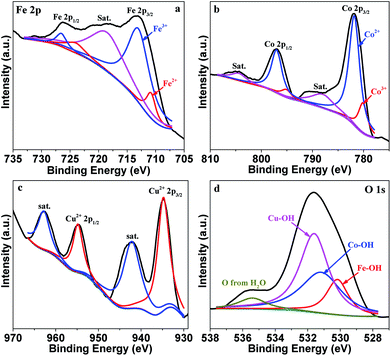 | ||
| Fig. 7 High-resolution XPS spectra of Fe 2p (a), Co 2p (b), Cu 2p (c) and O 1s (d) of FeCoCuOx after the OER test. | ||
Conclusions
In summary, trimetallic FeCoCuOx has been displayed as a high-performance and robust electrocatalyst for the OER. The obtained FeCoCuOx showed good OER activity with low overpotentials of 256, 271, and 226 mV at 10 mA cm−2 on a GCE, a Pt electrode, and Ni foam, respectively. FeCoCuOx is more active than bimetallic FeCoOx, due to the introduction of Cu to promote the charge transfer. In addition, the addition of Cu to the FeCoOx system significantly enhances the ECSA, which can provide more electrochemically active sites for OER catalysis. This work paves a facile way for developing highly active OER electrocatalysts.Conflicts of interest
There are no conflicts to declare.Acknowledgements
This work was supported by the Natural Science Foundation of Jilin Province (20180101291JC).Notes and references
- Y. Jiao, Y. Zheng, M. Jaroniec and S. Z. Qiao, Chem. Soc. Rev., 2015, 44, 2060–2086 RSC.
- H. Sun, Z. Yan, F. Liu, W. Xu, F. Cheng and J. Chen, Adv. Mater., 2019, e1806326, DOI:10.1002/adma.201806326.
- Q. Hu, X. Liu, B. Zhu, L. Fan, X. Chai, Q. Zhang, J. Liu, C. He and Z. Lin, Nano energy, 2018, 50, 212–219 CrossRef CAS.
- Q. Hu, G. Li, G. Li, X. Liu, B. Zhu, X. Chai, Q. Zhang, J. Liu and C. He, Adv. Energy Mater., 2019, 9, 1803867 CrossRef.
- F. Lyu, Q. Wang, S. M. Choi and Y. Yin, Small, 2019, 15, 1804201 CrossRef PubMed.
- Q. Hu, G. Li, X. Liu, B. Zhu, X. Chai, Q. Zhang, J. Liu and C. He, Angew. Chem., Int. Ed., 2019, 58, 4318–4322 CrossRef CAS.
- S. Yan, K. P. Abhilash, L. Tang, M. Yang, Y. Ma, Q. Xia, Q. Guo and H. Xia, Small, 2019, 15, 1804371 Search PubMed.
- L. Lv, Z. Yang, K. Chen, C. Wang and Y. Xiong, Adv. Energy Mater., 2019, 9, 1803358 CrossRef.
- K. Zhu, X. Zhu and W. Yang, Angew. Chem., Int. Ed., 2019, 58, 1252–1265 CrossRef CAS PubMed.
- C. C. L. McCrory, S. Jung, I. M. Ferrer, S. M. Chatman, J. C. Peters and T. F. Jaramillo, J. Am. Chem. Soc., 2015, 137, 4347–4357 CrossRef CAS.
- M.-I. Jamesh and X. Sun, J. Power Sources, 2018, 400, 31–68 CrossRef CAS.
- H. Fei, J. Dong, Y. Feng, C. S. Allen, C. Wan, B. Volosskiy, M. Li, Z. Zhao, Y. Wang and H. Sun, Nat. Catal., 2018, 1, 63–72 CrossRef CAS.
- H. Xu, D. Cheng, D. Cao and X. C. Zeng, Nat. Catal., 2018, 1, 339–348 CrossRef CAS.
- X. Peng, C. Pi, X. Zhang, S. Li, K. Huo and P. K. Chu, Sustainable Energy Fuels, 2019, 3, 366–381 RSC.
- B. Dong, X. Zhao, G. Q. Han, X. Li, X. Shang, Y. R. Liu, W. H. Hu, Y. M. Chai, H. Zhao and C. G. Liu, J. Mater. Chem. A, 2016, 4, 13499–13508 RSC.
- Y. Wu, G.-D. Li, Y. Liu, L. Yang, X. Lian, T. Asefa and X. Zou, Adv. Funct. Mater., 2016, 26, 4839–4847 CrossRef CAS.
- Y. Rao, Y. Wang, H. Ning, P. Li and M. Wu, ACS Appl. Mater. Interfaces, 2016, 8, 33601–33607 CrossRef CAS PubMed.
- J. Zheng, W. Zhou, T. Liu, S. Liu, C. Wang and L. Guo, Nanoscale, 2017, 9, 4409–4418 RSC.
- H. Wang, Y. Li, R. Wang, B. He and Y. Gong, Electrochim. Acta, 2018, 284, 504–512 CrossRef CAS.
- L. Liang, H. Cheng, F. Lei, J. Han, S. Gao, C. Wang, Y. Sun, S. Qamar, S. Wei and Y. Xie, Angew. Chem., Int. Ed., 2015, 54, 12004–12008 CrossRef CAS.
- S. Anantharaj, S. R. Ede, K. Sakthikumar, K. Karthick, S. Mishra and S. Kundu, ACS Catal., 2016, 6, 8069–8097 CrossRef CAS.
- L. Zhang, J. Xiao, H. Wang and M. Shao, ACS Catal., 2017, 7, 7855–7865 CrossRef CAS.
- C. Hu and L. Dai, Adv. Mater., 2017, 29, 1604942 CrossRef.
- P. Zhang, L. Li, D. Nordlund, H. Chen, L. Fan, B. Zhang, X. Sheng, Q. Daniel and L. Sun, Nat. Commun., 2018, 9, 381 CrossRef PubMed.
- B. Zhang, X. L. Zheng, O. Voznyy, R. Comin, M. Bajdich, M. Garcia-Melchor, L. L. Han, J. X. Xu, M. Liu, L. R. Zheng, F. P. G. de Arquer, C. T. Dinh, F. J. Fan, M. J. Yuan, E. Yassitepe, N. Chen, T. Regier, P. F. Liu, Y. H. Li, P. De Luna, A. Janmohamed, H. L. L. Xin, H. G. Yang, A. Vojvodic and E. H. Sargent, Science, 2016, 352, 333–337 CrossRef CAS PubMed.
- Y. Wang, C. Xie, Z. Zhang, D. Liu, R. Chen and S. Wang, Adv. Funct. Mater., 2018, 28, 1703363 CrossRef.
- C. C. McCrory, S. Jung, J. C. Peters and T. F. Jaramillo, J. Am. Chem. Soc., 2013, 135, 16977–16987 CrossRef CAS.
- A. Indra, P. W. Menezes, N. R. Sahraie, A. Bergmann, C. Das, M. Tallarida, D. Schmeisser, P. Strasser and M. Driess, J. Am. Chem. Soc., 2014, 136, 17530–17536 CrossRef CAS PubMed.
- X. Bo, Y. Li, X. Chen and C. Zhao, J. Power Sources, 2018, 402, 381–387 CrossRef CAS.
- R. D. L. Smith, M. S. Prevot, R. D. Fagan, S. Trudel and C. P. Berlinguette, J. Am. Chem. Soc., 2013, 135, 11580–11586 CrossRef CAS PubMed.
- Y. Liu, Y. Bai, Y. Han, Z. Yu, S. Zhang, G. Wang, J. Wei, Q. Wu and K. Sun, ACS Appl. Mater. Interfaces, 2017, 9, 36917–36926 CrossRef CAS PubMed.
- J. Yang, X. Wang, B. Li, L. Ma, L. Shi, Y. Xiong and H. Xu, Adv. Funct. Mater., 2017, 27, 1606497 CrossRef.
- Z. Wu, X. Wang, J. Huang and F. Gao, J. Mater. Chem. A, 2018, 6, 167–178 RSC.
- A.-L. Wang, H. Xu and G.-R. Li, ACS Energy Lett., 2016, 1, 445–453 CrossRef CAS.
- C. Lin, S. S. Shinde, Z. Jiang, X. Song, Y. Sun, L. Guo, H. Zhang, J.-Y. Jung, X. Li and J.-H. Lee, J. Mater. Chem. A, 2017, 5, 13994–14002 RSC.
- S. Cai, Z. Meng, H. Tang, Y. Wang and P. Tsiakaras, Appl. Catal., B, 2017, 217, 477–484 CrossRef CAS.
- M. Li, L. Bai, S. Wu, X. Wen and J. Guan, ChemSusChem, 2018, 11, 1722–1727 CrossRef CAS.
- J. Qi, W. Zhang and R. Cao, Chem. Commun., 2017, 53, 9277–9280 RSC.
- B. Chen, X. He, F. Yin, H. Wang, D.-J. Liu, R. Shi, J. Chen and H. Yin, Adv. Funct. Mater., 2017, 27, 1700795 CrossRef.
- S. Wan, J. Qi, W. Zhang, W. Wang, S. Zhang, K. Liu, H. Zheng, J. Sun, S. Wang and R. Cao, Adv. Mater., 2017, 29, 1700286 CrossRef PubMed.
- Z. Chai and C. Jiang, Electrochim. Acta, 2019, 294, 11–21 CrossRef CAS.
- C. Dong, X. Yuan, X. Wang, X. Liu, W. Dong, R. Wang, Y. Duan and F. Huang, J. Mater. Chem. A, 2016, 4, 11292–11298 RSC.
- J. He, A. Cui, F. Ni, S. Deng, F. Shen, C. Song, L. Lou, D. Tian, C. Huang and L. Long, J. Colloid Interface Sci., 2019, 536, 710–721 CrossRef CAS PubMed.
- F. Song and X. L. Hu, Nat. Commun., 2014, 5, 4477 CrossRef CAS PubMed.
- X. Dai, D. Chen, H. Fan, Y. Zhong, L. Chang, H. Shao, J. Wang, J. Zhang and C.-n. Cao, Electrochim. Acta, 2015, 154, 128–135 CrossRef CAS.
- D. Friebel, M. W. Louie, M. Bajdich, K. E. Sanwald, Y. Cai, A. M. Wise, M. J. Cheng, D. Sokaras, T. C. Weng, R. Alonso-Mori, R. C. Davis, J. R. Bargar, J. K. Norskov, A. Nilsson and A. T. Bell, J. Am. Chem. Soc., 2015, 137, 1305–1313 CrossRef CAS PubMed.
- M. Gong, Y. Li, H. Wang, Y. Liang, J. Z. Wu, J. Zhou, J. Wang, T. Regier, F. Wei and H. Dai, J. Am. Chem. Soc., 2013, 135, 8452–8455 CrossRef CAS PubMed.
- D. Xu, M. B. Stevens, Y. Rui, G. DeLuca, S. W. Boettcher, E. Reichmanis, Y. Li, Q. Zhang and H. Wang, Electrochim. Acta, 2018, 265, 10–18 CrossRef CAS.
- X. Cui, B. Zhang, C. Zeng, H. Wen and S. Guo, Int. J. Hydrogen Energy, 2018, 43, 15234–15244 CrossRef CAS.
- H. Dau, C. Limberg, T. Reier, M. Risch, S. Roggan and P. Strasser, ChemCatChem, 2010, 2, 724–761 CrossRef CAS.
- M. S. Burke, M. G. Kast, L. Trotochaud, A. M. Smith and S. W. Boettcher, J. Am. Chem. Soc., 2015, 137, 3638–3648 CrossRef CAS PubMed.
- L. Bai, C.-S. Hsu, D. T. Alexander, H. M. Chen and X. Hu, J. Am. Chem. Soc., 2019, 141, 14190–14199 CrossRef CAS.
- H. Jin, S. Mao, G. Zhan, F. Xu, X. Bao and Y. Wang, J. Mater. Chem. A, 2017, 5, 1078–1084 RSC.
- L. Gong, X. Y. E. Chng, Y. Du, S. Xi and B. S. Yeo, ACS Catal., 2018, 8, 807–814 CrossRef CAS.
Footnotes |
| † Electronic supplementary information (ESI) available. See DOI: 10.1039/c9se00928k |
| ‡ These authors contributed equally to this work. |
| This journal is © The Royal Society of Chemistry 2020 |

