 Open Access Article
Creative Commons Attribution 3.0 Unported Licence
Hydrogen production from natural gas and biomethane with carbon capture and storage – A techno-environmental analysis†
Cristina
Antonini‡
 a,
Karin
Treyer‡
 b,
Anne
Streb
 a,
Mijndert
van der Spek
 ac,
Christian
Bauer
 b and
Marco
Mazzotti
 *a
*a
aSeparation Processes Laboratory, Department of Mechanical and Process Engineering, ETH Zurich, Zurich 8092, Switzerland. E-mail: marco.mazzotti@ipe.mavt.ethz.ch
bLaboratory for Energy Systems Analysis, Paul Scherrer Institute, 5232 Villigen PSI, Switzerland
cResearch Centre for Carbon Solutions, School of Engineering & Physical Sciences, Heriot-Watt University, EH12 4AS Edinburgh, UK
First published on 11th March 2020
Abstract
This study presents an integrated techno-environmental assessment of hydrogen production from natural gas and biomethane, combined with CO2 capture and storage (CCS). We have included steam methane reforming (SMR) and autothermal reforming (ATR) for syngas production. CO2 is captured from the syngas with a novel vacuum pressure swing adsorption (VPSA) process, that combines hydrogen purification and CO2 separation in one cycle. As comparison, we have included cases with conventional amine-based technology. We have extended standard attributional Life Cycle Assessment (LCA) following ISO standards with a detailed carbon balance of the biogas production process (via digestion) and its by-products. The results show that the life-cycle greenhouse gas (GHG) performance of the VPSA and amine-based CO2 capture technologies is very similar as a result of comparable energy consumption. The configuration with the highest plant-wide CO2 capture rate (almost 100% of produced CO2 captured) is autothermal reforming with a two-stage water-gas shift and VPSA CO2 capture – because the latter has an inherently high CO2 capture rate of 98% or more for the investigated syngas. Depending on the configuration, the addition of CCS to natural gas reforming-based hydrogen production reduces its life-cycle Global Warming Potential by 45–85 percent, while the other environmental life-cycle impacts slightly increase. This brings natural gas-based hydrogen on par with renewable electricity-based hydrogen regarding impacts on climate change. When biomethane is used instead of natural gas, our study shows potential for net negative greenhouse gas emissions, i.e. the net removal of CO2 over the life cycle of biowaste-based hydrogen production. In the special case where the biogas digestate is used as agricultural fertiliser, and where a substantial amount of the carbon in the digestate remains in the soil, the biowaste-based hydrogen reaches net-negative life cycle greenhouse gas emissions even without the application of CCS. Addition of CCS to biomethane-based hydrogen production leads to net-negative emissions in all investigated cases.
Introduction
To reach the Paris climate goal of limiting global warming to 1.5 °C or 2 °C, quick and large scale decarbonisation in all sectors of our economies is required.1 In many decarbonisation scenarios, hydrogen is foreseen to play a large role as an energy carrier, feedstock and fuel, for use in heating, in industry, or in transport.2 Whilst much of the literature focuses on hydrogen production by water electrolysis, the vast majority of hydrogen is currently produced by reforming or gasification of fossil fuels.3,4 In combination with CO2 capture and storage (CCS), fossil-based hydrogen (popularly referred to as “blue hydrogen”) could act as a low-carbon alternative to electrolysis-based hydrogen (whose carbon footprint depends on the carbon intensity of the electricity used). The use of biomass instead of fossil fuels as a feedstock for reforming or gasification with CCS might even lead to a net removal of CO2 from the atmosphere, or so-called “negative” emissions. Woody biomass or parts of household waste could be used for gasification. For reforming, upgraded biogas, i.e. biomethane, could be used as feedstock. In Europe, biogas is mainly produced through anaerobic digestion of agricultural or industrial residues, biowaste and municipal organic waste, or sewage sludge.5There are several production pathways that combine reforming or gasification of either fossil or biomass fuels with CCS,6–9 which differ in terms of CO2 capture rate, energy penalty for CO2 separation, environmental footprint and costs. The choices include the type of feedstock, which hydrogen production process to use, which carbon capture technology to apply, and how to best integrate these elements into a well-designed hydrogen production and supply system. It is good practice to evaluate the technical and environmental performance of such pathways through process simulation and Life Cycle Assessment (LCA), which are comprehensive methods to quantitatively investigate the merits of processes and products.
Existing literature on techno-environmental footprint of hydrogen production
The environmental footprint of electrolysis as a potentially clean hydrogen production technology is well understood and a vast body of technical, economic and LCA studies on this production route are available.10–13 These show that the carbon-footprint of hydrogen from electrolysis is dominated by the source of electricity used:3,11,12,14,15 Only using low-carbon electricity such as hydro or wind power allows for a substantial reduction of greenhouse gas (GHG) emissions compared to hydrogen from natural gas reforming.Conversely, only few studies exist on the combined technical and environmental assessment of hydrogen production from natural gas or biomethane with CCS. The few results suggest that the life cycle Global Warming Potential (GWP) reduction of adding CCS to steam reforming plants varies from 35% to over 100%,16,17 although the latter performance was only achieved by accounting for replacement of greenhouse gas (GHG) intensive grid electricity with low-carbon electricity produced by the fully abated steam reformer.16 The existing studies more often focus on techno-economics,8,17–20 and show that at a hydrogen cost increase of between 20–60 percent, roughly 55% to 90% of plant-wide CO2 emissions can be captured.
A variety of publications assessing the environmental impacts of biomass-based hydrogen production exists, mainly focussing on biomass gasification and in most cases neglecting CCS as a further decarbonisation option. In addition, the majority of the studies cover energy crops or crop residues, but not the use of biogenic waste. A recent study21 analyses the life-cycle greenhouse gas emissions of H2 production via indirect biomass gasification including CO2 capture. It shows that by making use of short-rotation poplar feedstock combined with CO2 capture, a net removal of CO2 from the atmosphere can be achieved. In contrast, studies on biogas (BG) production with various feedstocks usually do not include a full carbon (C) balance. A cut-off approach is normally adopted, where the BG comes burden-free and the C emissions from production and use of the BG are accounted for as positive emissions (e.g.ref. 22–25).
Regarding methodological aspects, Valente et al.3,7,26 developed a harmonized approach for LCA of hydrogen production technologies, covering electrochemical, thermochemical and biological processes. They defined and applied a procedure that includes the use of cradle-to-gate system boundaries, including compression up to 200 bar, and the use of an attributional LCA approach. The functional unit they suggest is industrial grade hydrogen (>99% pure) and in case of attributional assessment, they advise using system expansion when hydrogen is the main product, and economic allocation if hydrogen is a by-product. Application of the suggested procedure should increase comparability of LCA results from existing and forthcoming studies on hydrogen production. Valente et al. applied their harmonized framework to 139 case studies on hydrogen from 65 different works.3 For the case studies on thermochemical conversion, the majority showed an increase in global warming potential when the harmonized method was applied. This was true also for the biological case studies, but less so for the electrochemical cases. One of the main causes of this increase was the inclusion of the hydrogen compression stage. With respect to acidification potential (AP),26 inclusion of capital goods appeared to be a key driver. Also, the influence of how to take into account by-products of biogas generation (i.e. digestate potentially replacing fertilisers) is large for AP, if economic allocation is used for subdivision of processes using biogenic feedstocks as inputs. Their general conclusion is that the GHG emissions of electrochemical hydrogen production are smaller than those of thermochemical production from bio-resources, which are in turn smaller than those of thermochemical production from natural gas, assuming all are unabated (i.e. no CCS is applied).
Scope of this study
We perform a cradle-to-gate investigation of hydrogen production from natural gas (NG) and from biomethane (BM). The latter is upgraded from biogas generated via anaerobic digestion of biogenic waste. Both steam methane reforming (SMR) and autothermal reforming (ATR) are combined with novel as well as existing CO2 capture technologies. One of the novelties include the integration of vacuum pressure swing adsorption (VPSA) – a technology that integrates hydrogen purification and CO2 capture into a single adsorption cycle27 – into hydrogen plants and the use of rigorous process optimization to identify optimal performance of hydrogen production facilities with CO2 capture. Another element of novelty here is the investigation of the potential for negative emissions when producing hydrogen from biomethane combined with CCS. Our analysis is undertaken as a detailed integrated techno-environmental modelling exercise, which allows for a seamless connection between the mass and energy flows from the process simulation models and the Life Cycle Inventories (LCI), aimed at investigating the environmental merits of many different cases based on physically sound data inputs (as advocated in e.g., ref. 18,27 and 28).In the next sections, we present the hydrogen and carbon capture technologies considered, followed by a detailed process modelling description. Next, we describe the LCA methodology. The main findings are presented and discussed in the last section. ESI† and detailed technical and LCI data as well as Life Cycle Impact Assessment (LCIA) results including Jupyter Notebooks used for the LCA calculations are presented in the ESI.†
Technologies
Hydrogen production via steam methane reforming
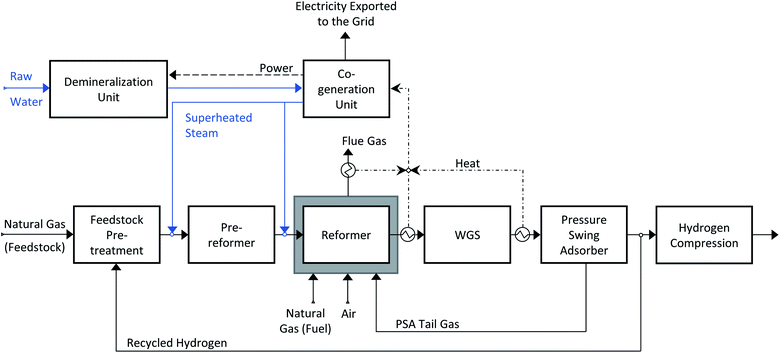
Nowadays, hydrogen is produced on a large scale via natural gas reforming. The state-of-the-art technology is steam methane reforming (SMR), where methane reacts with steam to produce a hydrogen-rich syngas. A schematic representation of the production process is shown in Scheme 1. First, the feedstock is desulfurized in a pre-treatment section and then pre-reformed with some steam, to decompose the long-chain hydrocarbons into methane and syngas. Inside the main reforming reactor, methane is converted into hydrogen and carbon monoxide (reaction (1)). The reforming reaction is endothermic and therefore a heat source is needed. In an SMR production plant, the heat is provided by an external furnace (the grey box surrounding the reformer in Scheme 1). The hydrogen yield is further increased in the water gas shift section (WGS), where part of the carbon monoxide reacts with water to produce hydrogen and carbon dioxide (reaction (2)).| CH4 + H2O → 3H2 + CO, ΔH0298 = 206 kJ mol−1 | (1) |
| CO + H2O → CO2 + H2, ΔH0298 = −41.1 kJ mol−1 | (2) |
Multiple configurations exist for the WGS section, where here the choice is mostly between one or two reactors. A high temperature water-gas shift reactor is commonly included, and after that a low temperature water-gas shift reactor (LT WGS) can be added. The addition of the LT WGS allows to reach higher CO conversion and as a consequence, the hydrogen yield increases. Once the hydrogen-rich syngas leaves the WGS section, it needs to be purified. The technology used is pressure swing adsorption (PSA), which allows to separate hydrogen from the other components. The purified hydrogen stream is successively compressed to 200 bar (following Valente et al.3), while the impurities are collected in the PSA tail stream and burnt with air and additional natural gas in the reformer furnace. In the case CO2 is not captured, it exits the production plant with the flue gas produced by the furnace. The high-pressure steam required in the reforming and shift reactions (1) and (2) is co-generated by means of heat integration. The excess steam is sent to the turbine section to generate electricity, which is then used to run the auxiliaries of the production plant. When the electricity production exceeds the consumption, the surplus is supplied to the grid. The chemical reactions involved in the production process need specific catalysts. The desulphurization process is performed on a ZnO bed, pre- and primary reforming take place on a Ni-based catalytic bed, while for the HT and LT water-gas shift reactors a Fe–Cr and a Cu–Zn bed are used, respectively.29,30
Hydrogen production via autothermal reforming
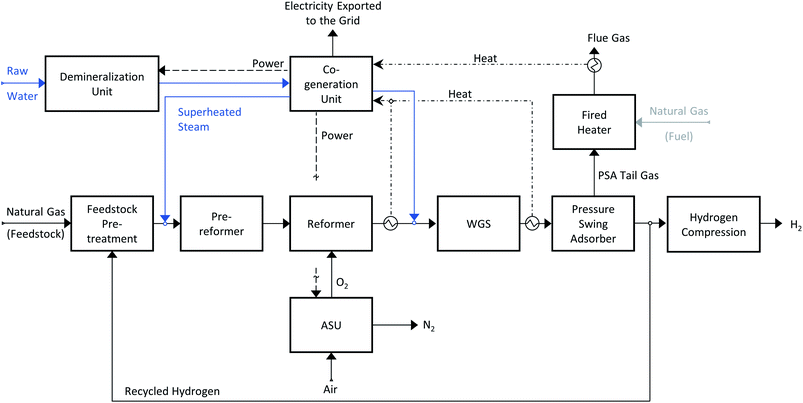
The other commercialized hydrogen production technology analysed here is autothermal reforming (ATR). A schematic representation of an ATR plant is shown in Scheme 2. Contrary to an SMR plant, the reaction heat is provided within the reaction vessel and therefore no external furnace is required. In the reforming reactor, methane is partially oxidized by oxygen and the generated heat drives the endothermic steam reforming reaction (1). In principle, air could be used as oxygen source, but to avoid the contamination of hydrogen with nitrogen, pure oxygen is used, hence an air separation unit (ASU) unit is needed. As for the SMR process, the syngas is shifted with steam and then the raw hydrogen is purified in a PSA unit. The PSA tail gas is burnt in a small fired heater. The generated heat is used to pre-heat the feed streams and to provide some additional heat to the co-generation section. We did not consider the option of burning additional natural gas together with the PSA tail gas. Similar catalysts as for steam methane reforming are used.30,31Hydrogen production with carbon dioxide capture
In an SMR plant, there are two sources of carbon dioxide: first (∼60%) from the oxidation of the carbon atoms present in the feedstock during reforming and shift, and second (∼40%) from the combustion occurring in the reformer furnace. Therefore, by applying pre-combustion capture, only the CO2 present in the syngas can be captured, while a post-combustion plant would be needed to capture all the CO2 in the flue gas. In an ATR plant, the only source of direct CO2 emissions is the combustion of the PSA-tail gas in the fired heater. Therefore, by adding a pre-combustion capture plant to recover the CO2 from the syngas, the majority of the direct CO2 emissions could be avoided. As investigated by the International Energy Agency Greenhouse Gas (IEAGHG), many different SMR processes with CCS options are available;8 that study showed the classical CO2 pre-combustion capture from the syngas to be the most economical option. Therefore, in this work, we considered pre-combustion CO2 capture. Two different capture technologies were investigated; state-of-the-art amine-based absorption and novel vacuum pressure swing adsorption (VPSA).State-of-the-art pre-combustion CO2 capture technology
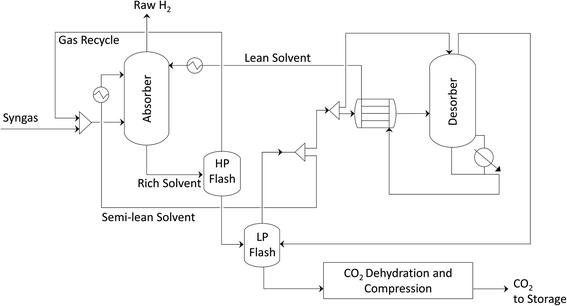
The benchmark pre-combustion CO2 capture technology is amine-based absorption. Methyl diethanolamine (MDEA) is a widely used solvent for capturing CO2 from high-pressure gaseous streams. A schematic representation of a state-of-the-art hydrogen production plant with carbon capture is shown in Scheme 3. The co-generation section within the plant provides the power and the low-pressure steam needed to run the CO2 capture unit. A schematic representation of the MDEA capture plant is shown in Scheme 4. The syngas is fed at the bottom of the absorption column while the aqueous MDEA solution is introduced from the top. The CO2 is absorbed in the liquid phase and the raw hydrogen leaves from the top of the column. However, also some other gaseous components, like CO, CH4, N2 and H2, dissolve slightly in the liquid solution. To remove them, the pressurized liquid stream is expanded in the first flash (high-pressure flash). The gaseous impurities are recycled back to the absorber while the CO2-rich liquid stream is sent to regeneration. The solvent is regenerated twice, first physically in the low-pressure flash and then thermally in the desorption column (stripper); the CO2-rich liquid stream is mixed in the low-pressure flash with the CO2-rich gaseous stream coming from the regeneration column. The change in pressure and temperature favoured the desorption of CO2 from the liquid phase. The partially regenerated liquid stream is split and part of it is recycled back to the absorption column, whereas the rest is fed into the desorption column to be thermally regenerated. The regenerated solvent is recycled back to the absorption column while the CO2 stream leaving the capture plant is dried and then compressed to 110 bar.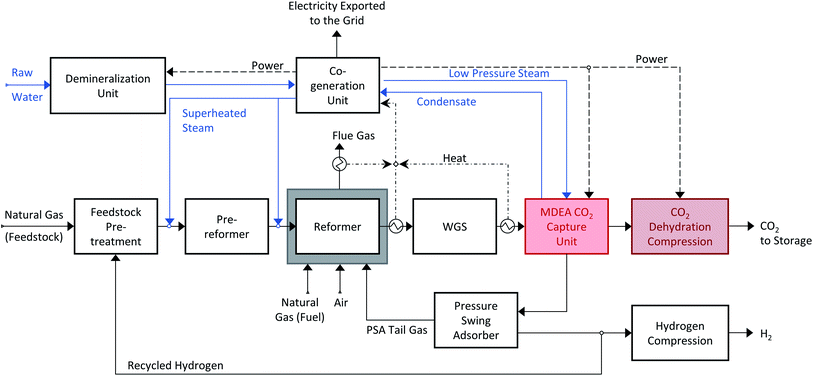 | ||
| Scheme 3 Hydrogen production via steam methane reforming with MDEA CO2 capture. The SMR process scheme is adapted to accommodate the addition of the capture unit before the PSA unit. CO2 is recovered from the shifted syngas, and subsequently dehydrated and compressed to be suitable for geological storage. The raw hydrogen is purified in the PSA unit and the tail gas is burnt in the external furnace, as in Scheme 1. | ||
Novel separation technology: VPSA
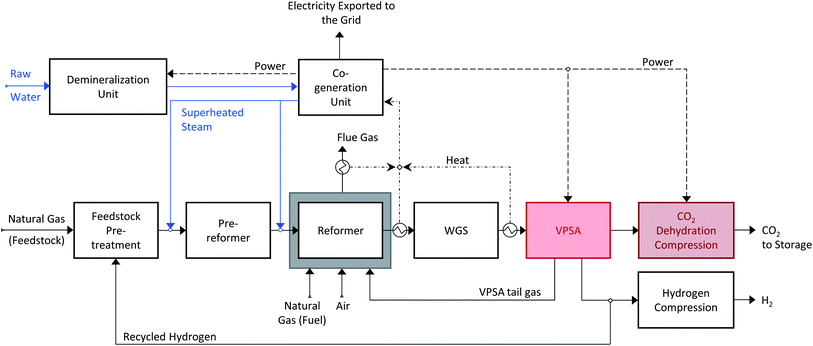
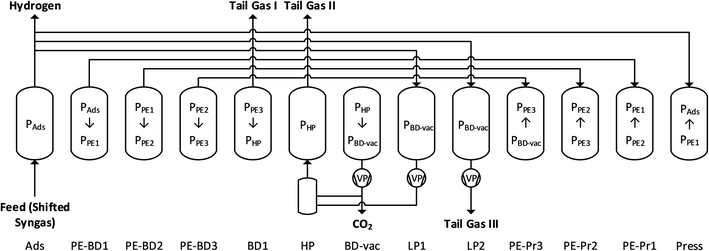
An alternative for capturing CO2 from the syngas is shown in Scheme 5: CO2 capture and hydrogen purification are combined in a single separation stage instead of two, using an innovative vacuum pressure swing adsorption (VPSA) cycle.27,32 The VPSA cycle used here is shown in Scheme 6 and consists of a high pressure adsorption step (Ads), during which high purity H2 is produced, a sequence of pressure equalization steps (PE-BD and PE-Pr), light (LP1, LP2) and heavy (HP) product recycle and purge and a CO2 withdrawal under vacuum (BD-vac). In addition to the two products, i.e. hydrogen and CO2, a tail gas with a high calorific value is produced. For a detailed explanation of the different steps and the cycle development, we refer to the literature.27,32 Replacing the state-of-the-art two-unit configuration (MDEA and PSA) with a single VPSA unit can be expected to lead to a significant reduction in process complexity and potentially also in capital cost. An additional advantage is that the VPSA technology could be retrofitted to already existing H2 production facilities partly reusing existing equipment and knowhow from the existing PSA unit for H2 purification.Process modelling
The assumptions made in developing the different process models in this work are derived mainly from IEAGHG,8 EBTF33,34 and CEMCAP.35 The main general assumptions are provided in the ESI.†Steam methane reforming
The SMR flowsheets are modelled in Aspen Plus V 8.6 following case 1A described in the IEAGHG report on standalone hydrogen production.8 The main input assumptions are reported in the ESI. The pre-reformer is modelled adiabatically with an inlet temperature of 773 K, while the reformer is operated isothermally at 1185 K. The water-gas-shift reactors are modelled at equilibrium, where the inlet temperatures are set at 593 and 453 K for high- and low-temperature respectively. The steam to carbon ratio (S/C) at the pre-reformer inlet is set to 2.6. The amount of feedstock used varies among the different case studies to obtain a constant production of 300 MW of hydrogen. The PSA separation unit, is modelled as a separator using literature data;8 the syngas compositions obtained by the Aspen Plus simulations reflect the compositions reported in the IEAGHG report, therefore using the same PSA performance is considered a reasonable assumption.Autothermal reforming
Like the SMR, the ATR is modelled in Aspen PlusV 8.6. The main input assumptions are provided in the ESI. The pre-reformer and reformer inlet temperatures are 773 K and 973 K, respectively. The inlet temperatures of the HT and LT water-gas shift reactors are set at 593 K and 453 K.30,31 The steam to carbon ratio (S/C) at the pre-reformer inlet is set to 1.5, and the oxygen to carbon ratio (O/C) is set to 0.53, based on literature.30,31 The oxygen that is fed to the reformer is assumed to have a purity of 99.5%, with the make-up being argon, and an energy consumption of 265 kWh per t O2, based on ref. 36 and 37. As for the SMR, also for the ATR cases the amount of feedstock used is varied to obtain a constant production of 300 MW of hydrogen. As the syngas compositions in the SMR and ATR configurations are very similar, the same PSA literature data is used here to model the split fraction of all species except argon.8 For argon, we assume 90% of it to remain in the hydrogen stream, informed by the separation performance calculated in the VPSA simulations.MDEA carbon dioxide capture process
The MDEA capture plant is also modelled in Aspen PlusV 8.6. The two columns, absorber and desorber, are modelled with equilibrium stage calculations. The vapour phase is described using the Redlich–Kwong equation of state, while for the liquid phase the ELECNRTL model provided by Aspen Plus is selected. For the compression section, the vapour phase is described by Peng–Robinson equation of state, while the description of the condensed water is described using the steam table option provided by the software. The optimal configuration of the MDEA-based CO2 capture for low-carbon hydrogen production is extensively described in a dedicated publication.38 The performance of the CO2 capture process is calculated in terms of CO2 recovery (or CO2 capture rate) ψ and total specific equivalent work ω. We have chosen to use the equivalent work as an energy indicator, because it is directly comparable to the work input to the VPSA unit. The CO2 recovery of the capture unit, ψ, is expressed as the total amount of CO2 captured divided by the amount of CO2 present in the syngas:The total specific equivalent work, ω, is calculated as follows:
where Wtot is the total work, Waux and Wc are the contributions of plant auxiliaries and CO2 compression, respectively, with η being the corresponding auxiliary efficiency coefficients (isentropic and mechanical for compressors, pump and driver efficiencies for pumps). The reboiler duty and temperature are expressed as QR and Treb, respectively. As ambient temperature (Tamb) a value of 282 K is assigned and 10 K is selected as ΔTmin. The optimal operating conditions of the capture plant are found by solving an optimization problem. Four decision variables (xi) are selected: the split fraction of each of the two splitters, the reboiler duty and the liquid to gas (L/G) ratio in the absorber. Their range of investigation is constrained between a lower and an upper bound:
| xmini ≤ xi ≤ xmaxi |
The aim of the optimization problem is to minimize the total specific equivalent work, ω, while maximizing the CO2 recovery, ψ. To formulate the problem in the form of a minimization, the CO2 recovery objective function is expressed as 1/ψ. Therefore, the multi-objective optimization problem is the following:
VPSA carbon dioxide capture process
The VPSA cycle (Scheme 6) is modelled with an in-house Fortran based adsorption simulation toolbox (called FAST), that has been described and validated for a variety of conditions and cycles.39–41 The work required for evacuating and purging the column at sub-atmospheric pressure is computed based on isentropic calculations with a vacuum pump efficiency of 70% for a vacuum of 0.1 bar, and decreasing efficiencies for lower pressures, and is comparable to the equivalent work indicator used for the MDEA model.To optimize the process performance, i.e. minimize the specific energy consumption and maximize the productivity of the VPSA cycle for given purity and recovery specifications and different SMR and ATR syngas compositions, an extensive parametric analysis was carried out as reported earlier.32 As for MDEA, an upper and lower bound for the performance of the VPSA are chosen to account for small variation in e.g. the vacuum pump efficiency or the feed composition. As a base case, the point with the lowest energy consumption for a fixed composition and vacuum pump efficiency is used. Upper and lower bounds are defined combining a 10% higher energy consumption and a lower H2 recovery as worst case for the upper bound, and vice versa for the lower bound. The extreme values for the H2 recovery are set based on the maximum/minimum recoveries reached for feasible points within this range of energy consumptions and are within two percentage points of each other. The purity of hydrogen is larger than 99.97% for both SMR configurations (with and without LT WGS); it is larger than 99.9% for ATR with HT and LT shift. Hydrogen leaves the VPSA unit at 25 bar and it is then further compressed to 200 bar.
Investigated case studies
In the context of this work, 60 cases were modelled (Scheme 8). Our reference system is a hydrogen production unit without CO2 capture and storage, supplied with natural gas (Scheme 1). The effects of adding a CO2 capture unit to the hydrogen production unit are quantified; the captured CO2 is assumed to be permanently stored in geological formations. For each case study with CCS, two CO2 capture rates are considered, namely 90% and 98%, with 90% representing the lower bound of the US-DOE target, while 98% representing an attempt to push towards higher CO2 capture efficiencies. Each configuration with carbon capture is assessed twice, once with the lower-bound energy consumption and once with the corresponding upper-bound. The PSA/VPSA hydrogen recovery is set to be greater than 90%, while the purity target is adapted based on the hydrogen production technology, but is always greater than 99.9%. As alternative to natural gas, the use of biomethane for hydrogen production is analysed; biomethane is produced via upgrading of biogas, generated via anaerobic digestion of biogenic waste. The chemical compositions of natural gas and biomethane considered in this work are listed in Table 1.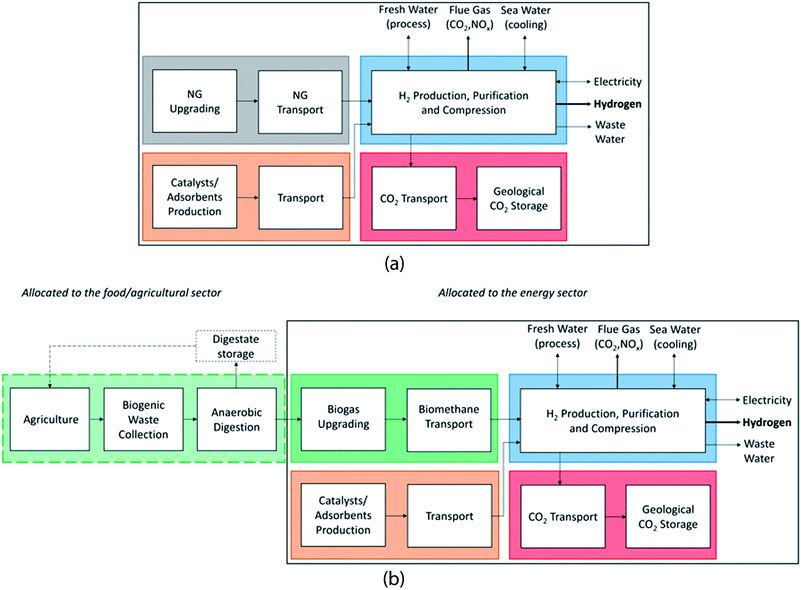 | ||
| Scheme 7 System boundaries and allocation choices for the LCA of H2 production based on natural gas (a) and biomethane (b) with and without CCS. | ||
 | ||
| Scheme 8 Summary of all cases analysed. The different configurations were modelled with natural gas and biomethane, besides the grey ones that where only modelled with natural gas. | ||
| Natural gas | [mol] | CH4 | 0.89 | C2H6 | 0.07 |
| CO2 | 0.02 | C3H8 | 0.01 | ||
| nC4H10 | 0.001 | N2 | 0.009 | ||
| H2S | 5 ppmv | ||||
| LHV | [MJ kg−1] | 46.5 | |||
| Biomethane | [mol] | CH4 | 0.96 | CO | 0.005 |
| CO2 | 0.03 | O2 | 0.005 | ||
| LHV | [MJ kg−1] | 45.4 |
Life cycle assessment
We perform process-based, attributional LCA following ISO standards42,43 and consider26,44 to calculate environmental impacts of different H2 production processes from natural gas or biomethane. Our analysis represents current conditions in terms of process performance and background LCI with a parameter setting in the simulation representative for H2 production in central Europe. Reference flow and functional unit are “Production of 1 MJ of compressed gaseous hydrogen (LHV) at a pressure of 200 bar at ambient temperature, at battery limits of the production facility. The purity is at least 99.97% for the SMR cases and at least 99.9% for the ATR cases which contain an argon (Ar) impurity of 0.08%”. Potential excess electricity is assumed to substitute the average European electricity supply mix, and electricity needs are covered by that mix. LCA calculations are performed with the open source framework Brightway2 (BW2),45 and the corresponding Jupyter Notebooks can be found in the ESI.†Scheme 7 shows the system boundaries and allocation choices for our LCA of H2 production from natural gas or biomethane. Raw material extraction, infrastructure, transport of materials, and emissions are included in the system boundary. In line with the allocation approach chosen in the background database, environmental burdens of activities in the process chain up to and including the biogas production through anaerobic digestion of biowaste are allocated to the processes of growing and harvesting the biomass, and as such to the food and agricultural sector. The plant has a production capacity of 75 kt per a of hydrogen based on a capacity factor of 95%, and the economic life is assumed to be 25 years. The natural gas is delivered from a high-pressure pipeline while we assume that the biogas upgrading facility is located within the H2 production facility. The plant is assumed to be cooled by a once-through seawater cooling system.
Inventory data
We use background LCI from the ecoinvent database, version v3.5, system model “allocation, cut-off by classification”.46 Complete LCI of the foreground system are provided in the ESI† in a format, which can directly be imported into BW2. All these inventories are either from previous work of the authors or resulting from the findings within the current analysis. The inventories include the biogas upgrading process,47 production of H2via the above-mentioned configurations (own data), compression of H2 (own data), transport and geological storage of CO2 (over 200 km per pipeline and in a saline aquifer at a depth of 800 m, respectively)48 and all inventories regarding H2 production via electrolysis.15Life cycle impact assessment
In order to quantify impacts on climate change, we use global warming potentials with a time horizon of 100 years according to IPCC 2013 (ref. 49) as implemented in the ecoinvent database, v3.5. Selected impact categories as described in ILCD 2.0 (2018)50 are used for further evaluation of potential environmental trade-offs. We are covering aspects regarding climate change, ecosystem quality, human health, and resources. We use all LCIA models associated with the highest recommendation level (climate change, ozone depletion, respiratory inorganics) in ref. 50. Additionally, we include some categories of interest which show representative patterns in our evaluation of LCIA results, namely “freshwater and terrestrial acidification”, “carcinogenic effects”, “land use”, “minerals and metals”, and we add the “non-renewable cumulative energy demand (CED)” as the sum of depletion of fossil, nuclear and non-renewable primary forest resources.Biomethane: technologies, carbon balance and biogenic CO2 emissions
As opposed to the inventory data for natural gas supply (which we can be taken from the background database and used directly), we have modified the supply of biogas. We model biogas production from anaerobic digestion (AD) of biogenic waste, and subsequent upgrading to biomethane via amine scrubbing. The latter, can be used as alternative feedstock for hydrogen production. While biogenic waste does not represent the largest potential for biogas production,5,51,52 it has the advantage that it can be easily collected, and subsequently converted in a centralized unit. Anaerobic digestion is the current standard pathway for biogas production in Europe.5 Amine scrubbing for biomethane upgrading can be considered as one of the current standard technologies.53,54 Associated LCI data are taken from the literature.55Biomass is generally considered as a carbon neutral energy resource, because the emissions from biomass processing and combustion are offset during plant growth through CO2 uptake via photosynthesis56 and therefore, in LCA, most often a Global Warming Potential (GWP) of zero is assigned to biogenic CO2 emissions.57,58 However, a GWP of zero does not allow for a correct accounting of impacts on climate change of systems with geologically stored biogenic CO2 – this CO2 has been taken up by biomass before and permanently removed from the atmosphere. Therefore, we use the IPCC 2013 impact assessment with a time horizon of 100 years, which assigns a GWP of −1 to “Carbon dioxide, to soil or biomass stock” and a GWP of 1 to biogenic CO2 emissions.49 This guarantees that permanently storing biogenic CO2 will result in negative CO2 emissions in our calculations. We use green waste from production of yearly crops as feedstock; therefore, long-term impacts of land use change and CO2 uptake (as e.g. in forestry) do not need to be addressed.
Anaerobic digestion of biowaste is a process with multiple outputs: the service of waste treatment and the two co-products, namely biogas and digestate. In the ecoinvent system model “allocation, cut-off by classification”, biogas and digestate are classified as by-products of the biowaste treatment via anaerobic digestion (AD) and therefore considered to be free of environmental burdens (which are allocated to the food and agriculture sector). Consequently, the carbon removed from the atmosphere during biomass growth is not allocated to the biogas in the original inventories46 and this causes a violation of the overall carbon mass balance. In order to answer the question whether negative emissions can be reached or not, a correction of the carbon flows is required (as explained later in this section). The anaerobic digestion of biowaste with its multiple outputs is subject to several uncertainties and variations, which requires subjective (modelling) choices in LCA and affect the overall carbon balance. Uncertainties and variability arise on various physical and technical levels: the digestion process design as such,22–24,59 the feedstock type and characteristics54,59–61 (which have an impact on process performance and biogas composition), the process related carbon emissions, the fate of the digestate (storage, incineration, or use in agriculture),59,61–63 the ability of soil to act as carbon sink,64,65 and finally the potential replacement of mineral fertilizers.62,63,66 Subjective modelling choices include the categorization of feedstock for AD as waste and whether burdens associated with AD are entirely allocated to its function as waste treatment process or also to its products, namely biogas and digestate.25,59
Digestate from anaerobic digestion can be incinerated and in this case the carbon atoms are released to the atmosphere in the form of CO2. As an alternative, it can also be composted and then used in agriculture, or it can be directly used as organic fertilizer, while potentially substituting conventional mineral fertilizers. Use in agriculture can lead to a (partial) temporary or permanent carbon fixation in the soil, i.e. act as a carbon sink.65,67 However, depending on the soil management, erosion might lead to carbon release to the atmosphere.64 On the best of our knowledge, no standard procedures that explain how to deal with soil management and resulting carbon fluxes in LCA are available in the literature. However, suggestions on how to include soil carbon or land use changes into LCA,67,68 and recommendations on how to model potential carbon sinks do exist.64,65,69 Nevertheless, the development of a detailed modelling framework, which includes temporal decay rates and climate impacts would be far beyond the scope of this analysis. Instead, because we believe the topic is of substantial relevance, we perform sensitivity analysis quantifying impacts on climate change for “best and worst case scenarios”. We refrain from quantifying other environmental impacts of the biomethane-based hydrogen production, since this would require not only correcting the carbon balance, but also the flows of all other relevant elements present in the digestate (mainly nitrogen and phosphorous) and their fates after agricultural application, which depend on the chosen agricultural system.70
Our system boundaries and modelling choices can be summarized as follows (see also Scheme 7):
- Multi-output processes in the background system are mostly allocated based on economic revenue resulting in a “burden-free” biogas supply and the inherent violation of mass balances.
- We therefore adjust the carbon flows related to the AD process in order to get a correct carbon balance. This includes CO2 uptake during biomass growth and the carbon atoms present in the products of AD, i.e. digestates and biogas.
- We include all life cycle impacts from the biogas production onwards in our foreground system, i.e. upgrading to biomethane and hydrogen production.
- We assume that the biogas/biomethane/hydrogen facilities are located close to each other so that no long-distance transportation of the (intermediate) products is needed. We allocate all burdens in the upstream chain (growing the biomass, harvest, transports, waste collection) to the biomass, i.e. to the food sector. The primary intention is to grow the biomass for food purposes. This approach would be inappropriate in case of energy crops produced specifically for biogas production.
- This approach does not allow for quantification of Life Cycle Impact Assessment (LCIA) categories other than climate change.
- We assume covered digestate storage without any fugitive emissions. We do not consider several different types of AD plants and digestate handling as e.g. in ref. 24, but cover the full range of fate of carbon in the digestate with our carbon balance variants.
- We exclude the exact temporal behavior of carbon in the soil, but quantify best and worst case scenarios of carbon release to the atmosphere regarding impacts on climate change.
- We exclude substitution of (fossil-based) mineral fertilizers and/or organic fertilizers by the digestate, since the latter becomes a self-standing product due to the subdivision and cut-off procedure applied to the AD process. Therefore, potential environmental burdens and benefits due to digestate application should not be allocated to the biogas.
In Table 2 the products obtained after anaerobic digestion are reported, including the corresponding carbon content (all values are expressed on a dry mass basis). These carbon flows are based on generic average compositions of organic waste and digestate71,72 and on personal information from biogas experts to the authors. Detailed associated data and data sources are provided in the ESI.†
| Mass per kg biowaste treated [kgDM kgDM−1] | C in DM [kg kg−1] | ||
|---|---|---|---|
| Treated product | Biowaste | 1 | 0.37–0.49 |
| By-products | Biogas | 0.32 | 0.42 |
| Digestate, solid | 0.41 | 0.19–0.43 | |
| Digestate, liquid | 0.09 | 0.17–0.38 | |
| Digestate manure | 0.05 | 0.22–0.40 | |
| Compost | No composting takes place | Not specified | |
| Emissions | CO2 | 0.525 | 0.273 |
| CH4 | 0.006 | 0.75 |
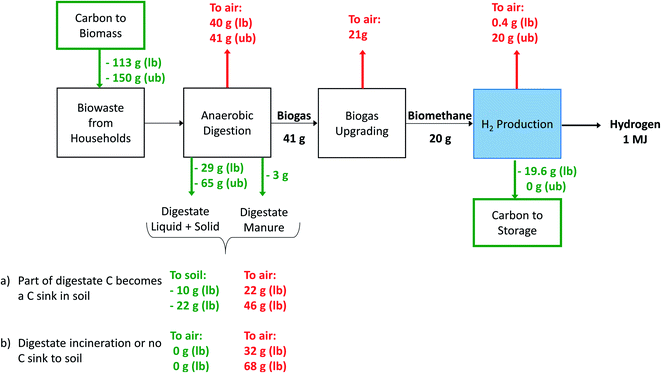
Scheme 9 provides an overview of the carbon flows under varying modeling assumptions for the case of hydrogen production with CCS from biomethane reofrming. We include three different cases: (a1) digestate field application, upper bound (ub) assumption on carbon content and soil sequestration rate; (a2) digestate field application, lower bound (lb) assumption on carbon content and soil sequestration rate; (b) Digestate incineration, lower bound assumption on carbon content. The amount of carbon emitted via biogas upgrading is given by the biogas composition. Therefore, it depends on the carbon content of the digested biowaste. Usually, the methane content in biogas is around 55–60%, and the corresponding carbon content is around 0.53 kg C m−3 (dry weight) (see also Table 2). The carbon atoms that do not leave the biogas upgreater in the form of biomethane, they are emitted in the atmosphere as CO2 or CH4. The carbon content of biomethane is around 0.7 kg C kg−1 (or 0.56 kg C m−3). The mass and energy balances of the hydrogen production process and of the CO2 capture unit come from the simulations introduced in the technical section.
Results and discussions
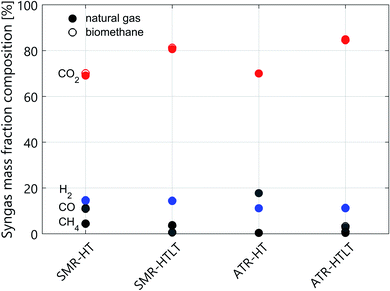
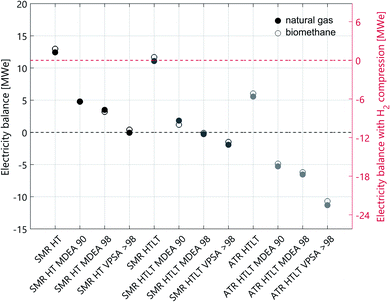
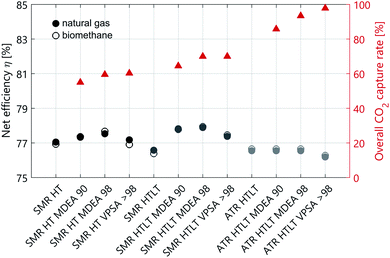
The technology performance of different process configurations for hydrogen production is evaluated based on four key indicators: syngas composition (Fig. 1), excess electricity supply to the grid (Fig. 2), net process efficiency and overall CO2 capture rate (Fig. 3). The net process efficiency is defined as the energy of hydrogen produced, divided by the total energy of natural gas (or biomethane) fed into the system. The LCA results are structured as follows: impacts on climate change of H2 production with natural gas are presented in Fig. 4. Comparative results for other life cycle impact categories are shown in Fig. 5. The comparison between biomethane and natural gas in terms of impacts on climate change is presented in Fig. 6, where the importance of the biomethane supply chain is also highlighted. Finally, we show impacts on climate change of hydrogen production with SMR and ATR as modelled in this analysis compared to hydrogen production via water electrolysis in Fig. 7. Because of the modest variation originating from the implementation of lower- and upper-bound cases to the configurations with CO2 capture (see Fig. A1), only the averages between the two cases are considered in this section.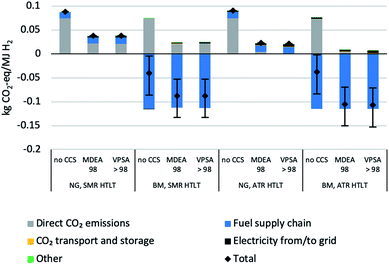 | ||
| Fig. 6 Life cycle climate change impacts of H2 production with natural gas (NG) or biomethane (BM) as feedstock/fuel, shown for the HT + LT configurations and 98% CO2 capture rate in capture unit. Bars reflect the variations modelled in the cases presented in Scheme 9. | ||
Technical performance differences between reforming with and without LT WGS
The addition of a LT shift influences the syngas composition (see Fig. 1), where the CO mass fraction decreases while that of CO2 increases. In the case of SMR with LT WGS, the higher CO conversion translates into a decrease in the amount of feedstock needed per unit of hydrogen produced. However, at the end of the purification step, the unreacted CO leaves the PSA unit in the tail gas stream, which is burnt together with some fuel in the SMR furnace. The more CO is converted into hydrogen, the smaller the calorific value of the tail gas. Therefore, additional fuel has to be burnt in the SMR furnace, and in terms of net efficiency these two effects balance each other out. Indeed, the net efficiency of the two SMR configurations (with and without LT WGS) is almost the same (see Fig. 3 and Table A1). However, the difference between these two processes is more pronounced concerning the electricity balance (see Fig. 2). In the case of SMR with LT WGS, less feedstock is needed to produce the targeted 300 MW of hydrogen. Therefore, the volume of the reacting gaseous stream is smaller. As a consequence, less heat will be released while cooling this steam, resulting in a lower co-production of electricity.In the case of autothermal reforming the difference between the configuration with and without LT WGS is significant, mainly because of the different chemistry involved. As depicted in Fig. 1 the CO content in the case of ATR with only HT shift is substantially higher than in the other three process configurations. Therefore, for ATR with only HT WGS, more feedstock has to be fed to the process to compensate the amount of unreacted CO, resulting in a significant loss in net process efficiency (more than 7 percentage points, see Table A1). Moreover, the higher the CO content in the syngas, the higher the calorific value of the PSA/VPSA tail gas, resulting in a higher co-production of electricity (see Fig. 2).
Hydrogen production with CCS: comparison between MDEA and VPSA
The principal difference between the two CO2 capture technologies is the correlation between capture rate and energy consumption. In the case of MDEA, the energy consumption grows exponentially when increasing the capture rate above ∼97%. This behaviour is a characteristic of solvent-based CO2 capture technologies. For VPSA, however, the relation between CO2 recovery and energy consumption is not as clear, because several constraints in addition to the targeted CO2 recovery have to be fulfilled. These are H2 purity and recovery specifications, as well as CO2 purity. Which constraints are limiting when minimizing the energy consumption depends on different aspects, as for example type and amount of impurities present in the syngas. Indeed, the minimum energy consumption is limited by the purities of both CO2 and H2, but not the recovery rates, and CO2 recoveries greater than 98% are feasible without any additional energy penalty. This is the reason why for all cases with VPSA, the 90% CO2 recovery is not reported. This effect is explained in detail in the literature.32 In terms of electricity balance (see Fig. 2) the SMR configurations MDEA 90 and MDEA 98 are comparable. However, the configurations with VPSA > 98 need more energy. This trend is more pronounced for autothermal reforming. As previously explained, the coupling of hydrogen production with VPSA allows to reach very high CO2 capture rates (see Fig. 3). Indeed, the case of ATR with LT WGS reaches a CO2 recovery of almost 100%.Counterintuitively, the net efficiency of the SMR process increases by adding carbon capture. The reason of this effect is the following: the VPSA tail gas is burnt in the reformer furnace and the more CO2 is captured, the less CO2 will end in the furnace. Consequently, the heating value of the tail gas will be higher and the furnace will require less additional fuel. Besides the CO2 capture rate, also the H2 recovery affects the heating value of the tail gas composition. On the one hand, to be consistent with the reference used to assess the PSA performance,8 a hydrogen recovery of 90% is considered for all cases with MDEA and PSA. On the other hand, in the case of VPSA, the optimal value for the H2 recovery is obtained by solving an optimization problem (see ESI†). In general, the higher the hydrogen recovery, the lower the heating value of the tail gas, and this trend affects the net efficiency of the process, which decreases (see Fig. 3). In the case of autothermal reforming the variation in net efficiency among the four configurations is minimal, because of the absence of an external furnace.
Feedstock comparison: natural gas vs. biomethane
Table 1 reports the molar composition of the natural gas and biomethane streams considered in this work; despite the difference in composition, their heating values are very similar (46.5 vs. 45.4 MJ kg−1). Thus, the difference in process performance between the configurations modelled with the two feedstocks is minimal (see Fig. A1). The same trend is visible in Fig. 2: the electricity balance of the natural gas cases is comparable to the cases modelled with biomethane. We can conclude that the two feedstocks are comparable in terms of process efficiency, whereas the benefit of the biogenic carbon source in case of biomethane is further discussed in the following sections, where the LCA results are presented.Life cycle assessment
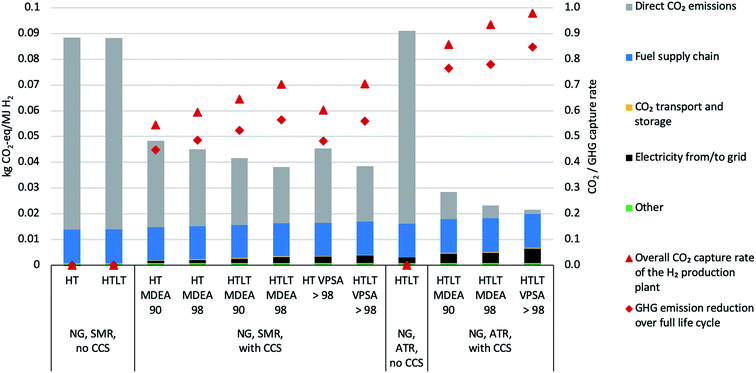
Life Cycle Impact Assessment (LCIA) results have been produced and analyzed for all 40 SMR and 20 ATR cases modelled in the technical part of this paper. Complete results are presented in table format in the ESI.† As differences in environmental impacts between lower, average and upper bound operating conditions are barely visible, we only show results for average operating conditions in the following, starting with a contribution analysis of the life cycle stages during production of H2 from natural gas in various configurations (Fig. 4).The total greenhouse gas (GHG) emissions for natural gas configurations range between 22 g CO2-eq. per MJ (ATR HTLT VPSA > 98) and 48 g CO2-eq. per MJ (SMR HT MDEA 90) with CCS (2.6–5.8 kg CO2-eq. per kg), and amount to around 90 g CO2-eq. per MJ if no CCS is added to the H2 plant (10.8 kg CO2-eq. per kg). ATR performs slightly worse than SMR if no CCS is present, but allows reaching 22 g CO2-eq. per MJ compared to a minimum of 38 g CO2-eq. per MJ for SMR configurations. Most LCA studies on H2 production consider the SMR natural gas case. Unharmonized (and therefore not directly comparable) results from various studies on SMR as shown in e.g.ref. 73 and 74 are in a range of 8.9 to 15.1 kg CO2-eq. per kg without CCS, decreasing to 3.4 kg CO2-eq. per kg when adding CCS. A comparison to the harmonized results in ref. 3 is only possible for the SMR natural gas case without CCS, where a GWP of 12.95 kg CO2-eq. per kg is reported.
The direct CO2 emissions and the fuel supply chain are dominating the results. Introduction of CCS clearly comes with a benefit for the climate, because it yields a minor efficiency loss from a technical perspective and the transport and storage of CO2 in a saline aquifer is associated with very low GHG emissions. Higher CO2 recovery and the addition of a low-temperature water gas shift further decrease the impacts on climate change, even if the electricity requirements increase, and even if this electricity is associated with rather high GHG emissions (ENTSO-E electricity mix with 0.42 kg CO2-eq. per kW per h). The two capture processes MDEA and VPSA exhibit nearly identical performance regarding impacts on climate change, as the decisive contribution categories are technically identical for the two processes. Differences between SMR and ATR are mainly due to different plant-wide CO2 capture rates. In Fig. 4 we also show the life-cycle greenhouse gas capture rate, which ranges from 44% up to 85%.
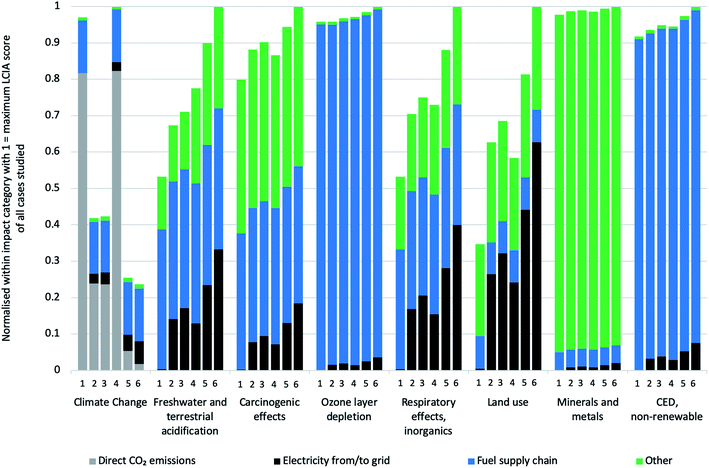
Fig. 5 aims at identifying trade-offs between decreasing impacts on climate change by adding CCS and other potentially increasing impact categories. The full set of results for all ILCD impact categories is provided in the ESI, while the figure only shows trends in representative impact categories. Generally speaking, adding CCS results in (slightly) increasing burdens in all impact categories except that of impacts on climate change. As described in the technical part of this manuscript, adding carbon capture leads – besides decreased direct CO2 emissions – to a minor decrease in energy input into the H2 plant, but inversely to an increase in internal energy needs and thus higher consumption of electricity from the grid. VPSA needs more electricity than MDEA to perform the separation. The direct CO2 emissions do not contribute to any LCIA category except climate change, and all parameters except electricity input remain the same in the various configurations, which is reflected in the LCIA results. SMR without CCS is the only configuration which does not consume electricity from the grid (reflected by the missing black bar for configuration number 4). All these burdens are thus dependent on the type of electricity fed into the H2 plant. The category “Other” is also important and it refers on the one hand to the plant infrastructure, which is the main responsible for such burden, and on the other – but to a lesser extent – to the catalysts and the adsorbents. In order to draw further conclusions, end-uses of the hydrogen compared to competing energy carriers would have to be included, which is out of scope of this analysis.
We further investigate the possibility to reach negative GHG emissions by using biomethane (BM) to produce hydrogen (Fig. 6). If the digestate is used as fertilizer and the carbon is (partially) sequestered in the soil, even in the case without CCS (for both SMR and ATR), negative life cycle GHG emissions can occur. If the digestate is incinerated or if field application of digestate does not lead to a long-term carbon sink, CCS is needed to allow for negative GHG emissions. With CCS, the climate change score may decrease to −125 g CO2-eq. MJ−1 H2 for the “ATR BM, HT + LT; VPSA 98” configuration compared to 25 g CO2-eq. MJ−1 H2 when feeding natural gas. In this context, resource and feedstock potentials need to be considered. While the availability of natural gas as such cannot be considered as limiting factor over the next decades75 and natural gas supply in Europe is constrained rather by network infrastructure and/or potential political issues than by resource availability, biogenic waste available for biomethane and subsequent centralized hydrogen production is limited.5,76–78 To perform an optimal resource allocation, a careful evaluation of all types of biogenic (waste) resources and their potential use in different economic sectors is needed.
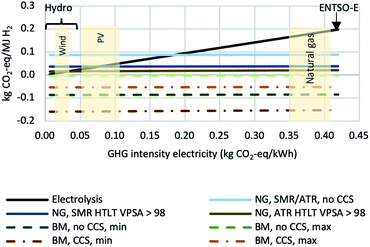
In Fig. 7, the impacts on climate change of hydrogen production with SMR with HT shift and with ATR with both HT and LT shift configurations from both natural gas and biomethane are compared to those of hydrogen production via electrolysis (based on ref. 15). As the latter strongly depends on the greenhouse gas intensity of the electricity required for the process, in order to reflect this correlation, the results are shown as a function of the GHG intensity. Natural gas reforming without CCS is not competitive with H2 production from electrolysis using renewable electricity sources, but compared to electrolysis using the current average European electricity supply (“ENTSO-E”), GHG emissions of natural gas reforming are about 50% lower. Moreover, the addition of CCS reduces GHG emissions to a level similar to electrolysis operated with low-carbon power supply (10–40 g CO2-eq. MJ−1 H2). Hydrogen production from biomethane can even lead to negative GHG emissions and would thus be the preferred option regarding impacts on climate change. All reforming-based production pathways are almost independent of the type of electricity supply (or substitution, respectively, in case of electricity surplus) regarding impacts on climate change, since the amounts of electricity required or substituted, respectively, are comparatively small. Considering the current status of the power sector in most European countries – still heavily relying on fossil generation technologies – and the expected development in the near future,79 these results show that natural gas (and biomethane) reforming with CCS is likely to be the most effective option for large-scale decarbonization of hydrogen production. Only if a substantial amount of so-called “excess electricity” from (intermittent) renewable sources becomes available, hydrogen from electrolysis will be just as effective, and electrolysis will be a meaningful way of avoiding curtailment of intermittent power generation.
Conclusions
Motivated by the urgent need for large quantities of low-carbon energy carriers for effective climate change mitigation, we have performed an integrated techno-environmental assessment of various reforming-based hydrogen production technologies with and without carbon capture and storage using natural gas and biomethane as feedstocks. Based on our integrated approach linking detailed process simulation with life cycle assessment, we are able to quantify benefits and potential trade-offs of a wide range of process configurations from both technical and environmental perspectives in a consistent way.Despite our comprehensive and integrated approach, we acknowledge several limitations in our work, which need to be addressed in the future:
• The CO2 capture unit is optimized separately from the hydrogen production; coupled optimization might lead to slightly different plant performances.
• We have only addressed the use of biogenic waste as feedstock for biogas production with subsequent upgrading to biomethane. These resources are very limited. Further biogenic feedstocks, available in larger quantities such as e.g., manure, dedicated crops and woody biomass for gasification, should be evaluated in a similar way.
• The carbon balance associated with the use of biogenic feedstocks is uncertain and depends on several boundary conditions as mentioned above. Under which circumstances certain agricultural practices and potential land-use changes can act as long-term carbon sinks deserves further attention, i.e. on a case-by-case basis.
• Our analysis is a cradle-to-gate assessment, which does not include end use of hydrogen. Since hydrogen can be used in many ways – as industrial feedstock, for heat and power generation and as transport fuel – LCA including these different options needs to be performed in order to identify the most effective contribution of low-carbon hydrogen to overall decarbonisation of our economy.
Nevertheless, the key outcome of our contribution is summarized as follows. Process simulation results show a clear advantage of ATR against SMR regarding overall CO2 capture rates and the fact that configurations with the novel VPSA technology reach higher CO2 capture rates than those with MDEA. However, higher CO2 capture rates come along with higher electricity requirements. While adding a low-temperature WGS for SMR hardly makes a difference in terms of process efficiencies and capture rates, it is crucial for ATR, which performs rather poorly with high-temperature WGS only. Regarding reduction of direct CO2 emissions, ATR with a low-temperature WGS and VPSA turns out to be the optimal configuration with an overall CO2 capture rate of almost 100%.
From the life cycle perspective, adding CCS results in clear benefits regarding impacts on climate change. In this respect, ATR performs substantially better than SMR due to higher CO2 capture; adding a low-temperature WGS improves the life-cycle performance in general. However, SMR and ATR with CCS perform worse than without CCS regarding other environmental burdens as a result of increasing energy consumption and the (comparatively small) burdens associated with transport and storage of CO2. Life cycle environmental performances of commercial CO2 capture technologies (MDEA) and second-generation technologies (VPSA) are similar for equivalent CO2 capture rates.
Comparing natural gas and biowaste-based biomethane as feedstocks for hydrogen production shows only very minor differences on the technical level. However, regarding life-cycle impacts on climate change, biomethane performs substantially better. On the one hand, geological storage of CO2, which has been removed from the atmosphere by photosynthesis, can be accounted for as negative CO2 emission; on the other hand, field application of digestate, a by-product of anaerobic digestion of biogenic waste, can lead to a (partial) long-term fixation of carbon in the soil, thus acting as carbon sink as well. Therefore, using biomethane as feedstock can, under certain circumstances, lead to negative life-cycle greenhouse gas emissions even without CCS – with CCS, the likelihood of negative emissions is much higher.
These results clearly show that reforming-based hydrogen with CCS must be considered as a clean energy carrier in any successful decarbonisation scenario – even more so, as its life-cycle greenhouse gas emissions are most often lower than those of hydrogen from electrolysis considering the current electricity supply in most European countries, which is still largely based on fossil fuels. Only in the case of large quantities of so-called excess electricity from intermittent renewables, should electrolysis be considered as an equally valid option in the future.
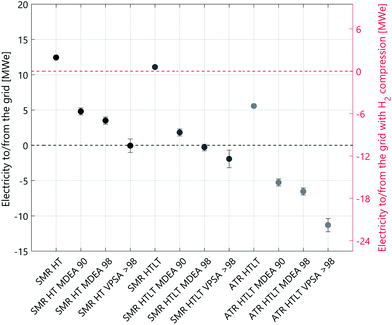 | ||
| Fig. 8 Electricity balance for all cases analysed. The configurations with carbon capture include both lower and upper bounds, indicated by the black bar, and the coloured dot is the average. | ||
| Total hydrogen produced: 300 MW | ||||||||||||||
|---|---|---|---|---|---|---|---|---|---|---|---|---|---|---|
| SMR + HT | SMR + HT + LT | ATR + HT | ATR + HT + LT | |||||||||||
| No Cap. | MDEA 90 | MDEA 98 | VPSA > 98 | No Cap. | MDEA 90 | MDEA 98 | VPSA > 98 | No Cap. | No Cap. | MDEA 90 | MDEA 98 | VPSA > 98 | ||
| Electricity surplus [MWe] | NG | 12.4 | 4.8 | 3.5 | 0.5 | 11.1 | 1.8 | −0.3 | −1.9 | 16.2 | 5.6 | −5.3 | −6.5 | −11.3 |
| BM | 13.0 | 4.8 | 3.2 | 0.4 | 11.7 | 1.2 | −0.1 | −1.5 | — | 6.0 | −4.9 | −6.2 | −10.7 | |
| Net efficiency H2/CH4 (LHV) [%] | NG | 77.1 | 77.8 | 77.9 | 77.2 | 76.6 | 77.3 | 77.5 | 77.4 | 69.5 | 76.6 | 76.6 | 76.6 | 76.2 |
| BM | 76.9 | 77.4 | 77.7 | 76.9 | 76.4 | 77.8 | 77.9 | 77.5 | — | 76.7 | 76.7 | 76.7 | 76.3 | |
Appendix
Conflicts of interest
There are no conflicts to declare.Acknowledgements
ACT ELEGANCY, Project No 271498, has received funding from DETEC (CH), BMWi (DE), RVO (NL), Gassnova (NO), BEIS (UK), Gassco, Equinor and Total, and is cofunded by the European Commission under the Horizon 2020 programme, ACT Grant Agreement No 691712. This project is supported by the pilot and demonstration programme of the Swiss Federal Office of Energy (SFOE). In addition, this work was partially funded by the Commission for Technology and Innovation in Switzerland (CTI) within the Swiss Competence Centres for Efficient Technologies and Systems for Mobility and Energy Research in Heat and Electricity Storage.Notes and references
-
IPCC, Summary for Policymakers, in Global warming of 15 °C An IPCC Special Report on the impacts of global warming of 15 °C above pre-industrial levels and related global greenhouse gas emission pathways, in the context of strengthening the global response to the threat of climate change, ed. V. Masson-Delmotte, P. Zhai, H. O. Pörtner, D. Roberts, J. Skea, P.R. Shukla, A. Pirani, W. Moufouma-Okia, C. Péan, R. Pidcock, S. Connors, J. B. R. Matthews, Y. Chen, X. Zhou, M. I. Gomis, E. Lonnoy, T. Maycock and M. Tignor TW, Geneva, Switzerland, 2018, p. 32 Search PubMed
.
-
IEA, World Energy Outlook, Paris, 2018 Search PubMed
.
- A. Valente, D. Iribarren and J. Dufour, Harmonised life-cycle global warming impact of renewable hydrogen, J. Cleaner Prod., 2017, 149, 762–772 CrossRef CAS
.
- B. Parkinson, M. Tabatabaei, D. C. Upham, B. Ballinger, C. Greig and S. Smart,
et al., Hydrogen production using methane: Techno-economics of decarbonizing fuels and chemicals, Int. J. Hydrogen Energy, 2018, 43(5), 2540–2555 CrossRef CAS
.
- N. Scarlat, J. F. Dallemand and F. Fahl, Biogas: Developments and perspectives in Europe, Renewable Energy, 2018, 129, 457–472 CrossRef
.
- A. Valente, D. Iribarren and J. Dufour, Life cycle sustainability assessment of hydrogen from biomass gasification: A comparison with conventional hydrogen, Int. J. Hydrogen Energy, 2019, 1–11 Search PubMed
.
- A. Valente, D. Iribarren and J. Dufour, Harmonising the cumulative energy demand of renewable hydrogen for robust comparative life-cycle studies, J. Cleaner Prod., 2018, 175, 384–393 CrossRef CAS
.
-
IEAGHG, Techno - Economic Evaluation of SMR Based Standalone (Merchant) Hydrogen Plant with CCS, 2017/02, February 2017 Search PubMed
.
- J. F. Morgado, R. Quinta-Ferreira, S. Amini, S. M. Nazir and O. Bolland, Techno-economic assessment of chemical looping reforming of natural gas for hydrogen production and power generation with integrated CO2 capture, Int. J. Greenhouse Gas Control, 2018, 78, 7–20 CrossRef
.
- E. Cetinkaya, I. Dincer and G. F. Naterer, Life cycle assessment of various hydrogen production methods, Int. J. Hydrogen Energy, 2012, 37(3), 2071–2080 CrossRef CAS
.
- R. Bhandari, C. A. Trudewind and P. Zapp, Life cycle assessment of hydrogen production via electrolysis – a review, J. Cleaner Prod., 2014, 85, 151–163 CrossRef CAS
.
- I. Dincer and C. Acar, Review and evaluation of hydrogen production methods for better sustainability, Int. J. Hydrogen Energy, 2015, 40(34), 11094–11111 CrossRef CAS
.
- D. Parra, X. Zhang, C. Bauer and M. K. Patel, An integrated techno-economic and life cycle environmental assessment of power-to-gas systems, Appl. Energy, 2017, 193 Search PubMed
.
- A. P. Borole and A. L. Greig, Life-Cycle Assessment and Systems Analysis of Hydrogen Production, Biohydrogen, 2019, 485–512 Search PubMed
.
- X. Zhang, C. Bauer, C. L. Mutel and K. Volkart, Life Cycle Assessment of Power-to-Gas: Approaches, system variations and their environmental implications, Appl. Energy, 2017, 190, 326–338 CrossRef CAS
.
- Y. Khojasteh Salkuyeh, B. A. Saville and H. L. MacLean, Techno-economic analysis and life cycle assessment of hydrogen production from natural gas using current and emerging technologies, Int. J. Hydrogen Energy, 2017, 42(30), 18894–18909 CrossRef CAS
.
- C. Fernández-Dacosta, M. Van Der Spek, C. R. Hung, G. D. Oregionni, R. Skagestad and P. Parihar,
et al., Prospective techno-economic and environmental assessment of carbon capture at a refinery and CO2 utilisation in polyol synthesis, J. CO2 Util., 2017, 21, 405–422 CrossRef
.
- G. D. Marcoberardino, D. Vitali, F. Spinelli and M. Binotti, Green Hydrogen Production from Raw Biogas: A Techno-Economic Investigation of Conventional Processes Using Pressure Swing Adsorption Unit, Processes, 2018, 6(3), 19 CrossRef
.
-
IEA, Technology Roadmap. Hydrogen and Fuel Cells, Paris, 2015 Search PubMed
.
- J. C. Meerman, E. S. Hamborg, T. van Keulen, A. Ramírez, W. C. Turkenburg and A. P. C. Faaij, Techno-economic assessment of CO2 capture at steam methane reforming facilities using commercially available technology, Int. J. Greenhouse Gas Control, 2012, 9, 160–171 CrossRef CAS
.
- A. Susmozas, D. Iribarren, P. Zapp, J. Linβen and J. Dufour, Life-cycle performance of hydrogen production via indirect biomass gasification with CO 2 capture, Int. J. Hydrogen Energy, 2016, 41(42), 19484–19491 CrossRef CAS
.
- W. M. Budzianowski and K. Postawa, Renewable energy from biogas with reduced carbon dioxide footprint: Implications of applying different plant configurations and operating pressures, Renewable Sustainable Energy Rev., 2017, 68, 852–868 CrossRef CAS
.
- J. Daniel-Gromke, J. Liebetrau, V. Denysenko and C. Krebs, Digestion of bio-waste - GHG emissions and mitigation potential, Energy, Sustainability and Society, 2015, 5(1), 1–12 CrossRef
.
- J. Bacenetti and M. Fiala, Carbon footprint of electricity from anaerobic digestion plants in Italy, Environ. Eng. Manage. J., 2015, 14(7), 1495–1502 CrossRef CAS
.
- K. A. Lyng and A. Brekke, Environmental life cycle assessment of biogas as a fuel for transport compared with alternative fuels, Energies, 2019, 12(3), 532–544 CrossRef CAS
.
- A. Valente, D. Iribarren and J. Dufour, Harmonising methodological choices in life cycle assessment of hydrogen: A focus on acidification and renewable hydrogen, Int. J. Hydrogen Energy, 2019, 44(35), 19426–19433 CrossRef CAS
.
- A. Streb, M. Hefti, M. Gazzani and M. Mazzotti, Novel Adsorption Process for Co-Production of Hydrogen and CO2 from a Multicomponent Stream, Ind. Eng. Chem. Res., 2019, 58(37), 17489–17506 CrossRef CAS
.
- B. Singh, R. Reijers, M. W. Van Der Spek, W. B. Schakel, R. Skagestad and H. A. Haugen,
et al., Environmental Due Diligence of CO2 Capture and Utilization Technologies - Framework and application, Energy Procedia, 2014, 63, 7429–7436 CrossRef CAS
.
-
IEAGHG, IEA GREENHOUSE GAS R&D PROGRAMME IEAGHG Technical Review Reference data and Supporting Literature Reviews for SMR Based Hydrogen Production with CCS, 2017 Search PubMed
.
- M. C. Romano, P. Chiesa and G. Lozza, Pre-combustion CO2 capture from natural gas power plants, with ATR and MDEA processes, Int. J. Greenhouse Gas Control, 2010, 4(5), 785–797 CrossRef CAS
.
- K. Aasberg-Petersen, I. Dybkjær, C. V. Ovesen, N. C. Schjødt, J. Sehested and S. G. Thomsen, Natural gas to synthesis gas - Catalysts and catalytic processes, J. Nat. Gas Sci. Eng., 2011, 3(2), 423–459 CrossRef CAS
.
- A. Streb and M. Mazzotti, Novel Adsorption Process for Co-Production of Hydrogen and CO2 from a Multicomponent Stream – Part 2: Application to SMR and ATR gases, Ind. Eng. Chem. Res., 2019 Search PubMed
, submitted.
- G. Manzolini, E. Sanchez Fernandez, S. Rezvani, E. Macchi, E. L. V. Goetheer and T. J. H. Vlugt, Economic assessment of novel amine based CO2 capture technologies integrated in power plants based on European Benchmarking Task Force methodology, Fuel, 2014, 129, 318–329 CrossRef
.
- Cesar, Deliverable D2.4.3, European Best Practice Guidelines for Assessment of CO2 Capture Technologies, 2011.
-
Sintef Energy Research, CEMCAP preliminary framework for comparative techno- economic analysis of CO2 capture from cement plants, 2017 Search PubMed
.
-
Y. Hu, CO2 capture from oxy-fuel combustion power plants, KTH Royal Institute of Technology, 2011 Search PubMed
.
-
G. Beysel, Enhanced Cryogenic Air Separation. A proven Process applied to Oxyfuel. Future Prospects, in 1st International Oxyfuel Combustion Conference, IEAGHG, Cottbus, 2009 Search PubMed
.
- C. Antonini, J.-F. Pérez-Calvo, M. Van der Spek and M. Mazzotti, Optimal design of an MDEA CO2 capture plant for clean hydrogen production, in preparation.
- J. Schell, N. Casas, D. Marx and M. Mazzotti, Precombustion CO2 Capture by Pressure Swing Adsorption (PSA): Comparison of Laboratory PSA Experiments and Simulations, Ind. Eng. Chem. Res., 2013, 52(24), 8311–8322 CrossRef CAS
.
- D. Marx, L. Joss, M. Hefti, M. Gazzani and M. Mazzotti, CO2 Capture from a Binary CO2/N2 and a Ternary CO2/N2/H2 Mixtures by PSA: Experiments and Predictions, Ind. Eng. Chem. Res., 2015, 54(22), 6035–6045 CrossRef CAS
.
- L. Joss and M. Gazzani, Rational design of temperature swing adsorption cycles for post-combustion CO2 capture, Chem. Eng. Sci., 2017, 158, 381–394 CrossRef CAS
.
-
ISO, ISO 14040. Environmental management - life cycle assessment - prinicples and framework, International Organisation for Standardisation (ISO), 2006 Search PubMed
.
-
ISO, ISO 14044. Environmental management - life cycle assessment - requirements and guidelines, International Organisation for Standardisation (ISO), 2006 Search PubMed
.
-
A. Lozanovski, O. Schuller and M. Faltenbacher, Guidance Document for Performing Lca on Hydrogen Production Systems, FC-HyGuide Deliv D, 2011, vol. 3, p. 139 Search PubMed
.
- C. Mutel, Brightway: An open source framework for Life Cycle Assessment, J. Open Source Softw., 2017, 2(12), 236 CrossRef
.
- G. Wernet, C. Bauer, B. Steubing, J. Reinhard, E. Moreno-Ruiz and B. Weidema, The ecoinvent database version 3 (part I): overview and methodology, Int. J. Life Cycle Assess., 2016, 21(9), 1218–1230 CrossRef
.
- X. Zhang, J. Witte, T. Schildhauer and C. Bauer, Life cycle assessment of Power-to-Gas with biogas as carbon source, Sustainable Energy Fuels, 2020, 4, 1427–1436 RSC
.
- K. Volkart, C. Bauer and C. Boulet, Life cycle assessment of carbon capture and storage in power generation and industry in Europe, Int. J. Greenhouse Gas Control, 2013, 16, 91–106 CrossRef CAS
.
-
Climate Change 2013: The Physical Science Basis. Contribution of Working Group I to the Fifth Assessment Report of the Intergovernmental Panel on Climate Change, ed. T.F. Stocker, D. Qin, G.-K. Plattner, M. Tignor, S.K. Allen, J. Boschung, A. Nauels, Y. Xia VB and P. M. Midgley, 2013 Search PubMed
.
-
S. Fazio, V. Castellani, S. Sala, E. M. Schau, M. Secchi and L. Zampori, et al., Supporting information to the characterisation factors of recommended EF Life Cycle Impact Assessment method: New models and differences with ILCD, 2018, EUR 28888 Search PubMed
.
-
World Biogas Association, Global potential of biogas, World Biogas Assoc, 2019, pp. 1–56 Search PubMed
.
-
C. Bauer, S. Hirschberg, Y. Bauerle, S. Biollaz, A. Calbry-Muzyka and B. Cox, et al., Potentials, costs and environmental assessment of electricity generation technologies, Swiss Fed Energy Off [Internet], 2017, pp. 1–783, available from: https://www.psi.ch/ta/PublicationTab/Final-Report-BFE-Project.pdf Search PubMed
.
-
M. J. Hauser, Cost evaluation and life cycle assessment of biogas upgrading technologies for an anaerobic digestion case study in the United States, 2017 Search PubMed
.
-
E. A. Huerta, H. A. Lopez-Aguilar, J. A. Gomez, M. G. Gomez-Mendez and A. Perez-Hernandez, Biogas power energy production, Intech, 2016, p. 13 Search PubMed
.
- X. Zhang, J. Witte, T. Schildhauer and C. Bauer, Life cycle assessment of Power-to-Gas with biogas as carbon source, Sustainable Energy Fuels, 2019 10.1039/c9se00986h
.
- W. Liu, Z. Zhang, X. Xie, Z. Yu, K. Von Gadow and J. Xu,
et al., Analysis of the Global Warming Potential of Biogenic CO2 Emission in Life Cycle Assessments, Sci. Rep., 2017, 7, 39857 CrossRef CAS PubMed
.
-
F. Cherubini and A. H. Strømman, Life cycle assessment of bioenergy systems: State of the art and future challenges, Bioresource Technology, 2011, vol. 102, pp. 437–51 Search PubMed
.
- D. R. Shonnard, B. Klemetsrud, J. Sacramento-Rivero, F. Navarro-Pineda, J. Hilbert and R. Handler,
et al., A Review of Environmental Life Cycle Assessments of Liquid Transportation Biofuels in the Pan American Region, Environ. Manage., 2015, 56(6), 1356–1376 CrossRef PubMed
.
- O. Hijazi, S. Munro, B. Zerhusen and M. Effenberger, Review of life cycle assessment for biogas production in Europe, Renewable Sustainable Energy Rev., 2016, 54, 1291–1300 CrossRef CAS
.
- M. Fuchsz and N. Kohlheb, Comparison of the environmental effects of manure- and crop-based agricultural biogas plants using life cycle analysis, J. Cleaner Prod., 2015, 86, 60–66 CrossRef CAS
.
- A. Fusi, J. Bacenetti, M. Fiala and A. Azapagic, Life cycle environmental impacts of electricity from biogas produced by anaerobic digestion, Front. Bioeng. Biotechnol., 2016, 4, 26 Search PubMed
.
- J. Wang, Decentralized biogas technology of anaerobic digestion and farm ecosystem: Opportunities and challenges, Frontiers in Energy Research, 2014, 2, 1–12 CAS
.
- European Biogas Association, Digestate Factsheet, 2015, available from: http://european-biogas.eu/wp-content/uploads/2015/07/Digestate-paper-final-08072015.pdf Search PubMed.
- E. Lugato, K. Paustian, P. Panagos, A. Jones and P. Borrelli, Quantifying the erosion effect on current carbon budget of European agricultural soils at high spatial resolution, GCB Bioenergy, 2016, 22(5), 1976–1984 Search PubMed
.
- E. Lugato, P. Panagos, F. Bampa, A. Jones and L. Montanarella, A new baseline of organic carbon stock in European agricultural soils using a modelling approach, GCB Bioenergy, 2014, 20(1), 313–326 Search PubMed
.
-
A. Fagerström, T. Al Seadi, S. Rasi and T. Briseid, The Role of Anaerobic Digestion and Biogas in the Circular Economy, IEA Bioenergy Task 37, 2018, vol. 37, 8, pp. 1–24 Search PubMed
.
- B. M. Petersen, M. T. Knudsen, J. E. Hermansen and N. Halberg, An approach to include soil carbon changes in life cycle assessments, J. Cleaner Prod., 2013, 52, 217–224 CrossRef CAS
.
- J. H. Schmidt, B. P. Weidema and M. Brandão, A framework for modelling indirect land use changes in Life Cycle Assessment, J. Cleaner Prod., 2015, 99, 230–238 CrossRef
.
-
FAO, Measuring and modelling soil carbon stocks and stock changes in livestock production systems, 2018 Search PubMed
.
- P. Smith, S. J. Davis, F. Creutzig, S. Fuss, J. Minx and B. Gabrielle,
et al., Biophysical and economic limits to negative CO2 emissions, Nat. Clim. Change, 2015, 6(1), 42 CrossRef
.
- BAFU. Kompostier- und Vergärungsanlagen, 2019, available from: https://www.bafu.admin.ch/dam/bafu/de/dokumente/abfall/uz-umwelt-zustand/kompostier-_und_vergaerungsanlagen.pdf.download.pdf/kompostier-_und_vergaerungsanlagen.pdf Search PubMed.
- M. Zschokke and K. Schleiss, Inventare zur Biomasse-Behandlung Transfer in ecoinvent 3, 2016, available from: https://www.infothek-biomasse.ch/images//313_2016_BFE_InventareBiomasseBehandlung.pdf Search PubMed.
- A. Mehmeti, A. Angelis-Dimakis, G. Arampatzis, S. McPhail and S. Ulgiati, Life Cycle Assessment and Water Footprint of Hydrogen Production Methods: From Conventional to Emerging Technologies, Environments, 2018, 5(2), 24 CrossRef
.
- Y. K. Salkuyeh, B. A. Saville and H. L. MacLean, Techno-economic analysis and life cycle assessment of hydrogen production from different biomass gasification processes, Int. J. Hydrogen Energy, 2018 May 17, 43(20), 9514–9528 Search PubMed
.
- CIA, Central Intelligence Agency - The world factbook, COUNTRY COMPARISON - NATURAL GAS - PROVED RESERVES [Internet]. 2019 [cited 2019 Dec 12], available from, https://www.cia.gov/library/publications/the-world-factbook/rankorder/2253rank.html.
- C. Wulf and M. Kaltschmitt, Life cycle assessment of biohydrogen production as a transportation fuel in Germany, Bioresour. Technol., 2013, 150, 466–475 CrossRef CAS PubMed
.
- D. Meyer-Kohlstock, T. Schmitz and E. Kraft, OrganicWaste for Compost and Biochar in the EU: Mobilizing the Potential, Resources, 2015, 4(3), 457–475 CrossRef
.
- D. Pick, M. Dieterich and S. Heintschel, Biogas production potential from economically usable green waste, Sustainability, 2012, 4(4), 682–702 CrossRef
.
- L. Vandepaer, K. Treyer, C. Mutel, C. Bauer and B. Amor, The integration of long-term marginal electricity supply mixes in the ecoinvent consequential database version 3.4 and examination of modeling choices, Int. J. Life Cycle Assess., 2018, 24, 1409–1428 CrossRef
.
Footnotes |
| † Electronic supplementary information (ESI) available: (a) Technical ESI (“AntoniniTreyer et al._H2 production with NG and BM_ESI_TechnicalSection.xlsx”); (b) LCA ESI (“AntoniniTreyer et al._H2 production with NG and BM_ESI_LCA.xlsx”, “1_Elegancy LCI Import.ipynb”, “2_H2 from SMR.ipynb”, “3_H2 from ATR.ipynb”, “4_contribution_analysis_elegancy.ipynb”, “5_H2 from Electrolysis.ipynb”). See DOI: 10.1039/d0se00222d |
| ‡ These authors contributed equally to this work. |
| This journal is © The Royal Society of Chemistry 2020 |

