Chain dynamics and glass transition of dry native cellulose solutions in ionic liquids
Nyalaliska W.
Utomo
 a,
Indira
Saifuddin
b,
Behzad
Nazari
 a,
Preet
Jain
b and
Ralph H.
Colby
 *a
*a
aDepartment of Materials Science and Engineering, The Pennsylvania State University, University Park, PA 16802, USA. E-mail: rhc@plmsc.psu.edu
bDepartment of Chemical Engineering, The Pennsylvania State University, University Park, PA 16802, USA
First published on 18th November 2019
Abstract
Dry native cellulose solutions in 1-butyl-3-methylimidazolium methylphosphonate (EMImMPO3H), 1-butyl-3-methylimidazolium acetate (EMImAc), and 1-butyl-3-methylimidazolium chloride (BMImCl) ionic liquids (IL) were investigated using subambient linear viscoelastic oscillatory shear. Glass transition temperatures (Tg) of solutions with various cellulose concentrations up to 8.0 wt% were observed as the peaks of loss tangent tan(δ) and loss modulus G′′ in descending temperature sweeps at 1 rad s−1. Cellulose/IL solutions showed a minimum in Tg at ∼2.0 wt% cellulose content before increasing with cellulose concentration, suggesting a perturbation of the strongly structured IL solvents by the cellulose chains. Isothermal frequency sweeps in the vicinity of Tg were used to construct time–temperature-superposition master curves. The angular frequency shift factor aT as a function of temperature indicates Arrhenius behavior within a 9 K range near Tg, allowing calculation of fragility, which was found to be constant up to 8.0 wt% cellulose concentration. This result implied that increasing cellulose concentration initially decreases Tg due to disrupted ionic regularity of ILs, but does not seem to change their fragility.
Introduction
Biopolymers including cellulose are potential future replacements of petroleum-based polymers. As the most abundant biopolymer on Earth, cellulose is produced in hundreds of billions of tons annually, sourced mostly from green plants. The anhydroglucose rings connected by β(1–4) glucosidic linkages in cellulose serve as the structural support in plants.1–4 Cellulose versatility includes its ability to be shaped into different structures such as fibers, films, and aerogels from solution processing.However, strong multiple hydrogen bonds between the cellulose chains in the crystal prevent its dissolution in most organic solvents. Derivatization of cellulose is a common method to be able to dissolve it in different solvents, despite the inefficiency and toxicity. Derivatized cellulose usually loses many of its hydrogen bonding –OH groups, causing fibers spun from derivatized cellulose to have approximately half of the modulus of those spun from native cellulose in ionic liquids. The viscose process is by far the most popular method to manufacture cellulose.5 However, chemical modification of the cellulose chains is still required and there are many environmental problems posed by the carbon disulfide (CS2) solvent and the by-products of this process.6
As cellulose is utilized in many different products such as textiles, biomedicine and food, finding a solvent that does not derivatize cellulose is important.3,7 Ionic liquids (ILs) are promising solvents that can dissolve cellulose without derivatizing it. Several ionic liquids containing ammonium, pyridinium, or imidazolium cations are reportedly able to dissolve cellulose as long as the anions have sufficiently strong hydrogen bond acceptors.8–11 Cellulose can easily be regenerated with non-solvents such as water, alcohols, and acetone.8–11 ILs dissolve cellulose by competing for hydrogen bonds that exist between the cellulose chains.12 ILs also have a vanishingly low vapor pressure, low flammability, and high thermal, chemical, and oxidative stability.13 ILs can be regenerated for many process cycles, making them “green” solvents and possible excellent replacements for traditional cellulose solvents.9,13
In order to utilize ionic liquids in more cellulose manufacturing processes, it is important to understand the chain dynamics of cellulose in these solvents. In studying the solutions of cellulose in ILs, many researchers focus on 1-butyl-3-methylimidazolium chloride (BMImCl) and 1-ethyl-3-methylimidazolium acetate (EMImAc) that are reportedly θ-solvents for native cellulose with overlap concentration c* roughly 0.5 wt% and entanglement concentration ce about 2.0 wt% cellulose (for typical Mw = 120–140 kg mol−1).8,14,15 Despite many researchers focusing on the rheology of these solutions, not much detail has been mentioned about chain segmental dynamics and structural aspects of native cellulose in IL solutions.
One of the important aspects that explain chain dynamics is the solution's glass transition temperature Tg. The glass transition temperature of cellulose solutions has proven difficult to determine. Many reported the inability to detect Tg of cellulose solutions through Differential Scanning Calorimetry (DSC) due to the instrument's insensitivity to small changes in heat capacity.16–18 Herein we show that is likely caused by the unusually broad glass transition, spanning 20 K. This broad glass transition seems to be common for cellulose solutions as it was also observed in temperature sweep measurement of a 15 wt% cellulose/N-methylmorpholine N-oxide (NMMO) solution.19 Compared to thermal testing like DSC, peaks of loss tangent tan(δ) and loss modulus G′′ obtained from oscillatory shear temperature sweeps often reveal crucial information because these peaks are very sensitive to the state of the solution as well as their composition.20
Previous works on the rheology of cellulose/IL solutions21–25 have constructed various time–temperature superposition (tTs) master curves in order to explain entanglements between the cellulose chains and the viscoelastic behavior of the biopolymer in various ILs. So far, none evaluate tTs master curves near the glass transition and evaluate the fragility of these solutions. Angell27–30 classified glass formers based on their fragility, with the notion that strong liquids, as opposed to fragile ones including most polymers, have stable structures with properties that do not face any significant changes with the liquid–solid phase change that is the glass transition. The dynamic fragility, as explained by Huang and McKenna,27 can be important as it is commonly correlated with structural relaxation,31,32 chemical structure,33–35 vibrational motions,36 and glassy structural recovery.37–39 Various methods to obtain fragility have been employed before, and either viscoelastic or dielectric master curves constructed near glass transitions can obtain a shift factor as a function of temperature that can quantify how much structural change is seen with changing temperature.
In this work, we improve understanding of the physical state of cellulose in EMImAc and BMImCl by evaluating the solutions’ glass transition temperatures and their viscoelastic response near their glass transition. Time–temperature superposition (tTs) master curves and glass transition temperatures at various cellulose concentrations from rheology experiments are reported in this paper. We investigated the glass transition temperatures of different cellulose concentrations that were reflected by the peaks of loss tangent tan(δ) = G′′/G′ and loss modulus G′′. The frequency-scale shift factors aT of various cellulose concentrations near their glass transition temperatures in the two ILs were used to quantify fragility of these solutions. A third ionic liquid that dissolves cellulose, 1-ethyl-3-methylimidazolium methylphosphonate (EMImMPO3H), was studied using only the temperature at which loss tangent tan(δ) shows a maximum, as those solutions let go of the rheometer plates before the lower temperatures at which loss modulus G′′ would show a maximum.
Materials and methods
1-Ethyl-3-methylimidazolium acetate (EMImAc) and 1-butyl-3-methylimidazolium chloride (BMImCl) with <50 ppm water were purchased from IOLITEC (Heilbronn, Germany). 1-Ethyl-3-methylimidazolium methylphosphonate (EMImMPO3H) was purchased from Solvionic (Toulouse, France). The viscosity values of the dry, Newtonian ILs are 9.7 Pa s, 89 mPa s, and 72 mPa s at 303 K for BMImCl, EMImAc, and EMImMPO3H respectively. Three cellulose samples (Cell272, Cell519, and Cell625) were provided by Dow Incorporated (Midland, MI) with weight-average molecular weights of 272, 519, and 625 kg mol−1; the determination of Mw for these three samples is discussed elsewhere.40 Prior to sample preparation, ILs were dried in a vacuum oven at 80 °C overnight and cellulose was dried in a vacuum oven at 40 °C overnight. Cellulose was dissolved in ILs without stirring by keeping the solutions in a vacuum oven at 80 °C for ∼72 hours. Annealing at 80 °C for 20 minutes was done prior to running any test to ensure no moisture in the solutions.41 Linear viscoelasticity was studied using an ARES-G2 rheometer from TA Instruments (New Castle, DE) equipped with parallel plate geometries with diameters of 3 mm and 8 mm with geometry gap of ∼0.5 mm. 3 mm parallel plates were used for glassy conditions (for temperatures ≤253 K for cellulose/BMImCl solutions and ≤223 K for cellulose/EMImAc solutions) in tTs master curves near Tg and temperature sweep measurements to find Tg of high cellulose concentration samples (c ≥ 1.0 wt%). 8 mm parallel plates were used for tTs above Tg (T > 223 K for cellulose/EMImAc solutions and T > 253 K for cellulose/BMImCl solutions) and for temperature sweep measurements to find Tg of low cellulose concentration samples (c < 1.0 wt%). Because of the high torque at lower temperatures where peaks of G′′ were seen, all reported loss modulus G′′ values were obtained using 3 mm parallel plate geometry while loss tangent tan(δ) values for low concentration samples were measured using 8 mm parallel plate geometry. The ARES-G2 uses a convection oven with flowing dry nitrogen to control system temperature and protect the sample from moisture. Subambient temperature experiments were controlled by a TA Instruments Air Chiller System and Chiller Panel that operates using dried, filtered air. Glass transition temperatures were measured by running downward temperature sweeps at 1 rad s−1 angular frequency and 1 °C min−1 ramp rate.Results and discussion
Glass transition temperature
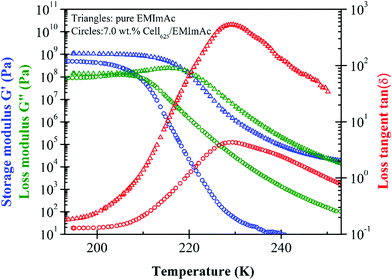
Oscillatory shear data to determine the glass transition temperature of pure EMImAc are compared to a solution of EMImAc with 7.0 wt% of Cell625 in Fig. 1. Glass transition temperatures were estimated from subambient temperature sweeps at a frequency of 1 rad s−1 with two Tg defined as the temperatures where there are peaks of loss tangent tan(δ) = G′′/G′ and loss modulus G′′. The two Tg values obtained from peaks of tan(δ) and G′′ represent the range of temperatures over which the transition between a liquid and a glass happens. Loss tangent tan(δ), as seen in Fig. 1, shows a peak at temperatures ∼20 K higher than the peak in G′′, and the values of the two temperatures can be taken as the Tg range of the samples. A ∼20 K difference in G′′ and tan(δ) peaks was also seen by Blachot et al. in 15 wt% cellulose/NMMO solution through upward temperature sweep measurement.19Glassy modulus Gg of order 1 GPa was seen below the glass transition, which was defined as the plateau of storage modulus20G′ but with 3 mm diameter plates this value is not trustworthy. It is not only difficult to load the sample into the small 3 mm diameter parallel plates perfectly, but 3 mm diameter geometry also tends to cause larger measurement errors due to its compliance contribution to the instrument compliance, therefore requiring a correction in order to obtain an accurate Gg value.42–44 Although the Gg values are not reported due to the aforementioned reasons, the temperatures at which G′′ and tan(δ) have peaks are robust.
The peak in loss modulus G′′ can be thought of as the temperature where molecular motions start to ‘melt’ the glass, whereas the ∼20 K higher temperature peak in loss tangent tan(δ) is roughly the midpoint of the change in storage modulus from Gg to Ge, the entanglement plateau for entangled solutions.45 The tan(δ) of 7.0 wt% cellulose/EMImAc is seen to have a wider peak compared to pure EMImAc (Fig. 1) due to ordinary concentration fluctuations from the presence of cellulose chains.
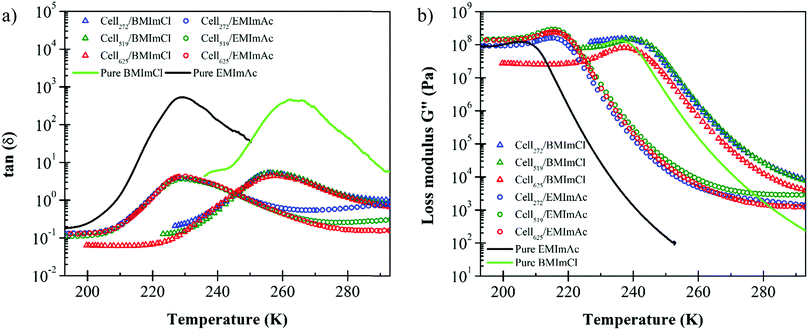
From the maxima of tan(δ) and G′′, it can be seen in Fig. 2 that the Tg of 7.0 wt% cellulose/BMImCl solutions is considerably higher than cellulose/EMImAc solutions. The different Tg values between cellulose/BMImCl and EMImAc solutions are caused by the ∼33 K difference in Tg of the two solvents. Yamamuro et al. reported Tg of BMImCl to be 225 K while we did not find any reported Tg for EMImAc.46,47 Our temperature sweep measurements indicate Tg ranges of pure EMImAc and BMImCl to be 205–229 K and 236–262 K, respectively. These values are compared to the Tg of 7.0 wt% cellulose solutions in Table 1. Fox and Flory reported that for polymers with Mw < 20 kg mol−1, there is an increase of Tg as molecular weight increases.48 Since the Mw of cellulose samples used was well above 20 kg mol−1 (272–625 kg mol−1), these solution Tg values are expected to be independent of Mw. Cell272, Cell519, and Cell625 have very similar Tg, shown by the overlapping temperature sweep curves in Fig. 2a and b, and summarized Tg values in Table 1.
| EMImAc | ||
|---|---|---|
| [Cellulose] | T g (K) from Gmax′′ | T g (K) from tan(δ)max |
| 0.0 wt% | 205 | 229 |
| 7.0 wt% Cell272 | 215 | 229 |
| 7.0 wt% Cell519 | 216 | 230 |
| 7.0 wt% Cell625 | 216 | 229 |
| BMImCl | ||
|---|---|---|
| [Cellulose] | T g (K) from Gmax′′ | T g (K) from tan(δ)max |
| 0.0 wt% | 236 | 262 |
| 7.0 wt% Cell272 | 237 | 256 |
| 7.0 wt% Cell519 | 240 | 257 |
| 7.0 wt% Cell625 | 237 | 257 |
The Tg values of 7.0 wt% cellulose in BMImCl range from 238 K ± 1.5 K from the peak in G′′ to 258 K ± 2.5 K from the peak in tanδ, while 7.0 wt% cellulose in EMImAc has Tg varying from 213 K ± 4.6 K from the peak in G′′ to 229 K ± 0.2 K from the peak in tanδ. Below the lower glass transition temperature that is from the maximum in loss modulus G′′, the local conformational arrangements of cellulose chains do not depend on Mw and temperature because long polymer chains below Tg are at an iso-free-volume state.20,48,49 A good measure of the breadth of the glass transition is the full width at half of the maximum value of tan(δ), plotted in Fig. 3. The glass transition broadens as cellulose is added, also seen in Fig. 1 and 2, consistent with concentration fluctuations expected in any polymer solution.
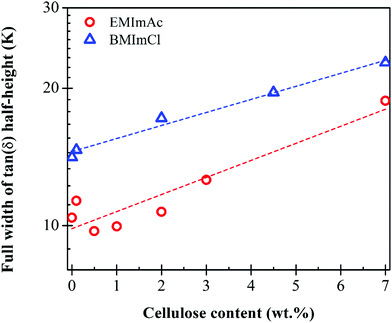 | ||
| Fig. 3 Cellulose concentration dependence of the breadth of the glass transition, measured as the full-width at half of the maximum of tan(δ) from temperature sweeps like those in Fig. 2a, for solutions of Cell625 in BMImCl (blue), EMImAc (red). The glass transition broadens as cellulose is added, as expected from the usual concentration fluctuations. | ||
While the Fox equation (eqn (1)) suggests that Tg increases with increasing polymer content, Fig. 4 shows that increasing cellulose concentration in all three ionic liquids decreases the Tg up to cellulose content of approximately 2.0 wt%. This nonmonotonic concentration dependence of Tg can clearly be seen from the inset of Fig. 4, where Tg − Tg,IL first adopts negative values (the Tg of low concentration solutions are lower than the pure ILs) and reaching a minimum before eventually increasing with addition of cellulose at higher concentrations. We suspect that this is caused by cellulose disrupting the natural structure of the ILs. Ionic liquids are highly structured solvents; each cation prefers to be surrounded by anions and vice versa.
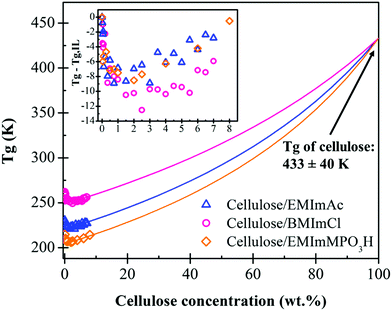 | ||
| Fig. 4 Glass transition temperature (Tg) dependence on Cell625 content in BMImCl, EMImAc, and EMImMPO3H solutions. Tg values were obtained from peaks in loss tangent tan(δ) = G′′/G′ in downward temperature sweeps at 1 rad s−1. Fits to eqn (1) for c > 2.0 wt% requiring a common Tg = 433 K for pure cellulose are shown as solid curves. The reductions of Tg caused by cellulose addition to the three ionic liquids are compared in the inset. | ||
The structuring of ionic liquids can be seen from a peak in wide-angle neutron or X-ray diffraction50 and also seen in simulations.51–53 Like many molten salts, ionic liquids are strongly-coupled ionic systems due to their high ion densities.52,54 Imidazolium ionic liquids are known to exhibit three center-of-mass pair distribution function peaks between cation–cation, cation–anion, and anion–anion.54 It was reported by Kuang et al.54 that the anions and cations of ILs are connected through strong hydrogen bonding and at the same time, aggregation of alkyl tails on ILs’ cations were observed using dynamic light scattering (DLS) measurements and simulations. The addition of cellulose disrupts this ionic structure and when this ionic regularity is perturbed, the broken ionic interactions and added irregularity lowered Tg by 10–13 K in all three ILs.
The addition of solutes with high Tg into a solvent with lower Tg is reflected in an overall increase in the Tg of solution at higher cellulose concentrations. As the amount of cellulose is increased, the Tg raises due to the high Tg of cellulose relative to the solvents. The increase in Tg also indicates the restriction of cellulose chain mobility in solutions due to the limited free volume and the restrained local relaxation of the ILs. The magnitude of solutions’ Tg reflect the value of their solvent's viscosity; BMImCl has the largest zero-shear viscosity at 303 K and the highest Tg, followed by EMImAc and EMImMPO3H. The Fox equation (eqn (1)) predicts the solution's Tg using mass fraction w and Tg (in K) of each component, if the Tg of pure cellulose were known.
 | (1) |
Time temperature superposition master curves and fragility
Time-temperature superposition master curves have been constructed for many cellulose/IL solutions.21–26 tTs master curves in the literature indicate that cellulose/IL solutions generally behave like common polymer solutions with a terminal regime and entanglement plateau of G′ for cellulose concentration c > ce due to chain entanglement.45,58 At higher concentrations, there are more cellulose chains present to entangle with one another and the rubbery plateau widens with increasing cellulose concentration. The results presented so far,21–26 however, did not include any attempt of measurements in the vicinity of solutions’ glass transition temperature. As we intend to study the fragility of solutions, we extended the tTs master curves to temperatures within the range of Tg for 0.25, 0.5, 1.0, 2.0, 4.0, and 8.0 wt% Cell625 in EMImAc and BMImCl (Fig. 5).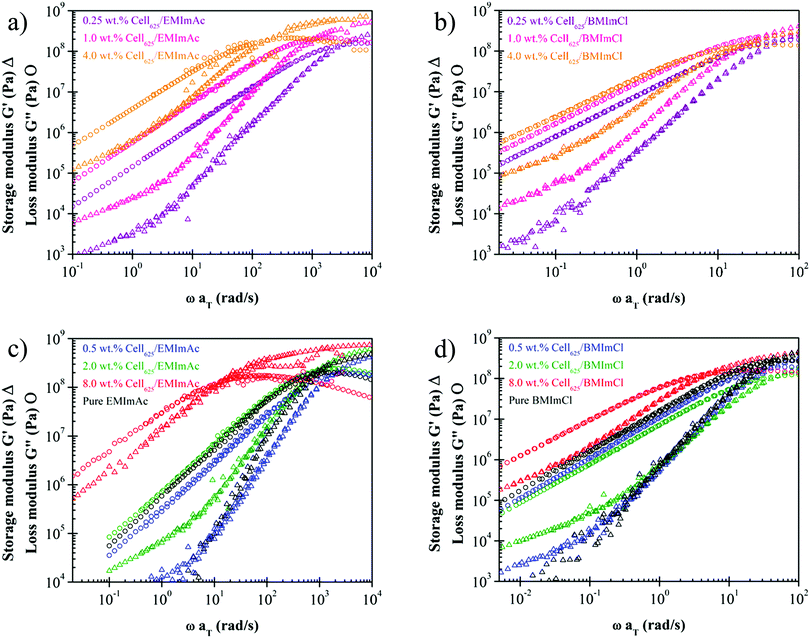 | ||
| Fig. 5 Time–temperature superposition (tTs) master curves of 0.25 wt%, 1.0 wt%, and 4.0 wt% Cell625 dissolved in (a) EMImAc and (b) BMImCl, and 0.5 wt%, 2.0 wt%, and 8.0 wt% in (c) EMImAc and (d) BMImCl. EMImAc solutions were measured at 214 K to 223 K with reference temperature of 223 K and BMImCl solutions were measured at 244 K to 253 K with reference temperature of 244 K. Pure ILs are indicated by black data points. The lower viscosity (reflected in smaller G′′ at low frequencies) of the 0.5 wt% solutions in blue compared with the pure ILs in black is caused by the drop in Tg seen in Fig. 4. | ||
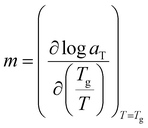
In Fig. 5, the glass transitions of solutions are seen from the maxima of loss modulus G′′ and the plateauing of storage modulus G′ at higher frequencies. At very high frequencies, little to no configurational rearrangements are possible and this develops higher elastic character than its viscous counterpart, often involving stretching and bending of chemical bonds.45 As previously discussed, polymer chain movements are arrested near the glass transition temperature while at temperatures higher than Tg, polymer chains are more mobile. The term also closely related to polymer motion, fragility, is defined by Angell as the change of the base-10 logarithm of solution viscosity with respect to glass transition temperature divided by temperature (Tg/T).28 From these definitions, it can be inferred that more fragile solutions will commonly have higher Tg.59
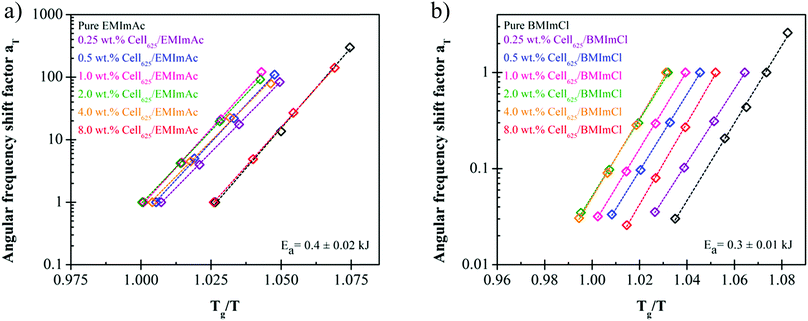
While constructing the tTs master curves, the angular frequency shift factor aT was obtained by setting a reference temperature of 223 K for cellulose/EMImAc solutions and 244 K for cellulose/BMImCl solutions. No modulus scale shift factor was utilized (bT = 1), as G′, G′′ and tan(δ) at the four temperatures superimposed well without having to adjust bT, owing to the 9 K temperature ranges. By only having angular frequency shift factor aT, the differences between diffusion coefficients in the 9 K temperature range are much more significant than the disparities between the densities at these temperatures.45,60 The obtained aT as functions of Tg/T for all solutions in Fig. 6 within the 9 K window are Arrhenius (eqn (2)), where aT is the angular frequency shift factor, Ea is solution's activation energy, R is the gas constant, T is absolute temperature, and T0 is the chosen reference temperature. Activation energies Ea for Fig. 6 were averaged to 207 ± 10 kJ mol−1 for cellulose/EMImAc solutions and 199 ± 6 kJ mol−1 for cellulose/BMImCl solutions.
 | (2) |
 | (3) |
| Ionic liquid | Cellulose content (wt%) | T g (K) | m |
|---|---|---|---|
| EMImAc | 0 | 229 | 51.5 |
| 0.25 | 220 | 45.5 | |
| 0.5 | 221 | 47.9 | |
| 1 | 221 | 49.5 | |
| 2 | 222 | 46.8 | |
| 4 | 224 | 45.4 | |
| 8 | 229 | 50.0 | |
| BMImCl | 0 | 262 | 40.4 |
| 0.25 | 248 | 38.3 | |
| 0.5 | 248 | 39.7 | |
| 1 | 254 | 40.5 | |
| 2 | 250 | 39.7 | |
| 4 | 252 | 41.3 | |
| 8 | 256 | 42.4 | |
The different structures of cation and anion in EMImAc and BMImCl obviously cause differences in their fragility indices m. Leys et al.64 stated that the fragility of ionic liquids depend mostly on the Coulombic forces between the cation and anion. They observed decreasing m with increasing anion size for 1-butyl-3-methylimidazolium ILs, but we see the opposite trend here, with the smaller chloride anion having the smaller fragility.
The large discrepancy between fragility indices of the same glass-forming liquid has commonly been observed by using different methods. Tao et al.63 explained that fragility index obtained from DSC usually has a systematic error of 10–15% while viscosity measurements are seldom performed close enough to Tg to obtain a reliable fragility index. At the same time, a 5 K change in Tg can easily result in a 20% change in fragility. However, fragilities from DSC and rheology were observed to agree in a narrow temperature range close to Tg.63 Dielectric measurements, on the other hand, include relaxation modes beyond the α-process, and often result in higher fragility values.62 In our rheology measurements, we extended the temperatures above the solutions’ glass transition temperatures with the hope that the fragility indices obtained are more accurate.
Fig. 6 and Table 2 indicate that within the cellulose concentration range up to 8.0 wt%, there are no significant changes in the values of fragility in each IL. As the fragility stays relatively constant with changing cellulose concentration, it is evident that the trend of glass transition temperature Tg with concentration seen in Fig. 4 is mostly based on the effects that cellulose chains have on ionic regularity in ILs. It is still unclear how solution fragility will change with higher cellulose concentration and whether there will eventually be an increase in fragility with cellulose concentration above 8.0 wt% cellulose content.
Conclusions
Glass transition temperatures of cellulose/EMImAc and cellulose/BMImCl solutions were observed as peaks of loss tangent tan(δ) and loss modulus G′′ in descending temperature sweep measurements. Temperature sweeps of cellulose/ILs solutions over a wide cellulose content revealed that small additions of cellulose initially decrease the Tg of solutions as much as ∼10–13 K up to ∼2.0 wt% cellulose content. This is likely caused by the disruption of ionic regularity of the strongly structured IL solvents by the addition of cellulose chains. At higher concentration, Tg increased towards the Tg of pure cellulose. A very long extrapolation of Tg data for 2.0 wt% < c < 8.0 wt% using the Fox equation estimated a value of Tg = 433 K ± 40 K for pure cellulose. Glass transition temperatures of cellulose/IL solutions showed that Tg of cellulose/EMImMPO3H and cellulose/EMImAc solutions are lower than those of cellulose/BMImCl due to the higher Tg of the pure BMImCl solvent.Fragility indices m of cellulose/IL solutions were calculated from the temperature dependence of angular frequency shift factor aT within a 9 K temperature range near Tg. Arrhenius behavior was observed in aT and m was larger in value for cellulose/EMImAc (m = 48.1 ± 2.2) compared to cellulose/BMImCl (m = 40.3 ± 1.2). The addition of cellulose in each IL was observed to not change fragility up to 8.0 wt% cellulose content. Adding cellulose chains into ILs perturbs the ionic regularity of ILs, but does not change IL's fragility index.
Conflicts of interest
There are no conflicts to declare.Acknowledgements
Funding from the National Science Foundation, DMR-1506589 BMAT/SusChEM program is gratefully acknowledged. We also appreciate Dr Robert Sammler from Dow Incorporated for providing us with the native cellulose samples used in this work.References
- A. C. Sullivan, Cellulose, 1997, 4(3), 173–207 CrossRef.
- A. Arevalo-Gallegos, Z. Ahmad, M. Asgher, R. Parra-Saldivar and H. M. Iqbal, Int. J. Biol. Macromol., 2017, 99, 308–318 CrossRef CAS.
- P. Umaraw and A. K. Verma, Crit. Rev. Food Sci. Nutr., 2017, 57(6), 1270–1279 CrossRef CAS.
- R. J. Moon, A. Martini, J. Nairn, J. Simonsen and J. Youngblood, Chem. Soc. Rev., 2011, 40, 3941–3994 RSC.
- A. A. Polyutov, L. S. Galbraikh, A. V. Byvshev, R. Z. Pen, Y. Y. Kleiner and V. M. Irklei, Fibre Chem., 2000, 32(1), 6–11 CrossRef CAS.
- T. F. Liebert, T. J. Heinze and K. J. Edgar, Cellulose Solvents: For Analysis, Shaping and Chemical Modification, Oxford University Press, Washington, DC, 2010 Search PubMed.
- S. Wang, A. Lu and L. Zhang, Prog. Polym. Sci., 2016, 53, 169–206 CrossRef CAS.
- R. P. Swatloski, S. K. Spear, J. D. Holbrey and R. D. Rogers, J. Am. Chem. Soc., 2002, 124(18), 4974–4975 CrossRef CAS.
- Y. Cao, J. Wu, J. Zhang, H. Li, Y. Zhang and J. He, Chem. Eng. J., 2009, 147(1), 13–21 CrossRef CAS.
- Y. Fukaya, K. Hayashi, M. Wadab and H. Ohno, Green Chem., 2008, 10, 44–46 RSC.
- H. Ohno and Y. Fukaya, Chem. Lett., 2009, 38, 2–7 CrossRef CAS.
- A. Pinkert, K. N. Marsh, S. Pang and M. P. Staiger, Chem. Rev., 2009, 109, 6712–6728 CrossRef CAS.
- S. Zhu, Y. Wu, Q. Chen, Z. Yu, C. Wang, S. Jin, Y. Ding and G. Wu, Green Chem., 2006, 8, 325–327 RSC.
- X. Chen, Y. Zhang, H. Wang, S.-W. Wang, S. Liang and R. H. Colby, J. Rheol., 2011, 55(3), 485–494 CrossRef CAS.
- F. Lu, L. Wang, X. Ji, B. Cheng, J. Song and X. Gou, Carbohydr. Polym., 2014, 99, 132–139 CrossRef CAS.
- L. Szcześniak, A. Rachocki and J. Tritt-Goc, Cellulose, 2007, 15(3), 445–451 CrossRef.
- B. J. Cauley, C. Cipriani, K. Ellis, A. K. Roy, A. A. Jones, P. T. Inglefield, B. J. McKinley and R. P. Kambour, Macromolecules, 1991, 24(2), 403–409 CrossRef CAS.
- F. X. Quinn, E. Kampff, G. Smyth and V. J. McBrierty, Macromolecules, 1988, 21(11), 3191–3198 CrossRef CAS.
- J. F. Blachot, L. Chazeau and J. Y. Cavaille, Polymer, 2002, 43, 881–889 CrossRef CAS.
- L. H. Sperling, Introduction to Physical Polymer Science, Wiley, Hoboken, 2006 Search PubMed.
- Y. Ahn, S. Kwak, Y. Song and H. Kim, Phys. Chem. Chem. Phys., 2016, 18, 1460–1469 RSC.
- Y. Lv, J. Wu, J. Zhang, Y. Niu, C. Liu, J. He and J. Zhang, Polymer, 2012, 53, 2524–2531 CrossRef CAS.
- S. J. Haward, V. Sharma, C. P. Butts, G. H. McKinley and S. S. Rahatekar, Biomacromolecules, 2012, 13, 1688–1699 CrossRef CAS.
- J. Horinaka, R. Yasuda and T. Takigawa, J. Polym. Sci., Part B: Polym. Phys., 2011, 49, 961–965 CrossRef CAS.
- X. Chen, S. Liang, S.-W. Wang and R. H. Colby, J. Rheol., 2018, 62(1), 81–87 CrossRef CAS.
- U. H. Choi, Y. Ye, D. S. de la Cruz, W. Liu, K. I. Winey, Y. A. Elabd, J. Runt and R. H. Colby, Macromolecules, 2014, 47, 777–790 CrossRef CAS.
- D. Huang and G. B. McKenna, J. Chem. Phys., 2001, 114(13), 5621–5630 CrossRef CAS.
- C. A. Angell, J. Non-Cryst. Solids, 1985, 73(1–3), 1–17 CrossRef CAS.
- C. A. Angell, J. Non-Cryst. Solids, 1991, 131–133, 13–31 CrossRef CAS.
- C. A. Angell, Science, 1995, 267(5206), 1924–1935 CrossRef CAS.
- R. Böhmer, K. L. Ngai, C. A. Angell and D. J. Plazek, J. Chem. Phys., 1993, 99(5), 4201–4209 CrossRef.
- S. V. Nemilov, Thermodynamic and Kinetic Aspects of the Vitreous State, CRC Press, Boca Raton, 1995 Search PubMed.
- C. M. Roland and K. L. Ngai, Macromolecules, 1991, 24(19), 5315–5319 CrossRef CAS.
- K. L. Ngai and C. M. Roland, Macromolecules, 1993, 26(25), 6824–6830 CrossRef CAS.
- C. M. Roland, Macromolecules, 1992, 25(25), 7031–7036 CrossRef CAS.
- C. A. Angell, Polymer, 1997, 38(26), 6261–6266 CrossRef CAS.
- I. M. Hodge, Macromolecules, 1987, 20(11), 2897–2908 CrossRef CAS.
- I. M. Hodge, J. Non-Cryst. Solids, 1997, 212(1), 77–79 CrossRef CAS.
- C. M. Roland and K. L. Ngai, J. Non-Cryst. Solids, 1997, 212(1), 74–76 CrossRef CAS.
- N. W. Utomo, M.S. thesis, Pennsylvania State University, 2019.
- B. Nazari, N. W. Utomo and R. H. Colby, Biomacromolecules, 2017, 18(9), 2849–2857 CrossRef CAS.
- O. V. Laukkanen, Rheol. Acta, 2017, 56, 661–671 CrossRef CAS.
- S. A. Hutcheson and G. B. McKenna, J. Chem. Phys., 2008, 129, 07452 CrossRef.
- K. Schröter, S. A. Hutcheson, X. Shi, A. Mandanici and G. B. McKenna, J. Chem. Phys., 2006, 125, 214507 CrossRef.
- J. D. Ferry, Viscoelastic Properties of Polymers, Wiley, New York, 1970 Search PubMed.
- O. Yamamura, Y. Minamimoto, Y. Inamura, S. Hayashi and H. Hamaguchi, Chem. Phys. Lett., 2006, 423, 371–375 CrossRef.
- R. Sescousse, K. A. Le, M. E. Ries and T. Budtova, J. Phys. Chem. B, 2010, 114, 7222–7228 CrossRef CAS.
- T. G. Fox and P. J. Flory, J. Appl. Phys., 1950, 21(6), 581–591 CrossRef CAS.
- G. R. Strobl, The Physics of Polymers, Springer, Berlin, 1997 Search PubMed.
- A. Triolo, A. Mandanici, O. Russina, V. Rodriguez-Mora, M. Cutroni, C. Hardacre, M. Nieuwenhuyzen, H.-J. Bleif, L. Keller and M. A. Ramos, J. Phys. Chem. B, 2006, 110, 21357 CrossRef CAS.
- J. N. A. Canongia Lopes and A. A. H. Padua, J. Phys. Chem. B, 2006, 110, 3330 CrossRef CAS.
- P. Keblinski, J. Eggebrecht, D. Wolf and S. R. Phillpot, J. Chem. Phys., 2000, 113(1), 282–291 CrossRef CAS.
- M. G. D. Pópolo and G. A. Voth, J. Phys. Chem., 2004, 108, 1744–1752 CrossRef.
- Q. Kuang, J. Zhang and Z. Wang, J. Phys. Chem. B, 2007, 111, 9858 CrossRef CAS.
- A. Michud, M. Hummel and H. Sixta, Polymer, 2015, 75, 1–9 CrossRef CAS.
- J. Bengtsson, K. Jedvert, T. Köhnke and H. Theliander, J. Appl. Polym. Sci., 2019, 136(30), 47800 CrossRef.
- C. Zhu, A. F. Koutsomitopoulou, S. J. Eichhorn, J. S. van Duijneveldt, R. M. Richardson, R. Nigmatullin and K. D. Potter, Macromol. Mater. Eng., 2018, 303(5), 1800029 CrossRef.
- T. Matsumoto, C. Hitomi and S. Onogi, Trans. Soc. Rheol., 1975, 19(4), 541–555 CAS.
- Q. Qin and G. B. McKenna, J. Non-Cryst. Solids, 2006, 352, 2977–2985 CrossRef CAS.
- M. Rubinstein and R. H. Colby, Polymer Physics, Oxford University Press Oxford, New York, 2003 Search PubMed.
- H. P. Diogo, S. S. Pinto and J. J. Moura Ramos, J. Mol. Liq., 2013, 178, 142–148 CrossRef CAS.
- P. Sippel, P. Lunkenheimer, S. Krohns, E. Thoms and A. Loidl, Sci. Rep., 2015, 5, 13922 CrossRef CAS.
- R. Tao, E. Gurung, M. Cetin, M. F. Mayer, E. L. Quitevis and S. L. Simon, Thermochim. Acta, 2017, 654, 121–129 CrossRef CAS.
- J. Leys, M. Wubbenhorst, C. P. Menon, R. Rajesh, J. Thoen, C. Glorieux, P. Nockemann, B. Thijs, K. Binnemans and S. Longuemart, J. Chem. Phys., 2008, 128, 064509 CrossRef.
| This journal is © The Royal Society of Chemistry 2020 |

