 Open Access Article
Creative Commons Attribution 3.0 Unported Licence
A multiscale coarse-grained model to predict the molecular architecture and drug transport properties of modified chitosan hydrogels†
Ankush
Singhal
a,
John D.
Schneible
 b,
Radina L.
Lilova
b,
Carol K.
Hall
b,
Radina L.
Lilova
b,
Carol K.
Hall
 *b,
Stefano
Menegatti
 *b and
Andrea
Grafmüller
*a
aDepartment of Theory and Biosystems, Max Planck Institute for Colloids and Interfaces, Potsdam 14476, Germany. E-mail: Andrea.Grafmueller@mpikg.mpg.de
bDepartment of Chemical and Biomolecular Engineering, North Carolina State University, Raleigh, North Carolina 27695, USA. E-mail: hall@ncsu.edu; smenega@ncsu.edu
First published on 27th October 2020
Abstract
Hydrogels constructed with functionalized polysaccharides are of interest in a multitude of applications, chiefly the design of therapeutic and regenerative formulations. Tailoring the chemical modification of polysaccharide-based hydrogels to achieve specific drug release properties involves the optimization of many tunable parameters, including (i) the type, degree (χ), and pattern of the functional groups, (ii) the water–polymer ratio, and (iii) the drug payload. To guide the design of modified polysaccharide hydrogels for drug release, we have developed a computational toolbox that predicts the structure and physicochemical properties of acylated chitosan chains, and their impact on the transport of drug molecules. Herein, we present a multiscale coarse-grained model to investigate the structure of networks of chitosan chains modified with acetyl, butanoyl, or heptanoyl moieties, as well as the diffusion of drugs doxorubicin (Dox) and gemcitabine (Gem) through the resulting networks. The model predicts the formation of different network structures, in particular the hydrophobically-driven transition from a uniform to a cluster/channel morphology and the formation of fibers of chitin chains. The model also describes the impact of structural and physicochemical properties on drug transport, which was confirmed experimentally by measuring Dox and Gem diffusion through an ensemble of modified chitosan hydrogels.
1. Introduction
Polysaccharides have received considerable interest as base materials in the development of hydrogels for biomedical applications (e.g., drug delivery and tissue engineering),1–3 owing to their natural abundance, biocompatibility, and chemical versatility.4 Among them, chitosan plays a prominent role as inexpensive, FDA-approved, biocompatible, and bioresorbable biopolymer.5,6 Tailoring pharmaceutical hydrogels requires careful tuning of the physicochemical properties of the polymer chains, which determine the microstructure of the gel, and ultimately the kinetics of drug transport and release.The network morphology of native chitosan hydrogels is determined by the ratio of acetylglucosamine (GlcNAc) and glucosamine (GlcN) monomers, expressed as degree of acetylation (χAc),7,8 the water/chitosan ratio, and pH.9 Tailored chemical modification of the free amine groups on GlcN monomers provides additional control over the properties of the chitosan hydrogels.10,11 Chemical modification provides several design parameters, such as type of functional group, degree of modification (χ), conjugation strategy, polymer/water ratio, etc.1,12–14 Understanding and predicting the impact of these design factors on the morphology and physicochemical properties of the chain network – and therefore its permeability to bioactive compounds – is key to develop drug delivery formulations with optimal therapeutic activity.
Computational modeling represents a powerful tool to gain a molecular-level understanding of the correlations between molecular interactions, the structure of the polysaccharide network, and drug diffusion therein. Molecular dynamics (MD) simulations with atomistic resolution provide a detailed picture of the interactions. The length- and time-scales of the dynamics in polysaccharide assemblies, however, far exceed the power of atomistic models. Coarse-grained (CG) models overcome these limitations by reducing the degrees of freedom of the system and accelerate molecular dynamics by creating a smoother energy landscape.15,16 As a result, CG models can simulate larger systems and for longer time-scales. This gain in efficiency, on the other hand, comes at the cost of losing some precision in the molecular detail. To maintain predictive power in CG models, different strategies have been developed to find effective interaction potentials between CG sites, which preserve the molecular information of the material and provide a realistic representation of its large-scale behavior. CG strategies applied to polysaccharide systems include (i) parametrization to reproduce bulk thermodynamic data,17 (ii) sampling the polymer conformations based on the conformational space available to the glycosidic angles φ and ψ,18–20 and (iii) interaction potentials that reproduce features of the atomistic system.21–26
To date, a limited number of studies have focused on the MD simulation of chitosan-based materials. The conformations of single chitosan chains have been explored both at atomistic19,27–29 and CG resolution.20 Other studies have probed the properties of nanoscale aggregates at the all-atom scale.30–32 Finally, the aggregation of chitosan with different χAc and different modification patterns has been simulated with a MARTINI-like model.7,33 In the present study, we implement a novel and promising approach for elucidating the structure–property relationship in chemically modified chitosan hydrogels. Our method employs (1) multi-scale coarse-graining (MS-CG), also known as “force matching”,34 to derive non-bonded interactions for solute–solute, solute–solvent, and solvent–solvent interactions that reproduce the forces sampled in the all-atom system; and (2) Boltzmann Inversion35 to derive the bonded interaction potentials. This combination enables polysaccharide models that are transferable to simulate polymer chains with different length and concentrations,25 and reproduces the aggregation behavior and osmotic pressure of the atomistic systems.26 In this study, we applied this method to model hydrated networks of chitosan chains modified with acetyl, butanoyl, and heptanoyl moieties. The CG model was first validated against atomistic MD simulations and subsequently applied to describe the effect of type, degree (χ), and pattern of modification (i.e., alternating or blocky), as well as water/chitosan ratio on the molecular architecture of the network. Our results demonstrate that hydrophobic modifications significantly alter the conformation and spatial arrangement of the chains, causing a transition from a homogeneous distribution to a cluster-channel morphology featuring large chain aggregates and pores. The impact of network structure and properties on drug transport was investigated using two model drug molecules, gemcitabine (Gem) and doxorubicin (Dox), which differ by polarity, hydrophobicity, and size. The calculated diffusion coefficient of Dox was found to vary significantly with the type, degree (χ), and pattern of modification, whereas Gem diffusion was approximately constant in all systems. Both predictions were confirmed experimentally by drug release tests conducted with an ensemble of modified chitosan gels. Collectively, these results demonstrate the validity of the proposed CG model and its value in pharmaceutical chemistry to accelerate the design, and therefore the transition to clinics, of chitosan hydrogels for drug delivery.
2. Methods
2.1. Atomistic simulations
Systems containing 10 chitosan chains with degree of polymerization (DP, defined as the sum of the number of N-acetylglucosamine (GlcNAc) and glucosamine (GlcN) monomers) of 16 and surrounded by 2000 water molecules (i.e., 200 water molecules per chain) were simulated at atomistic resolution in a cubic simulation box with side lengths between 4.44 and 4.62 nm. The following systems were modeled: (i) full chitosan (χ = 0%); (ii) acetylated chitosan with χAc = 16%, 24%, 32%, and 50%; (iii) butanoyl-chitosan with χBut = 16%, 24%, and 32%; and (iv) heptanoyl-chitosan with χHep = 8%, 16%, 20%, and 24%. The modification groups were distributed along the chitosan chains either uniformly spaced or in blocks of four. Single chains from systems (i)–(iv) were also simulated in a cubic 6.97 nm water box as controls. Solvated drug systems containing 50 drug molecules (Dox or Gem) and 10 water molecules per drug were modeled in a cubic box with side length of either 3.85 nm (Dox) or 3.56 nm (Gem). Finally, systems (i)–(iv) combined with either 10 Dox or 10 Gem molecules were simulated in a 4.55 nm cubic water box. All simulations used periodic boundary conditions. The initial structures of the chitosan molecules were constructed with tleap,36 their topologies were converted to GROMACS format using the glycam2gmx script,37,38 and solvated in GROMACS.39 The coordinates for the drug molecules were obtained from the GROMOS ATB repository.40 All simulations were performed in GROMACS 5.1.2.41 The GLYCAM06TIP5POSMO,r14 force field42,43 was used for chitosan, and the TIP5P model for the water molecules.44 The parameters for Dox and Gem were taken from the general AMBER (GAFF) force field.45 The partial charges for the modified GlcN monomers, Dox, and Gem were calculated following the GLYCAM06 protocol42 using the R.E.D. scripts.46 A cut-off of 1.4 nm was used for Lennard-Jones and electrostatic interactions. Long-range electrostatic interactions were evaluated using particle mesh Ewald.47 Covalent bonds involving hydrogen atoms were constrained with the LINCS algorithm,48 while water molecules were kept rigid using SETTLE.49 Following energy minimization, a 50 ns NPT equilibration run was conducted at the temperature of 300 K and pressure of 1 bar using the Nosé–Hoover thermostat50,51 and the Parrinello–Rahman barostat.52 Subsequently, a 400 ns NVT equilibration run was performed using the average box size extracted from the NPT trajectory and the Nosé–Hoover thermostat,50,51 followed by a 100 ns production MD run. A time step of 2 fs was used, and energy and pressure dispersion corrections were applied where appropriate. To extract forces for the CG procedure, separate reruns of the MD trajectories containing only solute–solute, solute–solvent, or solvent–solvent interaction were calculated25 using the reaction-field method53 for long-range electrostatics.2.2. Coarse-grained model
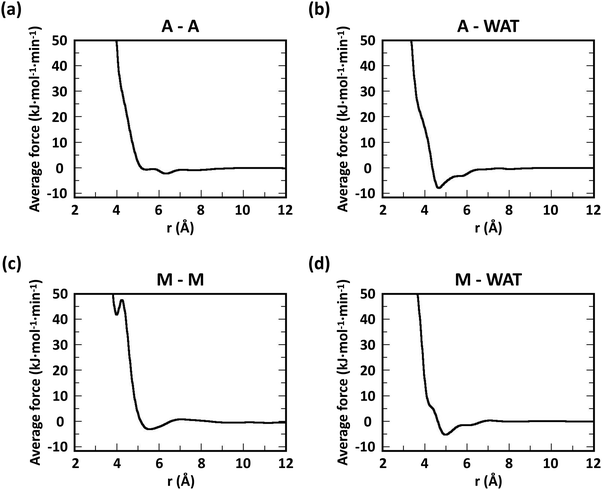
Following previous CG models,25 GlcN monomers were mapped to 3 CG sites (A, B and C), as shown in Fig. 1a–c. Acetyl, butanoyl or heptanoyl modifications were mapped into one (M), two (MA and MB), or three (MA, MB, and MC) CG sites, respectively, using center-of-mass mapping. Water molecules were mapped to one CG site located at their center of geometry. The potentials for bond, angle, dihedral interactions, as well as specific non-bonded 1–3 and 1–4 interactions (i.e., between third and fourth bonded neighbors) were obtained from Boltzmann inversion35 using the VOTCA package.23,87 The list of all bonded interactions is reported in Sections S1 and S2 (ESI†). The non-bonded interaction potentials were obtained from the MS-CG method to match the forces sampled at the atomic scale34 using the re-run trajectories with separate solute–solute, solute–solvent, and solvent–solvent interactions (note: these interaction potentials are not by default Lennard-Jones-like and can, in principle, feature different profiles, while resembling the Lennard-Jones shape, as shown in Fig. 2). The bonded and intra-molecular interactions obtained from the Boltzmann inversion were excluded from the MS-CG procedure. Dox was mapped to 11 CG sites using 9 different CG bead types (DA through DI, Fig. 1d) and arranged in a planar geometry. Gem was mapped to 4 CG sites (GA through GD, Fig. 1e). The CG interactions for the drug molecules were obtained by the same procedure as described above for chitosan.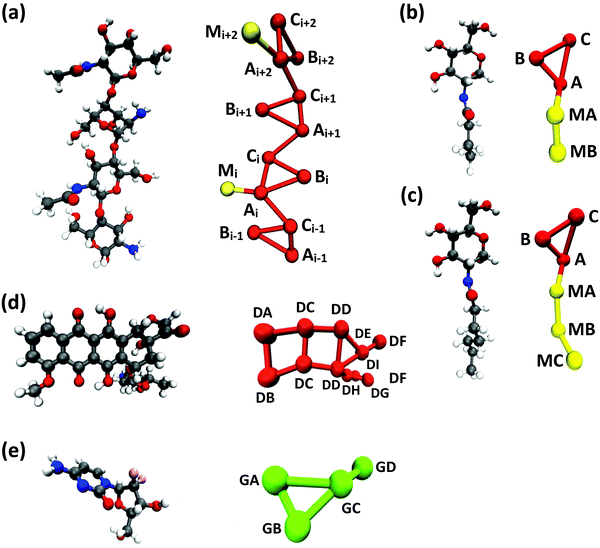 | ||
| Fig. 1 CG mapping of the atomistic structures of (a) acetyl-chitosan with DP = 4 and χAc = 50%, (b) N-butanoyl-glucosamine, (c) N-heptanoyl-glucosamine, (d) Dox, and (e) Gem. | ||
2.3. Coarse-grained simulations
The following CG simulations of systems (i)–(iv) were performed using GROMACS 4.6.4: (a) 10 chitosan chains with DP = 16, as simulated at all-atom resolution; (b) 50 chains with DP = 50 and evenly spaced modifications, solvated with 80![[thin space (1/6-em)]](https://www.rsc.org/images/entities/char_2009.gif) 000 water beads (32 water molecules per monomer); (c) 50 chains with DP = 50 and modifications grouped in blocks of four, solvated with 80
000 water beads (32 water molecules per monomer); (c) 50 chains with DP = 50 and modifications grouped in blocks of four, solvated with 80![[thin space (1/6-em)]](https://www.rsc.org/images/entities/char_2009.gif) 000 water beads; (d) 20 chains with DP = 50 and evenly spaced modifications, solvated with 100
000 water beads; (d) 20 chains with DP = 50 and evenly spaced modifications, solvated with 100![[thin space (1/6-em)]](https://www.rsc.org/images/entities/char_2009.gif) 000 water beads (100 water molecules per monomer); (e) 20 chains with DP = 50 and modifications grouped in blocks of four, solvated with 100
000 water beads (100 water molecules per monomer); (e) 20 chains with DP = 50 and modifications grouped in blocks of four, solvated with 100![[thin space (1/6-em)]](https://www.rsc.org/images/entities/char_2009.gif) 000 water beads. The initial structures of group (a) were obtained from the previous atomistic representations; groups (b)–(d) were initially constructed with atomistic resolution, and the corresponding initial structures and box-sizes for the CG simulations were obtained from 10 ns atomistic NPT simulations. All CG simulations were performed in the NVT ensemble using the leap-frog integrator with time steps of 1 fs and the Nosé–Hoover thermostat.50,51 CG simulations of group (a) were run for 10 ns to obtain equilibrated radial distribution functions (RDFs) and angle distributions. Simulations of 100 ns were run for groups (b–d), and the data from the last 10 ns was used for analysis.
000 water beads. The initial structures of group (a) were obtained from the previous atomistic representations; groups (b)–(d) were initially constructed with atomistic resolution, and the corresponding initial structures and box-sizes for the CG simulations were obtained from 10 ns atomistic NPT simulations. All CG simulations were performed in the NVT ensemble using the leap-frog integrator with time steps of 1 fs and the Nosé–Hoover thermostat.50,51 CG simulations of group (a) were run for 10 ns to obtain equilibrated radial distribution functions (RDFs) and angle distributions. Simulations of 100 ns were run for groups (b–d), and the data from the last 10 ns was used for analysis.
The network structures were characterized by calculating the distribution of pore size, following a published method;54 this procedure finds the largest sphere that can be constructed to contain randomly selected points in the network, and was implemented in this work with a constrained nonlinear optimization of the center of the sphere using the SOLVOPT routine.55 For every distribution, three snapshots of the network structures were taken at 5 ns intervals and analyzed. Finally, the diffusion coefficients of Dox and Gem in modified chitosan networks were obtained from the slope of their mean square displacement (MSD) as a function of time, and the corresponding van Hove functions were calculated using the built-in GROMACS routine. The numbers of contacts within 0.6 nm between the modification beads (M in acetyl-chitosan; MA and MB in butanoyl-chitosan; and MA, MB, and MC in heptanoyl-chitosan) in the network, as well as between the drug and the modification beads or between the drug and the backbone beads (A, B, and C) were calculated using the GROMACS mindist routine, counting only one contact per bead.
2.4. Experimental diffusion coefficient of Dox and Gem in modified chitosan hydrogels
Hydrogels comprising acetyl-chitosan (χAc = 16% or 50%), butanoyl-chitosan (χAc = 16% or 32%), or heptanoyl-chitosan (χHep = 8% or 24%) were constructed and loaded with either Dox or Gem at the same concentrations utilized in the simulations, following a procedure that we previously developed.56 Every drug-loaded gel was put into contact with an aqueous supernatant, which was sampled at set time points (1, 4, 8, 24, 48, and 72 hours) and analyzed by UV spectrophotometry to determine the amount of drug released from the gels into solution. The values of diffusion coefficient were finally calculated from the temporal data of drug release by applying a derived form of the Fick's second law outlined by Fu and Kao.573. Results
3.1. Model validation
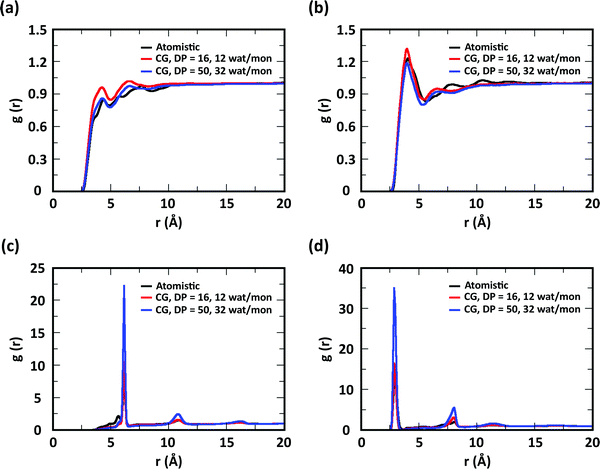
To evaluate the ability of our CG model to reproduce the local molecular structure of chitosan chains in solution and their tendency to aggregate, we initially compared the radial distribution functions (RDFs) of chitosan chains with DP = 16 obtained from atomistic and CG simulations. Collectively, the RDFs between all pairs of CG sites, provide information on short-range molecular structure, represented by the position and magnitude of the peaks at short distances, as well as the overall aggregation trends of the chitosan chains, visible in the long range behavior of the curve. Because the structural data was not used in the fitting procedure for non-bonded interactions, comparing the RDFs represents a real test for the quality of the model. To characterize the conformation of single chitosan chains, angle distributions and end-to-end distances were calculated.First, the RDFs obtained from CG simulations of chitosan chains with low degree of modification (χAc and χBut = 16%, and χHep = 8%) aligned well with the corresponding RDFs obtained from atomistic simulations. There is an excellent agreement between CG and all-atom data for the RDFs between water beads and the various CG sites of chitosan chains, as shown in Fig. 3. These monomer–water interactions are the most sensitive to long range perturbations and sampling issues, as shown in a previous study.25 The RDFs for all other pairs of CG sites obtained for modified chitosan chains with low χ from atomistic and CG simulations are reported in Fig. S1–S3 (ESI†). The small differences observed in the short-range structure of some of the RDFs are unlikely to have an effect on the larger scale structure of the networks. The simulated acetyl-chitosan system at χAc = 100% (Section 3.2.2) demonstrates in fact that local details can also be captured remarkably well. The largest differences in overall aggregation trends (i.e., long range tails in the RDFs) are observed in butanoyl-chitosan chains, for which all CG sites are slightly over-hydrated as compared to their all-atom counterparts. This means that the polymer–polymer aggregation observed in the simulated butanoyl-chitosan networks may be somewhat underrepresented. We note, however, that the differences are small and other factors such as water content and experimental control over the modification pattern are likely to have a much larger effect on the system, when comparing in silico vs. experimental data.
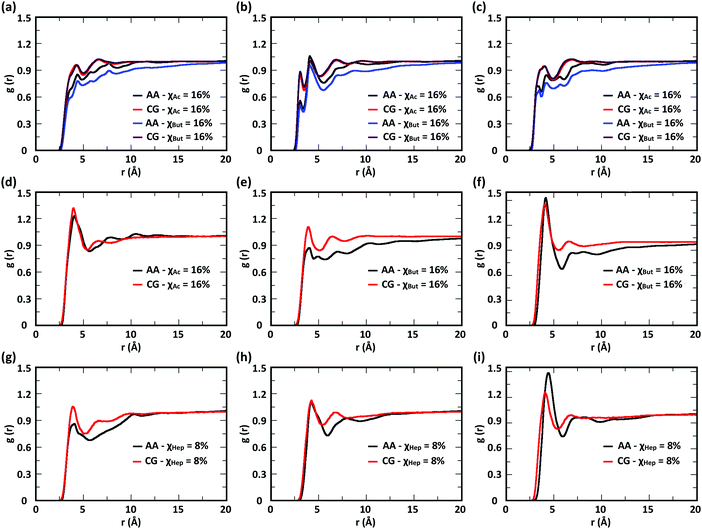 | ||
| Fig. 3 Comparison of atomistic and CG RDFs of the distances between modified-chitosan and water (W) beads: (a) A–W, (b) B–W, (c) C–W, (d) M–W, (e) MA–W, (f) MB–W, (g) MA–W, (h) MB–W, and (i) MC–W. Note: A, B, and C beads map the GlcN monomers, whereas MA, MB, and MC map the modification groups, as outlined in Section 2.2 and in Fig. 1. | ||
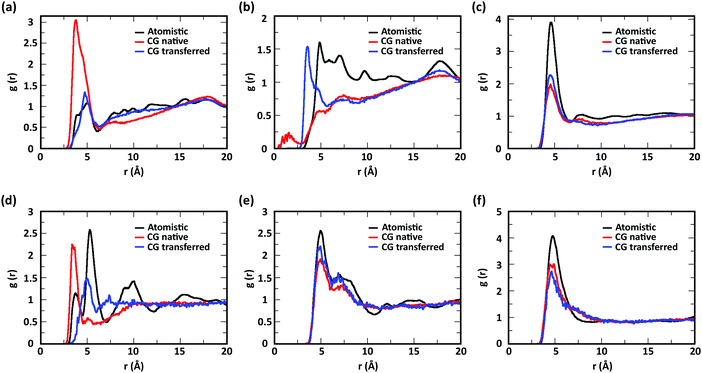
The RDFs for the hydrophobic beads derived from CG and atomistic simulations at higher χ (Fig. 4, black and red lines) deviate from their atomistic counterparts more than those obtained at lower χ. For example, the RDF of M–M (acetyl-to-acetyl) beads obtained from the CG simulation of acetylated chitosan with χAc = 32% exhibits a major peak at short distances (<6 Å, Fig. 4a), indicating an over-representation of the attractive interactions between the acetyl groups (M–M). Similarly, the CG RDFs of MA–MA distances (Fig. 4b) differ substantially from their atomistic counterparts at short distances (<6 Å) and show close contacts (<2.5 Å) that are physically unrealistic, and the close-range MA–MA interactions of heptanoyl-chitosan with χHep = 16% are over-represented by the CG model (Fig. 4d). Notably, the atomistic RDFs contain several irregular peaks at all distances, which suggests the formation of stable clusters as a result of the strong interactions between the modification groups, which is likely to prevent sufficient sampling of atomistic RDFs and forces at all distances; these sampling issues for the MA–MA interactions were confirmed by comparing the RDFs obtained in separate simulation runs (Fig. S4, ESI†). The differences between atomistic and CG results are more moderate for the RDFs of MB–MB distances in butanoyl-chitosan with χBut = 32% (Fig. 4b and c), and the RDFs of MB–MB, and MC–MC distances in heptanoyl-chitosan with χHep = 16% (Fig. 4d–f).
It is anticipated that the formation of kinetically trapped clusters and the ensuing limitations in adequately sampling the conformational space of the system may lead to non-representative interaction potentials because the all-atom forces do not represent the ensemble average. To avoid these issues, we tested the performance of CG interaction potentials that were obtained using chitosan chains with lower degree of modification (χAc and χBut = 16%, and χHep = 8%) and transferred them to systems with high degrees of modification (χAc and χBut = 32%, and χHep = 16%). A similar approach was demonstrated in a previous study,25 where the potentials obtained with a CG procedure were found to be transferable to systems at higher concentrations. The RDFs obtained with the transferred potentials (blue lines in Fig. 4) demonstrate a much better agreement with atomistic RDFs relative to the initial CG simulations (red lines) in modeling the M–M interactions for acetyl-chitosan (Fig. 4a), and remove the physically unrealistic close-contacts from the MA–MA interactions for χBut = 32% (Fig. 4b). Notably, the RDFs of the MA–MA interactions for both butanoyl-chitosan with χBut = 32% (Fig. 4b) and heptanoyl-chitosan with χHep = 16% (Fig. 4d) using the transferred potentials no longer exhibit the irregular peaks found in the all-atom systems, and closely resemble the RDF of the M–M interactions in acetyl-chitosan (note: because heptanoyl modifications are more hydrophobic and the effects of chain clustering are already observed χHep = 8%, the interaction potentials were obtained for χHep = 8% and transferred to χHep of 16% and 24%). Finally, the RDFs of MB–MB and MC–MC interactions remained unchanged by the transferred potentials and in overall agreement with their atomistic counterparts (Fig. 4c, e, and f). Similarly, the RDFs between all other CG sites remain unchanged when the transferred interaction potentials were used (Fig. S5–S7, ESI†). Collectively, these results demonstrate that the transferred interaction potentials (i.e., from lower to higher values of χ) improve the agreement between atomistic and CG simulations in modeling the interactions between hydrophobic sites, while preserving the agreement between CG and atomistic approaches for all other CG sites. Accordingly, in all the simulations presented in this study, we employed the CG interaction potentials obtained at χAc = 16%, χBut = 16%, and χHep = 8% to model systems at higher χ. Notably, this approach confers the additional advantage of rendering the model more versatile for constructing polysaccharides with different modification patterns.
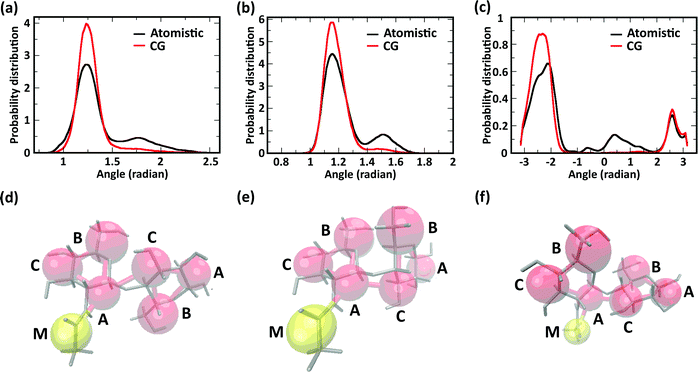
We further investigated the effect of chemical modification of chitosan chains on their conformation by evaluating angle distributions and end-to-end distances. The conformational space of single chitosan chains is governed predominantly by the glycosidic bonds between GlcN monomers, whose spatial arrangement is described by the dihedral angles φ and ψ. In the CG model presented here, the conformations of the φ and ψ angles are reflected by the two angles Bi–Ai–Ci+1 and Ai–Ci+1–Ai+1, as well as the dihedral angle Bi–Ai–Ci+1–Bi+1. The probability distributions of these angles sampled in the atomistic and CG simulations are reported in Fig. 5a–c, together with snapshots of the molecular conformations corresponding to the three main minima in the φ–ψ free energy landscape (Fig. 5d–f). Both atomistic and CG models returned angle distributions showing a bimodal distribution (Fig. 5a and b).
Regarding the Bi–Ai–Ci+1–Bi+1 dihedral angle, the atomistic model returned a distribution with three maxima (−140°, 30°, and 140°), corresponding to the three conformations shown in Fig. 5d–f, only two of which were reproduced by the CG model. The comparison between atomistic and GG distributions shows that the CG model provides a satisfactory representation of the dominant conformation for all three angles, although the states corresponding to the second energy minima (i.e., the maxima of probability distribution) are underrepresented in the distributions. This is due to the application of the Boltzmann inversion method without further iteration, which does not account for the effects of neighboring bonds and can therefore over-represents the stiffness of the interaction potentials. On the other hand, the second minimum provides a relatively minor contribution to the overall polymer conformation, as reflected for example by the end-to-end distances of the molecules.
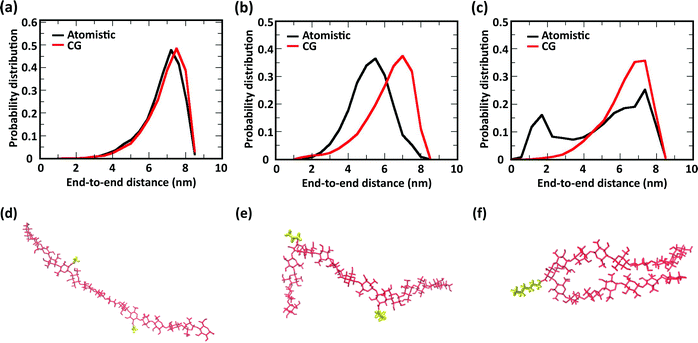
The comparison of the distribution of end-to-end distances sampled by atomistic and CG models is shown in Fig. 6. The polymer conformational space of acetyl-chitosan is captured very well by the CG model (Fig. 6a). For butanoyl- and heptanoyl-chitosan, the impact of the more rigid glycosidic links is slightly larger. This derives from the conformations adopted by the glycosidic links immediately adjacent to the substituted monomers, which show significantly shifted angle distributions (Fig. S8, ESI†). As a result, more compact conformations are more frequently sampled with butanoyl- and heptanoyl-chitosan chains (Fig. 6e and f). These compact states are underrepresented in the CG model, which employs the same bonded potentials for all glycosidic bonds, as shown by the distributions of end-to-end distances (Fig. 6b and c). Nonetheless, there is a considerable overlap between the atomistic and CG distributions, indicating that the conformational space of the chains is for the most part well represented in the CG model. It is however possible that the end-to-end distances observed in butanoyl- and heptanoyl-chitosan hydrogels are slightly overestimated, and that the transition to more compact polymer conformations, as observed in butanoyl-chitosan (Fig. 6b and e), may be initiated already at slightly lower χBut.
Next, we proceeded to test the effect of degree of polymerization (DP) and water/chitosan ratio (W/C) on the chitosan–chitosan and chitosan–water interactions. Initially, the transferability of the interaction potentials from concentrated systems (low W/C, namely 12 water molecules per GlcN monomer) to diluted systems (high W/C, namely 32 water molecules per GlcN monomer) was tested by comparing atomistic and CG RDFs for chitosan chains with DP = 16. As observed in similar systems,25 the RDFs obtained for the diluted system with the transferred interaction potentials closely resemble those from the atomistic simulations (all RDF plots are reported in Fig. S9 and S10, ESI†). Based on these results, a larger system comprising acetyl-chitosan chains (χAc = 16%) with DP = 50 and 32 water molecules per GlcN monomer was constructed and simulated. The resulting RDFs, reported in Fig. 7, indicate that the chitosan–water and chitosan–chitosan interactions are minimally affected by the value of DP. Only the peaks corresponding to the short-range interactions between bonded neighbors, such as those observed in the A–A and A–M RDFs (Fig. 7c and d), increased at higher DP, due to the presence of more bonded neighbors.
3.2. Structure of the chitosan hydrogels
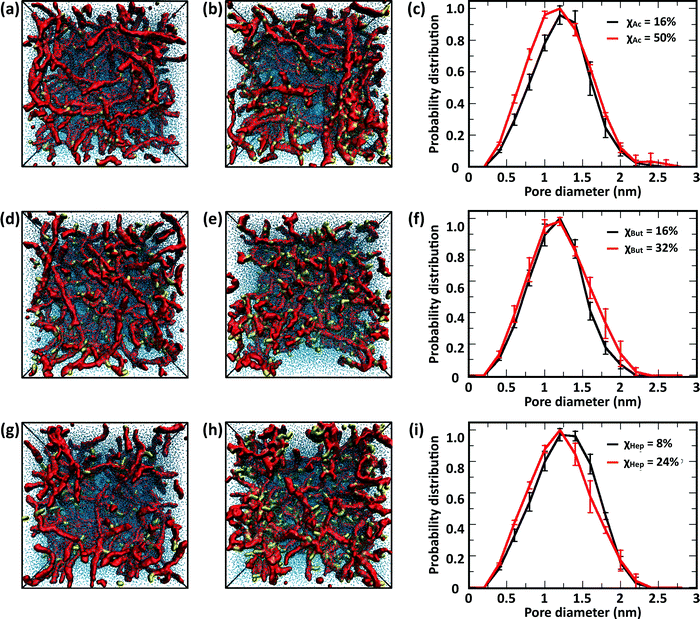
The CG model was applied to study the effects of modification type and χ, water/chitosan (W/C) ratio, and distribution (pattern) of the modification groups along the chitosan chains upon the morphology of the hydrated network of modified chitosan chains (hydrogel). The resulting structures were quantitatively characterized by measuring the distribution of pore sizes, the end-to-end distances of the chains, and the average number of contacts between the modification groups.![[thin space (1/6-em)]](https://www.rsc.org/images/entities/char_2009.gif) 000 water molecules (32 waters/monomer). The acetyl, butanoyl, or heptanoyl modifications were distributed along the polymer chains either in even pattern (Fig. 8) or blocky (Fig. S11, ESI†) pattern. The resulting networks, snapshots for which are presented in Fig. 8a, b, d, e, g and h, feature chitosan chains uniformly distributed throughout the simulation box. The visual similarity between the network structures was confirmed by the distribution of pore sizes in these networks. The pore size distributions (Fig. 8c, f, and i) calculated for acetyl-, butanoyl-, and heptanoyl-chitosan networks were found to be nearly independent of χ, and feature a relatively narrow distribution with most pore diameters in the range of 1.0 to 1.5 nm. Despite the overall similarity, however, the simulation snapshots suggest that the modifications with higher hydrophobicity (i.e., butanoyl and heptanoyl) tend to aggregate into local hydrophobic clusters.
000 water molecules (32 waters/monomer). The acetyl, butanoyl, or heptanoyl modifications were distributed along the polymer chains either in even pattern (Fig. 8) or blocky (Fig. S11, ESI†) pattern. The resulting networks, snapshots for which are presented in Fig. 8a, b, d, e, g and h, feature chitosan chains uniformly distributed throughout the simulation box. The visual similarity between the network structures was confirmed by the distribution of pore sizes in these networks. The pore size distributions (Fig. 8c, f, and i) calculated for acetyl-, butanoyl-, and heptanoyl-chitosan networks were found to be nearly independent of χ, and feature a relatively narrow distribution with most pore diameters in the range of 1.0 to 1.5 nm. Despite the overall similarity, however, the simulation snapshots suggest that the modifications with higher hydrophobicity (i.e., butanoyl and heptanoyl) tend to aggregate into local hydrophobic clusters.
To obtain a more detailed picture of the local molecular interactions within the networks, we measured the number of contacts with distances below 0.6 nm between the modification groups (Table 1). Specifically, the contacts between (i) all M beads in acetyl-chitosan networks, (ii) between MB and all MA or MB beads in butanoyl-chitosan networks, and (iii) between MA and any MA, MB or MC beads in heptanoyl-chitosan networks were counted. As anticipated, the number of contacts was found to increase with the hydrophobicity of the modification group and χ. In acetyl-chitosan systems with evenly-spaced modification pattern, the average number of contacts between M beads grows from a minimum of only 0.07 ± 0.02 per modified monomer when χAc = 16% to 0.22 ± 0.02 when χAc = 50%. Similarly, the contacts formed by the butanoyl MB beads increases from 1.08 ± 0.02 when χBut = 16% to 1.25 ± 0.01 when χBut = 32%. Finally, the heptanoyl MC beads form on average 1.53 ± 0.006 contacts per monomer when χHep = 8%, and 1.63 ± 0.015 contacts when χHep = 24%.
| Modification | Evenly-spaced | Blocky | ||
|---|---|---|---|---|
| Total | Per modification bead | Total | Per modification bead | |
| χ Ac = 16% | 28 ± 7 | 0.07 ± 0.02 | 37 ± 9 | 0.09 ± 0.02 |
| χ Ac = 50% | 273 ± 2 | 0.22 ± 0.002 | 319 ± 23 | 0.26 ± 0.02 |
| χ But = 16% | 433 ± 8 | 1.08 ± 0.02 | 456 ± 12 | 1.14 ± 0.03 |
| χ But = 32% | 1002 ± 15 | 1.25 ± 0.01 | 1034 ± 20 | 1.29 ± 0.03 |
| χ Hep = 8% | 306 ± 9 | 1.53 ± 0.006 | 399 ± 11 | 2.00 ± 0.06 |
| χ Hep = 24% | 980 ± 18 | 1.63 ± 0.015 | 1383 ± 24 | 2.35 ± 0.04 |
Together with the contact numbers, the values of end-to-end distance provide insight into the role of chain modification and intermolecular interactions on the conformation of chitosan. The variation in average end-to-end distance with different modification groups, χ, and pattern (i.e., evenly spaced or blocky) is presented in Table 2. A consistent trend is observed, where acetylation increases the end-to-end distances, and both butanoation and heptanoation drive a sharp decrease. The amide bond introduced by acetylation, combined with its mild hydrophobicity, promotes the formation of chitosan–water and chitosan–chitosan hydrogen bonds. This in turn drives the alignment of chitosan chains, whether single or in a network, which translates in higher end-to-end distances. Butanoyl and heptanoyl groups, instead, impart a higher hydrophobicity, which promotes intramolecular monomer–monomer interactions and chain de-solvation. These results demonstrate that the modification type and χ can be determining parameters for the structure of the chains, and larger changes to the network structure are likely hindered predominantly by the dense packing in the networks.
| Modification | Evenly spaced | Blocky | |||
|---|---|---|---|---|---|
| Single chain | Concentrated network (50 chains) | Dilute network (20 chains) | Single chain | Dilute network (20 chains) | |
| Note: the values of end-to-end distance did not change in going from concentrated network to dilute network (data not shown). | |||||
| χ Ac = 16% | 15.4 ± 3.6 | 14.6 ± 0.4 | 14.4 ± 0.6 | 12.1 ± 4.06 | 15.4 ± 0.6 |
| χ Ac = 32% | 15.1 ± 0.2 | 15.4 ± 0.7 | 15.4 ± 0.6 | ||
| χ Ac = 50% | 15.9 ± 4.2 | 16.2 ± 0.3 | 16.1 ± 0.9 | 16.29 ± 3.92 | 15.7 ± 0.6 |
| χ But = 16% | 10.2 ± 5.1 | 12.9 ± 0.5 | 12.7 ± 0.8 | 13.68 ± 3.65 | 13.4 ± 0.6 |
| χ But = 24% | 11.8 ± 0.3 | 10.4 ± 0.5 | 13.0 ± 0.4 | ||
| χ But = 32% | 8.7 ± 3.4 | 9.0 ± 0.3 | 5.6 ± 0.4 | 10.84 ± 3.66 | 10.2 ± 0.3 |
| χ Hep = 8% | 13.2 ± 3.7 | 13.5 ± 0.5 | 13.1 ± 0.7 | 10.42 ± 3.78 | 13.0 ± 0.4 |
| χ Hep = 24% | 11.7 ± 3.7 | 11.8 ± 0.3 | 12.4 ± 0.9 | 9.94 ± 1.38 | 12.4 ± 1.1 |
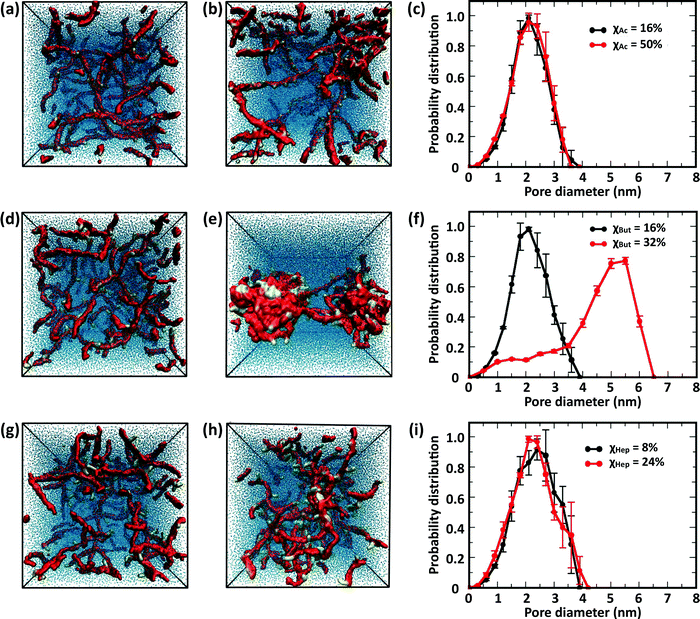
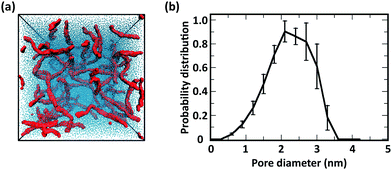
![[thin space (1/6-em)]](https://www.rsc.org/images/entities/char_2009.gif) 000 CG water beads (i.e., 100 water molecules per GlcN monomer), corresponding to a water weight fraction of 90% w/w. Representative snapshots collected from the MD simulations of chitosan chains with even modification and the corresponding distribution of pore sizes are reported in Fig. 9, while the number of contacts between CG beads are listed in Table 3 (note: as the W/C ratio increases, the number of M beads and M–M contacts decrease; therefore, the number of contacts normalized by the number of modifications is also reported to enable a better comparison with the analogous results for more concentrated systems reported in Table 1). The corresponding results for chitosan chains with blocky modifications are in Fig. S12 (ESI†).
000 CG water beads (i.e., 100 water molecules per GlcN monomer), corresponding to a water weight fraction of 90% w/w. Representative snapshots collected from the MD simulations of chitosan chains with even modification and the corresponding distribution of pore sizes are reported in Fig. 9, while the number of contacts between CG beads are listed in Table 3 (note: as the W/C ratio increases, the number of M beads and M–M contacts decrease; therefore, the number of contacts normalized by the number of modifications is also reported to enable a better comparison with the analogous results for more concentrated systems reported in Table 1). The corresponding results for chitosan chains with blocky modifications are in Fig. S12 (ESI†).
| Modification | Evenly spaced | Blocky | ||
|---|---|---|---|---|
| Total | Per modification bead | Total | Per modification bead | |
| χ Ac = 16% | 4 ± 2 | 0.025 ± 0.012 | 5 ± 3 | 0.03 ± 0.02 |
| χ Ac = 50% | 46 ± 10 | 0.092 ± 0.02 | 56 ± 10 | 0.11 ± 0.02 |
| χ But = 16% | 165 ± 3 | 0.41 ± 0.01 | 308 ± 3 | 1.92 ± 0.02 |
| χ But = 32% | 561 ± 10 | 1.03 ± 0.06 | 507 ± 16 | 1.58 ± 0.05 |
| χ Hep = 8% | 115 ± 5 | 1.44 ± 0.06 | 151 ± 6 | 1.89 ± 0.08 |
| χ Hep = 24% | 233 ± 7 | 0.97 ± 0.03 | 491 ± 15 | 2.04 ± 0.06 |
These results indicate that the overall structure of the networks formed by acetylated chitosan chains remains independent of χ (Fig. 9a–c), as was observed in systems at the higher chitosan concentration (Fig. 8). The acetyl-chitosan chains are evenly distributed throughout the simulation box, and the pore-size distributions are independent of χ and feature pore sizes between 1.5–2.5 nm.
The butanoyl-chitosan systems, on the other hand, show a drastic restructuring of the chain network as χBut increases from 16% to 32%. This triggers the formation of dense “micelle-like” structures, comprising clusters of butanoyl moieties surrounded by chitosan backbones, connected by individual polymer strands (Fig. 9e). The transition of the network morphology from homogeneous to cluster/channel is accompanied by a distinct increase in the measured pore size, from 1–3 nm to 4.0–6.0 nm (Fig. 9f). While partly caused by the larger size of the simulation box, the observed variations of pore size are an important indicator of the morphological change of the network. The value of pore size in the larger systems are determined both by the water content and the length of the polymer bridges.
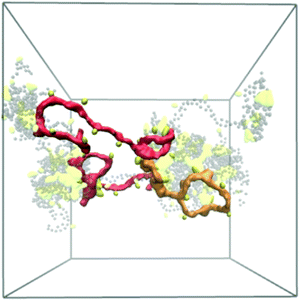
Reflective of this morphological change, a notable decrease in the end-to-end distances from 12.7 ± 0.8 nm (χBut = 16%) to 5.6 ± 0.4 nm (χBut = 32%) was observed in this network (Table 2), which results from the chitosan backbones wrapping the butanoyl clusters. A closer inspection of the cluster-channel structure (Fig. 10) indicates that the clusters comprise several hydrophobic domains (or centers) with diameters of ∼1–1.5 nm, corresponding to approximately twice the length of the hydrophobic moieties. These domains coalesce into larger clusters featuring almost completely hydrophilic surfaces formed by layers of chitosan chain backbone. The persistence length of chitosan chains, which experimental measurements estimate to be in the range of 5–20 nm58–60 and our simulations indicate it to be ∼5 nm (based on the end-to-end distance, Table 2), is comparable to the separation between adjacent modification groups on the chains. Forming loops at this scale would lead to a considerable cost in bending energy. Thus, separate hydrophobic moieties of one polymer chain do not typically cluster in one hydrophobic domain, but are rather embedded in separate hydrophobic domains that can either be part of the same larger cluster (Fig. 10, orange) or as bridges between two larger clusters (Fig. 10, red). In both cases, the modified chitosan chains remain approximately linear on the length scale of several monomers (i.e., their persistence length). Both micelles with intermolecular hydrophobic domains, resembling the clusters observed here61 and the bridged micelles62 have been proposed as probable models for the structure of hydrophobically modified chitosan.
Interestingly, no morphological transition took place in heptanoyl-chitosan systems, despite the higher hydrophobicity of the heptanoyl groups. While small clusters of M beads can be observed in the simulation snapshots, the pore size distribution remains approximately constant with χHep. Consistent with the absence of hydrophobic clusters, no significant decrease in end-to-end distances was observed (Table 2).
This different behavior of butanoyl- and heptanoyl-chitosan networks stems from the association between the hydrophobic modification groups, which is much stronger with heptanoyl moieties. Accordingly, the initial heptanoyl clusters are too stable to allow a rearrangement of the network into a cluster/channel morphology, which requires dissociation and rearrangement of some of these initial contacts, i.e., the uniform networks are kinetically trapped. While it is possible that network structures appear to be kinetically trapped due to insufficient simulation time, the experimental values of drug diffusion throughout heptanoyl-chitosan systems (vide infra) indicate that similar effects are present at the experimental time scale. Furthermore, the numbers of contacts per modification bead in diluted networks formed by butanoyl-chitosan chains with χBut = 32% and heptanoyl-chitosan chains with χHep = 24% (Table 3) are nearly identical to the corresponding values found in concentrated networks (Table 1). This showcases the role of hydrophobic modifications in forming contacts among modified chitosan chains.
A random distribution of acyl groups on the GlcN monomers is generally assumed for modified chitosan and has been supported by NMR analysis of chitosan samples with different degrees of acetylation (χAc).65 However, the acylation pattern of chitosan chains can vary; for example, several studies have shown that deacetylation of chitin under heterogeneous conditions can result in chitosan with blocky modification patterns.74–76 The use of hydrophobic groups for chitosan modification can also promote the formation of blocky patterns: hydrophobic moieties initially installed on the chain act as “seeding points”, as they attract incoming modification reagents by hydrophobic interaction and promote their local conjugation to the chains. The local accumulation of modification groups around hydrophobic focal points translates into the formation of blocky patterns. The aliphatic chains introduced by butanoic and heptanoic anhydrides can lend themselves to this mechanism.
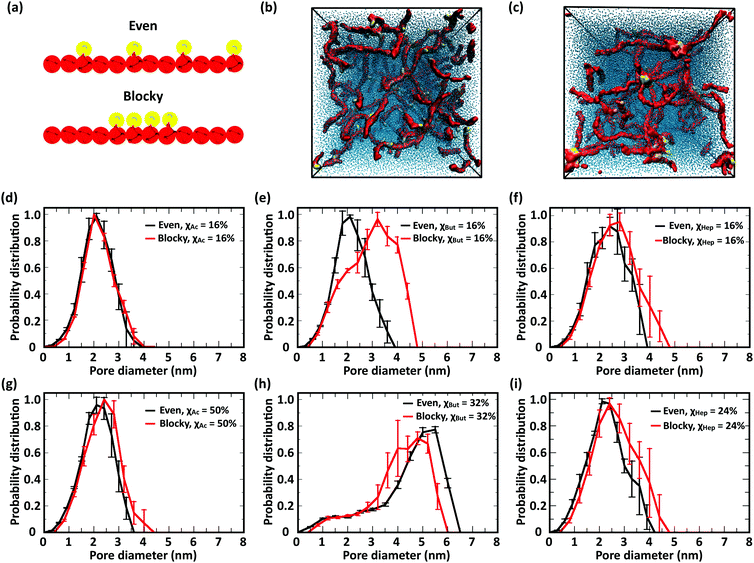
In this study, we investigated the effect of modification patterns using two model distributions, evenly spaced and regular blocky. Blocky patterns in real polymers likely comprise a distribution of block sizes; similarly, truly random patterns also comprise short blocks of different length. Constructing realistic models of irregular blocky and truly random polymers in silico is not only challenging from the point of view of design, but can also return equivocal results. Therefore, to elucidate the role of modification pattern on chain structure and network morphology, we resolved to compare two idealized modification patterns: (i) “evenly spaced” with single modified monomers distributes at equal distances along the polymer and (ii) “blocky”, where four consecutive monomers bear modifications (Fig. 11a). In the comparison between these different patterns, the largest influence on the network morphology is, once again, observed in butanoyl-chitosan. The networks of butanoyl-chitosan chains, featuring identical χBut = 16% and DP = 50 and blocky vs. evenly spaced modification, shown in Fig. 11b, illustrates the effect of pattern on chain aggregation and network morphology. A systematic investigation of the combined effect of modification type, χ, and pattern on the number of contacts and end-to-end distances of modified chitosan chains (Tables 1–3) and the pore size distribution (Fig. 11d–i) of the resulting structures indicates that the acetyl-chitosan networks do not possess any structural dependence upon modification pattern. Acetyl-chitosan features a two-fold helical structure, where neighboring modifications lie on alternating sides of the chain.77 Therefore, an increase in the number of contacts can occur only if the modifications aggregate into local clusters. The constant number of contacts in both concentrated and dilute acetyl-chitosan systems (Tables 1 and 3) indicates that such clustering at low water/chitosan ratio does not depend on the modification pattern. Similarly, chain–chain interactions and network morphology in concentrated butanoyl-chitosan networks (low W/C) do not present any correlation to modification pattern (Table 1). A different scenario appears in diluted (high W/C) butanoyl-chitosan systems with lower χBut (16%), where chain aggregation is promoted by the blocky patterning (Fig. 11e); at χBut = 32%, on the other hand, the cluster/channel architecture of the network and its characteristic higher pore sizes are formed irrespective of the modification pattern (Fig. 11h). Finally, in heptanoyl-chitosan systems, the number of contacts is consistently higher between chains with blocky modification patterns (Tables 1 and 3); the stronger tendency of blocky heptanoyl-chitosan towards the cluster/channel architecture is also indicated by the small, yet notable, increases in pore size for both low (χHep = 8%) and high (χHep = 24%) levels of modification (Fig. 11f and i). Nonetheless, this effect is much less pronounced in heptanoyl-chitosan systems than in butanoyl-chitosan systems. The strong hydrophobic interactions between heptanoyl groups, in fact, make the chain network more rigid and prevents its rearrangement into the cluster/channel morphology.
Consistent with experimental observations, our CG simulation was also able to predict the formation of thick chitin fibrils consisting of bundles of aligned single chitin chains (Fig. 13a); coherent with chain alignment, the values of end-to-end distance of the aligned polymers increases to 20.4 ± 0.4 nm, as compared to ∼15 nm in the gels. Chitin forms crystalline fibrils wherein the alignment of the chains is either anti-parallel (i.e., α-chitin79,80) or parallel (i.e., β-chitin81). Both chitin allomorphs are found in natural chitin, although β-chitin has never been recrystallized in vitro. In the CG simulations, in fact, half of the chitin chains in every fibril form the anti-parallel alignment observed of α-chitin, while the other chains are aligned in parallel as in β-chitin (Fig. 13b), determined predominantly by the assembly kinetics. The simulated fibrils, however, are more strongly twisted compared to the reported crystal structures.
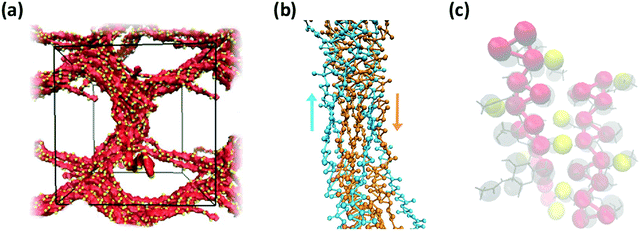 | ||
| Fig. 13 (a) Simulation snapshot of a network of fibers formed by 20 chains of chitin (χAc = 100%) with DP = 50 and 100 water molecules/monomer; the beads in the chitosan backbone (A, B, and C) are in red, the acetylation beads M are in yellow, and the water beads are blue dots. (b) Alignment of chitin chains in the simulated fiber; chitin chains with antiparallel and parallel alignment are in orange and blue, respectively; (c) comparison between predicted (red and yellow spheres) and experimentally determined structure of α-chitin chains (grey sticks: all-atom structure,79,80 grey spheres: CG representation). | ||
Both effects are likely due to the onset and evolution of the aggregation process in silico, where the outcome of fiber alignment is strongly dependent on the first contacts formed. Nonetheless, the molecular structure and intermolecular contacts in the segments with anti-parallel alignment produced by the CG simulations show remarkable similarity with those detected experimentally in α-chitin79,80 (Fig. 13c). At the same time, reproducing fully the crystal fibers and the internal orientation of the chains in such large systems is beyond the capability of unbiased simulations, which are kinetically constrained. Collectively, these results demonstrate the ability of the proposed CG model to capture the molecular aggregation and simulate the architectural features of chitosan-based hydrogels across the entire range of χAc. Remarkably, the model maintains reasonable predictive accuracy for values of χAc that differ significantly from those upon which the CG interaction potentials were developed.
3.3. Correlating hydrogel properties to the diffusion of probe molecules
Chitosan hydrogels have been extensively utilized as materials for tissue engineering, wound healing, and drug delivery.1–3,13,14,82 Their optimization as drug delivery carriers for clinical applications, however, is extremely laborious due to the width of the experimental space of design controlling drug loading and release.56 Computational models capable of predicting the transport of drugs through chitosan-based hydrogels hold great promise to accelerate pre-clinical development and ultimately improve translation potential. Key to this end is the ability of the model to connect physicochemical properties and architecture of the chain network and drug properties. The characteristic size and complexity of these systems prompts the adoption of CG models, whose smoother energy landscape typically enables faster systems dynamics15,16 and therefore a more efficient investigation of the dependence of drug delivery upon a wide space of design.In this work, we adopted the synergistic chemotherapeutic pair doxorubicin (Dox) and gemcitabine (Gem) as model molecules to study diffusion through modified chitosan hydrogels. Gem is a small (263.2 g mol−1), hydrophilic and electrically neutral species, whereas Dox is larger (543.5 g mol−1) and amphiphilic. CG models of Dox and Gem were initially prepared through the mapping shown in Fig. 1, while the drug–drug, drug–solvent, and drug–chitosan interactions were obtained from initial all-atom simulations following the same steps as for the chitosan interactions. Initially, we calculated the diffusion coefficients of the two drugs in water using atomistic and CG simulations, and compared them with experimental data (Table 4) to characterize the dynamics in our CG systems. The value of water self-diffusion coefficients obtained from atomistic simulations (DASW,W) agrees with the diffusion coefficients reported in the literature for the TIP5P water model83 and is similar to diffusion coefficients determined experimentally (DExpW,W).84 As anticipated, the water diffusion coefficient provided by CG simulations (DCGW,W) is larger, resulting in a scaling factor (τW = DCGW,W/DASW,W) of 6.4. Similarly, scaling factors of 9.6 and 10.0 were found for Gem and Dox, respectively, between the values of diffusion coefficients derived from atomistic vs. CG simulations. We note, however, that Dox molecules tend to form small aggregates, both in atomistic and CG simulations, which may affect the observed scaling factor; a single molecule in a box of water, in fact, has a 10-fold faster diffusion. If the scaling obtained for water (τW = 6.4) is applied to Dox, the resulting adjusted diffusion coefficient DCG,scaledDox,W ∼ 0.1 × 10⁻⁵ cm2 s−1 is in rather good agreement with the range of experimental values, 0.158–0.996 0.2 × 10⁻⁵ cm2 s−1;85,86 similarly, scaling the diffusion coefficient of Gem by τW returns a value of DCG,scaledGem,W ∼ 0.55 × 10⁻⁵ cm2 s−1. Therefore, upon rescaling, the CG model provides a reasonable prediction of the diffusion coefficients of the model drugs.
| Molecule | Source | D (10−5 cm2 s−1) |
|---|---|---|
| a New simulations were performed to avoid cluster formation. | ||
| Water | Experimental84 | 2.3 |
| Atomistic MD simulations | 2.74 ± 0.16 | |
| CG MD simulations | 17.53 ± 0.73 | |
| CG MD simulations, scaled | 2.74 ± 0.03 | |
| Dox | Experimental85,86 | 0.158–0.996 |
| Atomistic MD simulations | 0.056 (cluster) − 0.144(single) ± 0.017 | |
| CG MD simulations | 0.625 ± 0.058 | |
| CG MD simulations, scaled | 0.098 ± 0.005 | |
| Gem | Atomistic MD simulationsa | 0.382 ± 0.005 |
| CG MD simulations | 3.683 ± 0.626 | |
| CG MD simulations, scaled | 0.575 ± 0.098 | |
To model diffusion through modified chitosan hydrogels, 20 drug molecules – either Dox or Gem – were randomly placed inside an equilibrated network comprising 20 chains (DP = 50 and 5000 water molecules per chain) of either (i) acetyl-chitosan (χAc = 16% or 50%), (ii) butanoyl-chitosan (χBut = 16% or 32%), or (iii) heptanoyl-chitosan (χHep = 8% or 24%) featuring either evenly-spaced or blocky modification patterns. The diffusion of Dox and Gem through the networks was analyzed by tracking the mean-square displacement (MSD) of the drug molecules vs. time, from which the corresponding diffusion coefficients were calculated. In parallel, following the experimental procedure developed in prior work,56 the above-listed hydrogels were constructed and loaded with either Dox or Gem at the same concentration as utilized in the simulations, and the drug release was measured as a function of time. From the resultant drug release profiles, the values of diffusion coefficients were calculated by applying a derived form of the Fick's second law for slab-like devices.57 The in silico and experimental results are collated in Table 5.
| D Dox,Chit (10−5 cm2 s−1) | |||
|---|---|---|---|
| Modification | CG model | Experimental | |
| Evenly spaced | Blocky | ||
| χ Ac = 16% | 0.268 ± 0.100 | 0.213 ± 0.034 | 0.538 ± 0.107 |
| χ Ac = 50% | 0.161 ± 0.003 | 0.191 ± 0.000 | 0.170 ± 0.035 |
| χ But = 16% | 0.257 ± 0.042 | 0.150 ± 0.050 | 0.685 ± 0.140 |
| χ But = 32% | 0.827 ± 0.039 | 0.550 ± 0.082 | 0.801 ± 0.162 |
| χ Hep = 8% | 0.406 ± 0.070 | 0.345 ± 0.096 | 0.244 ± 0.049 |
| χ Hep = 24% | 0.610 ± 0.146 | 0.274 ± 0.052 | 0.424 ± 0.090 |
| D Gem,Chit (10−5 cm2 s−1) | |||
|---|---|---|---|
| Hydrogel modification | Evenly spaced | Blocky | Experimental |
| χ Ac = 16% | 3.878 ± 0.764 | 3.787 ± 0.422 | 3.344 ± 0.644 |
| χ Ac = 50% | 3.572 ± 0.470 | 3.905 ± 0.150 | 3.713 ± 0.738 |
| χ But = 16% | 3.906 ± 0.149 | 3.588 ± 0.464 | 3.756 ± 0.719 |
| χ But = 32% | 3.078 ± 0.126 | 3.160 ± 0.300 | 3.313 ± 0.650 |
| χ Hep = 8% | 3.603 ± 0.761 | 4.230 ± 0.515 | 3.156 ± 0.619 |
| χ Hep = 24% | 3.760 ± 0.427 | 3.600 ± 0.055 | 3.050 ± 0.631 |
The CG simulations indicate that the diffusion of Gem through modified chitosan networks DCGGem,Chit is not affected by the modification type, χ, and pattern, and is only slightly lower than the corresponding value in water (DCGGem,W, Table 5). This was confirmed by the experimental values of DExpGem,Chit. With its hydrophilic character and small size (Rgyr = 0.33 nm) compared to the average pore diameter of the simulated networks (1.2 nm), Gem can migrate seamlessly through the chitosan hydrogel. The absence of strong interactions with the chitosan networks is corroborated by the low number of Gem–chitosan contacts (Table 6).
| Hydrogel modification | Dox – modification bead | Gem – modification bead | Dox – backbone bead | Gem – backbone bead | ||||
|---|---|---|---|---|---|---|---|---|
| Evenly spaced | Blocky | Evenly spaced | Blocky | Evenly spaced | Blocky | Evenly spaced | Blocky | |
| χ Ac = 16% | 27 ± 3 | 52 ± 4 | 6 ± 2 | 7 ± 3 | 416 ± 19 | 420 ± 18 | 56 ± 14 | 57 ± 13 |
| χ Ac = 50% | 83 ± 5 | 98 ± 5 | 18 ± 4 | 21 ± 5 | 470 ± 21 | 402 ± 18 | 72 ± 16 | 76 ± 17 |
| χ But = 16% | 50 ± 5 | 96 ± 19 | 7 ± 3 | 34 ± 8 | 417 ± 18 | 505 ± 21 | 65 ± 14 | 147 ± 20 |
| χ But = 32% | 89 ± 9 | 124 ± 10 | 58 ± 10 | 80 ± 18 | 475 ± 35 | 655 ± 27 | 368 ± 40 | 351 ± 18 |
| χ Hep = 8% | 73 ± 9 | 138 ± 19 | 5 ± 3 | 7 ± 8 | 286 ± 18 | 298 ± 20 | 49 ± 13 | 50 ± 13 |
| χ Hep = 24% | 118 ± 9 | 198 ± 10 | 16 ± 10 | 26 ± 18 | 325 ± 28 | 280 ± 16 | 53 ± 14 | 60 ± 13 |
On the other hand, with a larger size (Rgyr = 0.52 nm) and a distinctively higher hydrophobicity compared to Gem, Dox migrates more slowly. The diffusion coefficients of Dox obtained from CG models were found to be lower than the reference value in water (DCGDox,Chit < DCGDox,W) and to vary significantly with the type, χ, and pattern of modification. Specifically, Dox diffusion in acetyl-chitosan decreases moderately as χAc increases from 16% to 50%, whereas it increases more than 3-fold in butanoyl-chitosan between χBut = 16% and 32%, and 1.5-fold in heptanoyl-chitosan between χHep = 8% and 24%. The same trends were observed in the experimental values (Table 5).
The interactions with the chitosan network are reflected by the average number of Dox–polymer contacts (distance <0.6 nm), which account for both the hydrophobic interactions with the modified monomers (GlcNAc, GlcNBut, and GlcNHep) and the hydrogen bonds with the chain backbone (Table 6). Notably, the number of contacts between Dox and the acetyl groups (M beads) nearly triples as χAc increases from 16% to 50% in chitosan chains with evenly-modified pattern. Concurrently, the number of contacts with the backbone increases; as Dox molecules are attracted towards GlcNAc beads by hydrophobic interactions, they also form secondary contacts with the intercalated GlcN beads via hydrogen bonding.56 A different trend is observed with blocky acetyl-chitosan, where the number of interactions between Dox and M beads grows with χAc, whereas the number of contacts with backbone beads decreases; the blocky modification pattern, in fact, by removing the intercalation between the monomers, lowers the probability of Dox forming secondary interactions with GlcN as a consequence of initial hydrophobic binding to GlcNAc monomers. The interactions between Gem and acetyl-chitosan chains, instead, is more straightforward. The number of contacts with the M beads is low and independent of the modification pattern; the increase with χAc is related to the formation of hydrogen bonds with the amide moieties connecting M and A beads.56 The number of contacts with the backbone beads is higher and rather unaffected by either χAc or pattern.
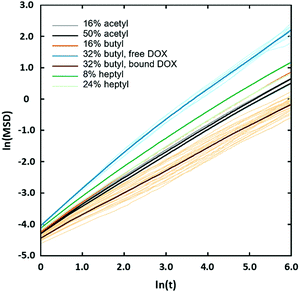
The observed sharp increase in Dox diffusion coefficient with χBut can be attributed to the formation of the large pores in the network following the transition from uniform structure to the cluster/channel morphology. With larger pores, the Dox molecules can diffuse freely through the aqueous medium without interacting with the butanoyl-chitosan chains (Fig. 9e), thereby increasing their mobility and ultimately their diffusion coefficient. On the other hand, it is also noted that Dox forms a higher number of contacts with both the backbone and the modification beads compared to that formed with the acetyl-chitosan chains (Table 6). The simulation snapshots of Dox diffusing through networks with different χBut and pattern, in fact, show that several Dox molecules adsorb onto – and become irreversibly embedded into – the chain clusters. This observation was confirmed by analyzing the mean squared displacement (MSD) of individual Dox molecules (Fig. 14). These fall into two distinct groups: one moving with normal Brownian diffusion (MSD ∝ D·Δtα, α = 0.98) and the other exhibiting a significantly slower dynamics (α ∼ 0.7). All the diffusion curves of Dox through the uniform networks fall between these two behaviors, with α comprised between 0.76–0.82; all the individual atoms in these systems show the same diffusion characteristics (Fig. S14, ESI†), consistent with the uniform structure of the networks. Furthermore, the van Hove functions (Fig. S13, ESI†) indicate some confinement at the length scale of ∼5 nm in the uniform networks; however, in the systems formed by butanoyl-chitosan chains with χBut = 32%, a small fraction of Dox molecules travel farther on a timescale of 8–10 ns than in any of the uniform networks. Similar larger displacements are also seen for heptanoyl-chitosan chains with χHep = 24%, indicating that these networks are less uniform than was suggested by the calculated distribution of pore sizes.
Accordingly, the increase in DCGDox,Chit with χBut resulting from the MSD analysis is uniquely due to unimpeded transport of unabsorbed Dox molecules through the pores of butanoyl-chitosan cluster/channel networks. So that the diffusion and release of Dox from hydrogels with such cluster/channel morphology will depend on the numbers of molecules diffusing through the pores, Np, and being adsorbed to the clusters, Ncl. These are determined by the partition coefficient  , where Ccl and Cp are the concentration of drug molecules adsorbed on the clusters and contained in the pores, and Vcl and Vw are the volumes of the chitosan clusters and water-filled pores. The number of molecules stuck to the clusters is thus determined both by the affinity of Dox for the hydrophobic moieties and the volume ratio of clusters in the network
  . In hydrogels with high water content (Vw ≫ Vcl), as is the case for the modified chitosan hydrogels considered in this study, the majority of Dox molecules will be located in the pores and the observed (average) Dox diffusion is governed by those molecules diffusing freely through the water filled pore space. The experimental values of Dox diffusion coefficient and total release from butanoyl-chitosan hydrogels increase with χBut, confirming the results of the CG model. Numerical discrepancies between simulated and measured diffusion likely stem from the difference in network hydration between in silico and the in vitro systems. Nonetheless, the CG model captures well the mechanisms determining the dependence of the diffusion coefficient of Dox upon χBut.
Finally, heptanoyl-chitosan networks present a hybrid behavior, intermediate between those of acetyl- and butanoyl-chitosan. The partial clustering of the heptanoyl moieties, while not producing a defined cluster/channel morphology, results in larger pores as χHep increases, especially with blocky heptanoation (Fig. 10f and i). As a results, the values of diffusion coefficient of Dox in heptanoyl-chitosan networks fall between those calculated in acetyl- and butanoyl-chitosan systems. Despite the increase in pore diameter, in fact, Dox retention by the heptanoyl-chitosan chains is significant, as shown by the high number of hydrophobic interactions with the modification beads (Table 6). As a result, the diffusion coefficient of Dox through heptanoyl-chitosan with evenly spaced modification increases with χHep, as in butanoyl-chitosan, whereas it decreases when heptanoation is blocky, as in acetyl-chitosan. These values indicate that Dox diffusion is determined by the effective hydrophobicity of the chains and the morphology of the network, which are interconnected to the design parameters of the chitosan hydrogel (i.e., chemical modification and water fraction). The comparison between these predictions and the experimental data reported in Table 5 showcases the predictive accuracy of the proposed CG model, which stems from its ability to accurately determine diffusion coefficients while accounting for the interplay between modification-based molecular architecture and the chitosan–drug interactions.
4. Conclusions
Pre-clinical development of polysaccharide-based hydrogels for drug delivery applications consists of the systematic evaluation of the wide range of design parameters, such as base chemical composition and physicochemical modification of the substrate materials, the water to polymer ratio, and the pharmaceutical payload. A purely empirical approach to the exploration of such a wide design space is unfeasible in terms of both times and costs. To accelerate pre-clinical development, we have developed and demonstrated a systematic bottom-up CG model for evaluating drug transport through hydrogels constructed with chitosan chains featuring different types, degrees, and patterns of modifications. This CG model does not require any empirical data input to make predictions of the molecular architecture or the drug transport properties through the hydrogels. Numerous types of modification and therapeutic payloads, other than those explored here, can therefore be integrated into this model by implementing the CG procedure outlined herein.This study demonstrates that the proposed CG model (i) is flexible and can be transferred to large systems comprising many long polysaccharide chains and different water contents; (ii) accurately captures the supramolecular structures (e.g., clusters/channels, fibers) and connects them to basic design parameters; and (iii) predicts very accurately the transport of small drugs through these materials by virtue of a comprehensive interpretation of the fundamental physicochemical properties and molecular interaction mechanisms. In so doing, this model provides a study toolbox with two-fold significance. In terms of fundamental science, our model enables the use of simple measurements of diffusion of small organic molecules (e.g., fluorescent Dox molecules) in lieu of laborious and expensive experimental techniques (e.g., small angle neutron or light scattering) to evaluate the molecular and supramolecular architecture of modified polysaccharide hydrogels. In terms of technological relevance, this model provides pharmaceutical chemists with a reliable rationale for focusing their developmental efforts towards a specific subset of the wide space of experimental design inherent to drug-loaded soft materials, allowing them to rapidly tailor therapeutic materials that meet the need of different therapeutic treatments, covering the entire span from first-line to consolidation chemotherapy.
Abbreviations
| CG | Coarse-grained |
| MD | Molecular dynamics |
| GlcNAc | N-Acetyl glucosamine |
| GlcN | Glucosamine |
| Dox | Doxorubicin |
| Gem | Gemcitabine |
| Ac | Acetyl |
| But | Butanoyl |
| Hep | Heptanoyl |
| χ | Degree of chemical modification |
| MD | Molecular dynamics |
| GROMACS | GROningen MAchine for Chemical Simulations |
| RDF | Radial distribution function |
| MSD | Mean square displacement |
| D | Diffusion coefficient |
Conflicts of interest
No conflict of interest to declare.Acknowledgements
This work was funded in part by start-up funds provided by NC State University. A. G. and A. S. acknowledge support from the Deutsche Forschungs Gemeinschaft International Research Training group (IRTG 1524). SM and JDS kindly acknowledge support from the Department of Education Graduate Assistance in Areas of National Need (GAANN) in Molecular Biotechnology. CKH acknowledges support from the National Science Foundation, Grant number NSF-CBET-1743432. Open Access funding provided by the Max Planck Society.References
- E. S. Dragan and M. V. Dinu, Polysaccharides constructed hydrogels as vehicles for proteins and peptides. A review, Carbohydr. Polym., 2019, 225, 115210 CrossRef CAS.
- M. Mu, X. Li, A. Tong and G. Guo, Multi-functional chitosan-based smart hydrogels mediated biomedical application, Expert Opin. Drug Delivery, 2019, 16(3), 239–250 CrossRef CAS.
- M. C. G. Pellá, M. K. Lima-Tenório, E. T. Tenório-Neto, M. R. Guilherme, E. C. Muniz and A. F. Rubira, Chitosan-based hydrogels: From preparation to biomedical applications, Carbohydr. Polym., 2018, 196, 233–245 CrossRef.
- H. Zhu, W. Luo, P. N. Ciesielski, Z. Fang, J. Y. Zhu, G. Henriksson, M. E. Himmel and L. Hu, Wood-derived materials for green electronics, biological devices, and energy applications, Chem. Rev., 2016, 116(16), 9305–9374 CrossRef CAS.
- J. Li and D. J. Mooney, Designing hydrogels for controlled drug delivery, Nat. Rev. Mater., 2016, 1(12), 16071 CrossRef CAS.
- D. Archana, J. Dutta and P. K. Dutta, Evaluation of chitosan nano dressing for wound healing: Characterization, in vitro and in vivo studies, Int. J. Biol. Macromol., 2013, 57, 193–203 CrossRef CAS.
- S. W. Benner, V. T. John and C. K. Hall, Simulation study of hydrophobically modified chitosan as an oil dispersant additive, J. Phys. Chem. B, 2015, 119(23), 6979–6990 CrossRef CAS.
- A. Domard, pH and cd measurements on a fully deacetylated chitosan: application to CuII—polymer interactions, Int. J. Biol. Macromol., 1987, 9(2), 98–104 CrossRef CAS.
- C. Pillai, W. Paul and C. P. Sharma, Chitin and chitosan polymers: Chemistry, solubility and fiber formation, Prog. Polym. Sci., 2009, 34(7), 641–678 CrossRef CAS.
- N. Bhattarai, J. Gunn and M. Zhang, Chitosan-based hydrogels for controlled, localized drug delivery, Adv. Drug Delivery Rev., 2010, 62(1), 83–99 CrossRef CAS.
- L. Hu, Y. Sun and Y. Wu, Advances in chitosan-based drug delivery vehicles, Nanoscale, 2013, 5(8), 3103–3111 RSC.
- S. P. Campana-Filho and L. A. de Almeida Pinto, Chitosan based materials and its applications, Bentham Science Publishers, 2017, vol. 3 Search PubMed.
- N. Liu, J. Chen, J. Zhuang and P. Zhu, Fabrication of engineered nanoparticles on biological macromolecular (PEGylated chitosan) composite for bio-active hydrogel system in cardiac repair applications, Int. J. Biol. Macromol., 2018, 117, 553–558 CrossRef CAS.
- C. Yoshida, Y. Uchida, T. Ito, T. Takami and Y. Murakami, Chitosan Gel Sheet Containing Polymeric Micelles: Synthesis and Gelation Properties of PEG-Grafted Chitosan, Materials, 2017, 10(9), 1075 CrossRef.
- T. Bereau and M. Deserno, Enhanced Sampling of Coarse-Grained Transmembrane-Peptide Structure Formation from Hydrogen-Bond Replica Exchange, J. Membr. Biol., 2015, 248(3), 395–405 CrossRef CAS.
- S. J. Marrink and D. P. Tieleman, Perspective on the Martini model, Chem. Soc. Rev., 2013, 42(16), 6801–6822 RSC.
- S. J. Marrink, A. H. De Vries and A. E. Mark, Coarse grained model for semiquantitative lipid simulations, J. Phys. Chem. B, 2004, 108(2), 750–760 CrossRef CAS.
- M. Bathe, G. C. Rutledge, A. J. Grodzinsky and B. Tidor, A coarse-grained molecular model for glycosaminoglycans: application to chondroitin, chondroitin sulfate, and hyaluronic acid, Biophys. J., 2005, 88(6), 3870–3887 CrossRef CAS.
- K. Mazeau, S. Pérez and M. Rinaudo, Predicted influence of N-acetyl group content on the conformational extension of chitin and chitosan chains, J. Carbohydr. Chem., 2000, 19(9), 1269–1284 CrossRef CAS.
- L. Tsereteli and A. Grafmüller, An accurate coarse-grained model for chitosan polysaccharides in aqueous solution, PLoS One, 2017, 12(7), e0180938 CrossRef.
- A.-P. Hynninen, J. F. Matthews, G. T. Beckham, M. F. Crowley and M. R. Nimlos, Coarse-grain model for glucose, cellobiose, and cellotetraose in water, J. Chem. Theory Comput., 2011, 7(7), 2137–2150 CrossRef CAS.
- P. Liu, S. Izvekov and G. A. Voth, Multiscale coarse-graining of monosaccharides, J. Phys. Chem. B, 2007, 111(39), 11566–11575 CrossRef CAS.
- S. Y. Mashayak, M. N. Jochum, K. Koschke, N. R. Aluru, V. Rühle and C. Junghans, Relative Entropy and Optimization-Driven Coarse-Graining Methods in VOTCA, PLoS One, 2015, 10(7), e0131754 CrossRef CAS.
- V. Molinero and W. A. Goddard, M3B: A coarse grain force field for molecular simulations of malto-oligosaccharides and their water mixtures, J. Phys. Chem. B, 2004, 108(4), 1414–1427 CrossRef CAS.
- J. Sauter and A. Grafmüller, Procedure for Transferable Coarse-Grained Models of Aqueous Polysaccharides, J. Chem. Theory Comput., 2017, 13(1), 223–236 CrossRef CAS.
- J. Sauter and A. Grafmüller, Efficient Osmotic Pressure Calculations Using Coarse-Grained Molecular Simulations, J. Chem. Theory Comput., 2018, 14(3), 1171–1176 CrossRef CAS.
- E. F. Franca, R. D. Lins, L. C. G. Freitas and T. P. Straatsma, Characterization of chitin and chitosan molecular structure in aqueous solution, J. Chem. Theory Comput., 2008, 4(12), 2141–2149 CrossRef CAS.
- E. F. Franca, L. C. G. Freitas and R. D. Lins, Chitosan molecular structure as a function of N-acetylation, Biopolymers, 2011, 95(7), 448–460 CrossRef CAS.
- S. Skovstrup, S. G. Hansen, T. Skrydstrup and B. Schiøtt, Conformational Flexibility of Chitosan: A Molecular Modeling Study, Biomacromolecules, 2010, 11(11), 3196–3207 CrossRef CAS.
- C. H. Borca and C. A. Arango, Molecular Dynamics of a Water-Absorbent Nanoscale Material Based on Chitosan, J. Phys. Chem. B, 2016, 120(15), 3754–3764 CrossRef CAS.
- J. Cui, Z. Yu and D. Lau, Effect of Acetyl Group on Mechanical Properties of Chitin/Chitosan Nanocrystal: A Molecular Dynamics Study, Int. J. Mol. Sci., 2016, 17(1), 61 CrossRef.
- R. R. Faria, R. F. Guerra, L. R. de Sousa Neto, L. F. Motta and E. d. F. Franca, Computational study of polymorphic structures of α- and β-chitin and chitosan in aqueous solution, J. Mol. Graphics Modell., 2016, 63, 78–84 CrossRef CAS.
- S. W. Benner and C. K. Hall, Development of a coarse-grained model of chitosan for predicting solution behavior, J. Phys. Chem. B, 2016, 120(29), 7253–7264 CrossRef CAS.
- S. Izvekov and G. A. Voth, A multiscale coarse-graining method for biomolecular systems, J. Phys. Chem. B, 2005, 109(7), 2469–2473 CrossRef CAS.
- D. Reith, M. Pütz and F. Müller-Plathe, Deriving effective mesoscale potentials from atomistic simulations, J. Comput. Chem., 2003, 24(13), 1624–1636 CAS.
- D. Case, T. Darden, T. Cheatham, C. Simmerling, J. Wang, R. Duke, R. Luo, M. Crowley, R. Walker and W. Zhang, AMBER 12, University of California, San Francisco, 2012 Search PubMed.
- E. J. Sorin and V. S. Pande, Exploring the helix-coil transition via all-atom equilibrium ensemble simulations, Biophys. J., 2005, 88(4), 2472–2493 CAS.
- M. Wehle, I. Vilotijevic, R. Lipowsky, P. H. Seeberger, D. Varon Silva and M. Santer, Mechanical compressibility of the glycosylphosphatidylinositol (GPI) anchor backbone governed by independent glycosidic linkages, J. Am. Chem. Soc., 2012, 134(46), 18964–18972 CrossRef CAS.
- S. Pronk, S. Páll, R. Schulz, P. Larsson, P. Bjelkmar, R. Apostolov, M. R. Shirts, J. C. Smith, P. M. Kasson and D. Van Der Spoel, et al., GROMACS 4.5: a high-throughput and highly parallel open source molecular simulation toolkit, Bioinformatics, 2013, 29(7), 845–854 CrossRef CAS.
- A. K. Malde, L. Zuo, M. Breeze, M. Stroet, D. Poger, P. C. Nair, C. Oostenbrink and A. E. Mark, An Automated Force Field Topology Builder (ATB) and Repository: Version 1.0, J. Chem. Theory Comput., 2011, 7(12), 4026–4037 CrossRef CAS.
- M. J. Abraham, D. van der Spoel, E. Lindahl and B. Hess, GROMACS User Manual, version 5.1.2.
- K. N. Kirschner, A. B. Yongye, S. M. Tschampel, J. González-Outeiriño, C. R. Daniels, B. L. Foley and R. J. Woods, GLYCAM06: a generalizable biomolecular force field. Carbohydrates, J. Comput. Chem., 2008, 29(4), 622–655 CrossRef CAS.
- J. Sauter and A. Grafmüller, Predicting the Chemical Potential and Osmotic Pressure of Polysaccharide Solutions by Molecular Simulations, J. Chem. Theory Comput., 2016, 12(9), 4375–4384 CrossRef CAS.
- M. Lısal, J. Kolafa and I. Nezbeda, An examination of the five-site potential (TIP5P) for water, J. Chem. Phys., 2002, 117(19), 8892–8897 CrossRef.
- J. Wang, R. M. Wolf, J. W. Caldwell, P. A. Kollman and D. A. Case, Development and testing of a general amber force field, J. Comput. Chem., 2004, 25(9), 1157–1174 CrossRef CAS.
- C. I. Bayly, P. Cieplak, W. Cornell and P. A. Kollman, A well-behaved electrostatic potential based method using charge restraints for deriving atomic charges: the RESP model, J. Phys. Chem., 1993, 97(40), 10269–10280 CrossRef CAS.
- T. Darden, D. York and L. Pedersen, Particle mesh Ewald: An N·log (N) method for Ewald sums in large systems, J. Chem. Phys., 1993, 98(12), 10089–10092 CrossRef CAS.
- B. Hess, H. Bekker, H. J. C. Berendsen and J. G. E. M. Fraaije, LINCS: a linear constraint solver for molecular simulations, J. Comput. Chem., 1997, 18(12), 1463–1472 CrossRef CAS.
- S. Miyamoto and P. A. Kollman, Settle: An analytical version of the SHAKE and RATTLE algorithm for rigid water models, J. Comput. Chem., 1992, 13(8), 952–962 CrossRef CAS.
- S. Nosé, A unified formulation of the constant temperature molecular dynamics methods, J. Chem. Phys., 1984, 81(1), 511–519 Search PubMed.
- W. G. Hoover, Canonical dynamics: Equilibrium phase-space distributions, Phys. Rev. A: At., Mol., Opt. Phys., 1985, 31(3), 1695 CrossRef.
- M. Parrinello and A. Rahman, Polymorphic transitions in single crystals: A new molecular dynamics method, J. Appl. Phys., 1981, 52(12), 7182–7190 CrossRef CAS.
- I. G. Tironi, R. Sperb, P. E. Smith and W. F. van Gunsteren, A generalized reaction field method for molecular dynamics simulations, J. Chem. Phys., 1995, 102(13), 5451–5459 CrossRef CAS.
- S. Bhattacharya and K. E. Gubbins, Fast method for computing pore size distributions of model materials, Langmuir, 2006, 22(18), 7726–7731 CrossRef CAS.
- F. Kappel and A. V. Kuntsevich, An implementation of Shor's r-algorithm, Comput. Optim. Appl., 2000, 15(2), 193–205 CrossRef.
- J. D. Schneible, A. Singhal, R. L. Lilova, C. K. Hall, A. Grafmuller and S. Menegatti, Tailoring the Chemical Modification of Chitosan Hydrogels to Fine-Tune the Release of a Synergistic Combination of Chemotherapeutics, Biomacromolecules, 2019, 20(8), 3126–3141 CrossRef CAS.
- Y. Fu and W. J. Kao, Drug release kinetics and transport mechanisms of non-degradable and degradable polymeric delivery systems, Expert Opin. Drug Delivery, 2010, 7(4), 429–444 CrossRef CAS.
- M. Rinaudo, M. Milas and P. Le Dung, Characterization of chitosan. Influence of ionic strength and degree of acetylation on chain expansion, Int. J. Biol. Macromol., 1993, 15(5), 281–285 CrossRef CAS.
- O. Philippova and E. Korchagina, Chitosan and its hydrophobic derivatives: Preparation and aggregation in dilute aqueous solutions, Polym. Sci., Ser. A, 2012, 54(7), 552–572 CAS.
- M. Terbojevich, A. Cosani, G. Conio, E. Marsano and E. Bianchi, Chitosan: chain rigidity and mesophase formation, Carbohydr. Res., 1991, 209, 251–260 CAS.
- S. Ercelen, X. Zhang, G. Duportail, C. Grandfils, J. Desbrières, S. Karaeva, V. Tikhonov, Y. Mély and V. Babak, Physicochemical properties of low molecular weight alkylated chitosans: A new class of potential nonviral vectors for gene delivery, Colloids Surf., B, 2006, 51(2), 140–148 CrossRef CAS.
- C. Esquenet, P. Terech, F. Boué and E. Buhler, Structural and rheological properties of hydrophobically modified polysaccharide associative networks, Langmuir, 2004, 20(9), 3583–3592 CrossRef CAS.
- Y. Yu, T. Tyrikos-Ergas, Y. Zhu, G. Fittolani, V. Bordoni, A. Singhal, R. J. Fair, A. Grafmüller, P. H. Seeberger and M. Delbianco, Systematic Hydrogen-Bond Manipulations To Establish Polysaccharide Structure–Property Correlations, Angew. Chem., Int. Ed., 2019, 58(37), 13127–13132 CrossRef CAS.
- Y. Zhu, T. Tyrikos-Ergas, K. Schiefelbein, A. Grafmüller, P. H. Seeberger and M. Delbianco, Automated access to well-defined ionic oligosaccharides, Org. Biomol. Chem., 2020, 18(7), 1349–1353 RSC.
- G.-B. Jiang, D. Quan, K. Liao and H. Wang, Preparation of polymeric micelles based on chitosan bearing a small amount of highly hydrophobic groups, Carbohydr. Polym., 2006, 66(4), 514–520 CrossRef CAS.
- O. Ortona, G. D’Errico, G. Mangiapia and D. Ciccarelli, The aggregative behavior of hydrophobically modified chitosans with high substitution degree in aqueous solution., Carbohydr. Polym., 2008, 74(1), 16–22 CrossRef CAS.
- M. Rinaudo, R. Auzely, C. Vallin and I. Mullagaliev, Specific interactions in modified chitosan systems, Biomacromolecules, 2005, 6(5), 2396–2407 CrossRef CAS.
- R. Gurarslan, S. Hardrict, D. Roy, C. Galvin, M. R. Hill, H. Gracz, B. S. Sumerlin, J. Genzer and A. Tonelli, Beyond microstructures: Using the Kerr Effect to characterize the macrostructures of synthetic polymers, J. Polym. Sci., Part B: Polym. Phys., 2015, 53(3), 155–166 CrossRef CAS.
- J. Han, B. H. Jeon, C. Y. Ryu, J. J. Semler, Y. K. Jhon and J. Genzer, Discriminating Among Co-monomer Sequence Distributions in Random Copolymers Using Interaction Chromatography, Macromol. Rapid Commun., 2009, 30(18), 1543–1548 CrossRef CAS.
- Y. K. Jhon, J. J. Semler and J. Genzer, Effect of solvent quality and chain confinement on the kinetics of polystyrene bromination, Macromolecules, 2008, 41(18), 6719–6727 CrossRef CAS.
- Y. K. Jhon, J. J. Semler, J. Genzer, M. Beevers, O. A. Gus’kova, P. G. Khalatur and A. R. Khokhlov, Effect of comonomer sequence distribution on the adsorption of random copolymers onto impenetrable flat surfaces, Macromolecules, 2009, 42(7), 2843–2853 CrossRef CAS.
- J. J. Semler, Y. K. Jhon, A. Tonelli, M. Beevers, R. Krishnamoorti and J. Genzer, Facile method of controlling monomer sequence distributions in random copolymers, Adv. Mater., 2007, 19(19), 2877–2883 CrossRef CAS.
- L. A. Strickland, C. K. Hall and J. Genzer, Design of copolymers with tunable randomness using discontinuous molecular dynamics simulation, Macromolecules, 2009, 42(22), 9063–9071 CrossRef CAS.
- S.-i. Aiba, Studies on chitosan: 3. Evidence for the presence of random and block copolymer structures in partially N-acetylated chitosans, Int. J. Biol. Macromol., 1991, 13(1), 40–44 CrossRef CAS.
- K. Kurita, Evidence for formation of block and random copolymers of N-acetyl-D-glucosamine and D-glucosamine by hetero-and homogeneous hydrolyses, Makromol. Chem., 1977, 178, 3197–3202 CrossRef CAS.
- M. H. Ottey, K. M. Vårum and O. Smidsrød, Compositional heterogeneity of heterogeneously deacetylated chitosans, Carbohydr. Polym., 1996, 29(1), 17–24 CrossRef.
- K. Okuyama, K. Noguchi, M. Kanenari, T. Egawa, K. Osawa and K. Ogawa, Structural diversity of chitosan and its complexes, Carbohydr. Polym., 2000, 41(3), 237–247 CrossRef CAS.
- J. Berger, M. Reist, J. M. Mayer, O. Felt, N. A. Peppas and R. Gurny, Structure and interactions in covalently and ionically crosslinked chitosan hydrogels for biomedical applications, Eur. J. Pharm. Biopharm., 2004, 57(1), 19–34 CrossRef CAS.
- G. T. Beckham and M. F. Crowley, Examination of the α-chitin structure and decrystallization thermodynamics at the nanoscale, J. Phys. Chem. B, 2011, 115(15), 4516–4522 CAS.
- P. Sikorski, R. Hori and M. Wada, Revisit of α-Chitin Crystal Structure Using High Resolution X-ray Diffraction Data, Biomacromolecules, 2009, 10(5), 1100–1105 CrossRef CAS.
- Y. Nishiyama, Y. Noishiki and M. Wada, X-ray Structure of Anhydrous β-Chitin at 1 Å Resolution, Macromolecules, 2011, 44(4), 950–957 CrossRef CAS.
- A. Pavinatto, A. Fiamingo, A. Bukzem, D. Silva, D. Santos, T. Senra, W. Facchinatto and S. Campana Filho, Chemically modified chitosan derivatives, Frontiers in Biomaterials: Chitosan Based Materials and its Applications, 2017, vol. 3, pp. 107–132 Search PubMed.
- M. W. Mahoney and W. L. Jorgensen, Diffusion constant of the TIP5P model of liquid water, J. Chem. Phys., 2001, 114(1), 363–366 CrossRef CAS.
- R. A. Robinson and R. H. Stokes, Electrolyte solutions, Courier Corporation, 2002 Search PubMed.
- M. Biondi, S. Fusco, A. L. Lewis and P. A. Netti, New Insights into the Mechanisms of the Interactions Between Doxorubicin and the Ion-Exchange Hydrogel DC Bead™ for Use in Transarterial Chemoembolization (TACE), J. Biomater. Sci., Polym. Ed., 2012, 23(1–4), 333–354 CrossRef CAS.
- S. Eikenberry, A tumor cord model for doxorubicin delivery and dose optimization in solid tumors, Theor. Biol. Med. Modell., 2009, 6, 16 CrossRef.
- V. Ruhle, C. Junghans, A. Lukyanov, K. Kremer and D. Andrienko, Versatile object-oriented toolkit for coarse-graining applications, J. Chem. Theory Comput., 2009, 5(12), 3211–3223 CrossRef.
Footnote |
| † Electronic supplementary information (ESI) available. See DOI: 10.1039/d0sm01243b |
| This journal is © The Royal Society of Chemistry 2020 |

