 Open Access Article
Pulsed electric fields induce modulation of protein liquid–liquid phase separation†
Mengying
Wang
 a,
Sven
Falke
a,
Robin
Schubert
a,
Sven
Falke
a,
Robin
Schubert
 b,
Kristina
Lorenzen
b,
Qing-di
Cheng
a,
Christian
Exner
b,
Kristina
Lorenzen
b,
Qing-di
Cheng
a,
Christian
Exner
 a,
Hévila
Brognaro
a,
Célestin Nzanzu
Mudogo
a,
Hévila
Brognaro
a,
Célestin Nzanzu
Mudogo
 c and
Christian
Betzel
*a
aInstitute of Biochemistry and Molecular Biology, Laboratory for Structural Biology of Infection and Inflammation, c/o DESY, Build. 22a, Notkestr. 85, 22607, Hamburg, Germany. E-mail: Christian.Betzel@uni-hamburg.de
bEuropean XFEL GmbH, Holzkoppel 4, 22869 Schenefeld, Germany
cDepartment of Basic Sciences, School of Medicine, University of Kinshasa, Kinshasa, Democratic Republic of Congo
First published on 3rd September 2020
Abstract
The time-resolved dynamic assembly and the structures of protein liquid dense clusters (LDCs) were analyzed under pulsed electric fields (EFs) applying complementary polarized and depolarized dynamic light scattering (DLS/DDLS), optical microscopy, and transmission electron microscopy (TEM). We discovered that pulsed EFs substantially affected overall morphologies and spatial distributions of protein LDCs and microcrystals, and affected the phase diagrams of LDC formation, including enabling protein solutions to overcome the diffusive flux energy barrier to phase separate. Data obtained from DLS/DDLS and TEM showed that LDCs appeared as precursors of protein crystal nuclei, followed by the formation of ordered structures within LDCs applying a pulsed EF. Experimental results of circular dichroism spectroscopy provided evidence that the protein secondary structure content is changing under EFs, which may consequently modulate protein–protein interactions, and the morphology, dimensions, and internal structure of LDCs. Data and results obtained unveil options to modulate the phase diagram of crystallization, and physical morphologies of protein LDCs and microcrystals by irradiating sample suspensions with pulsed EFs.
Introduction
Today it is widely established that liquid–liquid phase separation (LLPS) is involved in biomineralization,1 nucleation of ice crystals,2 the origin of life,3 and protein crystal nuclei formation.4 However, LLPS of proteins and particularly RNAs in cells gained substantial attention in recent years, as it was found that LLPS is the driving mechanism for the formation of membrane-less organelles, such as nucleoli, centrosomes, stress granules, Cajal bodies, P bodies and others.5,6 Further, LLPS is seen as the fundamental process within the formation of in vivo grown crystals and amyloid formation,7 the pathological basis for several diseases. Examples are cytoplasmic phase separation in the formation of cataract, Charcot–Leyden crystals in allergic diseases, crystallization of hemoglobin C in hemolytic anemia, ragged-red fibers in mitochondrial myopathies and hematin crystals in malaria.8–14Macromolecules forming LDCs in biological systems are proteins and nucleic acids, which are heterogeneously charged, with highly individual electrostatic surface potential distributions, distinct dipole moments and three-dimensional structures.15 RNA, DNA molecules and the polypeptide chains of proteins are at least partly polar, thereby form ionic, ion–π and π–π interactions, which stabilize their 2D and 3D structures and facilitate intermolecular interactions, supporting the formation of stable liquid dense clusters (LDCs).16 Research efforts to understand the LLPS in biological systems have mainly focussed on identifying the role of LLPS in stress-related and pathologically relevant processes.17,18 Biophysical investigations focussed on exploring the determining factors of protein LLPS, such as specific amino acid sequences, distinct protein secondary structures, pH, temperature and external forces.17,19–24 However, due to the individual structural complexity of biomacromolecules, knowledge about (I) physio-chemical parameters that influence LLPS, and (II) methods to modify biomacromolecular LDCs via external forces, e.g. magnetic fields and electric fields,25–28 is still rather incomplete. Conversely, for homopolymers and nanocomposites the mechanisms of LLPS formation have already been well investigated.29–36 In this context, external force fields, especially electric fields (EFs), controlling motion and phase separation of nanoparticles were applied to obtain and prepare nanomaterials with specific structures and functions, e.g. carbon nanotubes, nanowires and conducting polymers.37,38
Experiments analyzing the effect of EFs on biological systems and biomolecular suspensions focused till now predominantly on investigating the impact of EFs on protein crystallization,25,26,39,40 protein dynamics,41 protein conformation/structure,42–47 and cellular morphologies.48 Experimental efforts to understand the influence of EFs on the formation of protein LDCs have only rarely been performed. Hence, applying EFs during protein LDCs formation will provide insights into opportunities to modulate protein LDCs by EFs. Therefore, we applied polarized and depolarized dynamic light scattering, optical and transmission electron microscopy and circular dichroism spectroscopy to analyze the dynamics of the LDCs assembling process, the internal structure and order of protein LDCs, as well as the secondary structure content of proteins exposed to EFs.
Results and discussion
Monitoring protein LLPS applying optical microscopy
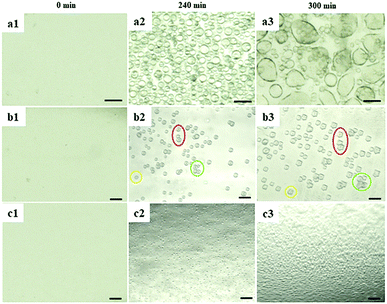
To investigate the influence of EFs on protein LLPS, a platinum wire (Pt) and a parallel conductive glass (PCG) EF experimental setup were used to expose suspensions of glucose isomerase (GI), ovalbumin, bovine pancreatic trypsin inhibitor (BPTI), and β-lactoglobulin solutions to five different pulsed waveforms (ESI,† Fig. S1), which were applied for the first time by A. Rodríguez-Romero et al.40 to investigate effects of alternating electric fields on crystal growth. The proteins were selected according to their distinct chemical and biophysical parameters summarized in ESI,† Table S1. Experimental materials, procedures and methods applied are also summarized in the ESI.†In Fig. 1 GI LDCs and microcrystals obtained after 5 hours applying the Pt EF setup (Fig. 1a and b), PCG EF setup (Fig. 1c and d) and no EF (control), respectively. Overall negatively charged GI at pH 6.5 formed LDCs with dimensions of 1–5 μm around the anode when Pt EF waveforms 1–3 were applied (wave 1–3 of Fig. 1a and b). Rectangular crystals were observed at the boundary of LDCs (wave 3 in Fig. 1b). Pt EF waveforms 4 and 5 induced the formation of LDCs with a uniform diameter of approx. 2 μm equally distributed in the entire droplet (wave 4–5 in Fig. 1a and b). In Fig. 1c and d, PCG EFs between two parallel conductive glasses guided GI to form homogeneously shaped LDCs with approx. dimensions of 25 μm under each pulsed waveform. Microcrystals occurred after a phase transition of LDCs applying waveforms 1–5 (waves 1–4 as shown in Fig. 1c and waves 2 and 5 as shown in Fig. 1d). A representative evolving process of GI LDCs formed under different EF conditions is shown in Fig. 2. In the control group (Fig. 2a1–a3), GI LDCs evidently showed Ostwald ripening49 and resulting clusters have different dimensions and shapes. Interestingly, GI LDCs formed within the PCG EF setup (Fig. 2b1–b3) and Pt EF setup (Fig. 2c1–c3) did not coalesce with neighboring LDCs, probably due to electrostatic repulsion between LDCs under an EF. Instead, a transition from LDCs with high protein concentration to microcrystals with geometrically ordered structure in both EF setups was observed, respectively. Based on these results, it is concluded that GI LDCs and microcrystals formed with the PCG EF setup had larger dimensions and uniform spatial orientation, which may attribute to the parallel EF lines between two parallel conductive glass plates (ESI,† Fig. S1b-EF lines). Nevertheless, the Pt EF setup, particularly when applying waveforms 4 and 5, demonstrated advantages to facilitate the formation of GI LDCs and microcrystals with similar dimensions and similar morphology.
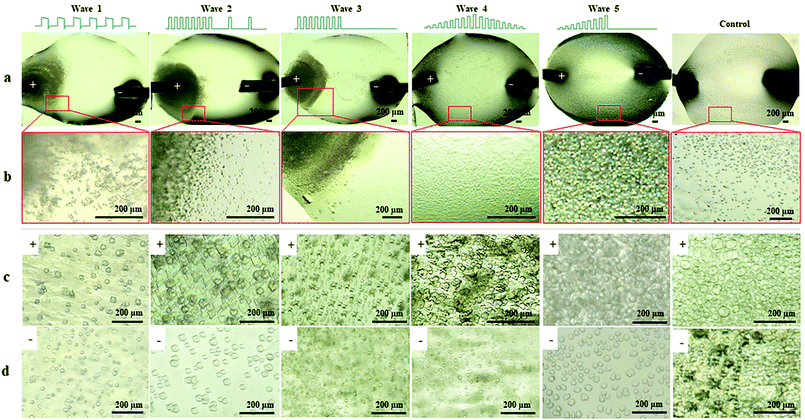 | ||
| Fig. 1 GI LDCs and microcrystals formed with EFs and without EFs (control), respectively. (a) GI droplets under different Pt EF waveforms. (b) Magnified views of corresponding droplet areas indicated in Fig. 1a by red squares. GI LDCs and microcrystals formed (c) at the anode side and (d) at the cathode side in the PCG EF setup with different waveforms. | ||
Images showing effects of pulsed EFs on the LDCs formation for the other three proteins (BPTI, ovalbumin, and β-lactoglobulin) were also recorded (ESI,† Fig. S3–S5). Different to GI, no quasi-crystals or microcrystals, only morphological changes of LDCs were observed for the other three proteins under EFs. The LDCs formation of BPTI under the selected condition is temperature dependent.50 No supersaturation or LLPS was observed after mixing BPTI with KSCN at 20 °C when an EF was absent. However, BPTI LDCs appeared in the same condition after 1 hour under Pt EFs (ESI,† Fig. S4), which obviously indicated that the pulsed EF supported the formation of attractive forces in the BPTI solution and thereby supported phase transition. In contrast, it was also observed that LLPS of ovalbumin was impeded by applying pulsed EFs with waveforms 1, 2 and 4 (ESI,† Fig. S3). The inhibited LLPS process of ovalbumin was irreversible when applying the Pt EF setup with waveform 2, which was probably caused by the high frequency and amplitude of waveform 2. For β-lactoglobulin, LDCs nearby the cathode were smaller and more uniform than those nearby the anode due to the negative protein net charge. Compared to the results obtained by using GI, no obvious differences of LDCs morphology and geometrically ordered structures were observed with these three proteins exposed to different pulsed EFs. Hence, GI was identified to be a beneficial model protein to analyze the effects of pulsed EFs on protein phase transition in more detail and structural properties of LDCs, as described in the following sections.
Polarized and depolarized dynamic light scattering (DLS/DDLS)
DLS/DDLS was utilized to analyze whether pulsed EFs influence the dynamic assembly and internal structure of protein LDCs at the early stage of LDCs formation. Based on the birefringence of material with lattice order exposed to laser light DDLS can distinguish ordered and amorphous material.51–53 Due to a spatial limitation of the DDLS cuvette, Pt wire electrodes were assembled at the DDLS cuvette to produce a pulsed EF with waveform 4 (Vmax-500![[thin space (1/6-em)]](https://www.rsc.org/images/entities/char_2009.gif) Ω = 20 V) during DLS/DDLS measurements (ESI,† Fig. S2). PEG20
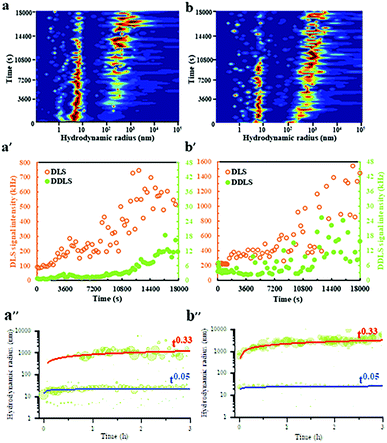
Ω = 20 V) during DLS/DDLS measurements (ESI,† Fig. S2). PEG20![[thin space (1/6-em)]](https://www.rsc.org/images/entities/char_2009.gif) 000 was added at the beginning of the measurement to induce supersaturation of the GI solution. In the control group, without application of a pulsed EF, a particle fraction with a large hydrodynamic radius of approx. 300 nm appeared after 3600 s measurement (Fig. 3a) accompanied by an obvious increase of DLS signal intensity (Fig. 3a′), indicating an initial formation of GI LDCs. An increase of the corresponding DDLS signal intensity was only detected after 12
000 was added at the beginning of the measurement to induce supersaturation of the GI solution. In the control group, without application of a pulsed EF, a particle fraction with a large hydrodynamic radius of approx. 300 nm appeared after 3600 s measurement (Fig. 3a) accompanied by an obvious increase of DLS signal intensity (Fig. 3a′), indicating an initial formation of GI LDCs. An increase of the corresponding DDLS signal intensity was only detected after 12![[thin space (1/6-em)]](https://www.rsc.org/images/entities/char_2009.gif) 600 s along with the growth of GI LDCs in size (Fig. 3a′), demonstrating the initiation of nuclei formation with lattice order. The contribution of multiple scattering to the DDLS signal intensity can be neglected when the DLS signal intensity of measurements is lower than 5000 kHz.51 Hence, this result revealed a nucleation process with two steps, as proposed by P. Vekilov and others, i.e. the crystal nucleus occurs within an LDC.54 Nevertheless, when a pulsed EF with waveform 4 was applied during the whole measurement, the fraction with hydrodynamic radii of approx. 300 nm appeared rapidly at the beginning of the measurement and grew steadily to a larger population with radii of 1–5 μm (Fig. 3b). In parallel, a noticeable fluctuation of the DDLS signal intensity was detected after a short time increase of DLS signal intensity (Fig. 3b′), indicating an initial formation of ordered structures at the early stages of LDCs formation. The dynamic scaling law, which supposes the evolution of the droplet size distribution over time (R = ktn) predicates a power law dependence on time (n) and a prefactor (k), supports the identification of specific growth/coarsening mechanisms involved in the cluster formation.55 The kinetic evolution of hydrodynamic radii over 3 hours without (Fig. 3a′′) and with application of EF (Fig. 3b′′) was plotted and shows an obvious power law coefficient (t0.33), which represents the diffusion-limited growth in supersaturated solutions.56 Thereby, we assume that (I) pulsed EFs can support protein solutions overcoming the diffusion limitation to form LDCs, and (II) pulsed EFs can accelerate the transition process from a liquid dense phase to an ordered phase.
600 s along with the growth of GI LDCs in size (Fig. 3a′), demonstrating the initiation of nuclei formation with lattice order. The contribution of multiple scattering to the DDLS signal intensity can be neglected when the DLS signal intensity of measurements is lower than 5000 kHz.51 Hence, this result revealed a nucleation process with two steps, as proposed by P. Vekilov and others, i.e. the crystal nucleus occurs within an LDC.54 Nevertheless, when a pulsed EF with waveform 4 was applied during the whole measurement, the fraction with hydrodynamic radii of approx. 300 nm appeared rapidly at the beginning of the measurement and grew steadily to a larger population with radii of 1–5 μm (Fig. 3b). In parallel, a noticeable fluctuation of the DDLS signal intensity was detected after a short time increase of DLS signal intensity (Fig. 3b′), indicating an initial formation of ordered structures at the early stages of LDCs formation. The dynamic scaling law, which supposes the evolution of the droplet size distribution over time (R = ktn) predicates a power law dependence on time (n) and a prefactor (k), supports the identification of specific growth/coarsening mechanisms involved in the cluster formation.55 The kinetic evolution of hydrodynamic radii over 3 hours without (Fig. 3a′′) and with application of EF (Fig. 3b′′) was plotted and shows an obvious power law coefficient (t0.33), which represents the diffusion-limited growth in supersaturated solutions.56 Thereby, we assume that (I) pulsed EFs can support protein solutions overcoming the diffusion limitation to form LDCs, and (II) pulsed EFs can accelerate the transition process from a liquid dense phase to an ordered phase.
Transmission electron microscopy (TEM)
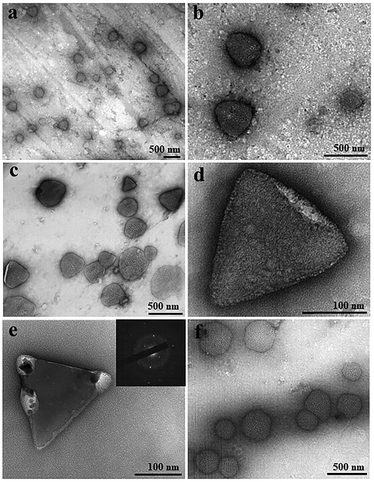
TEM was applied to visualize and compare GI LDCs obtained with and without a pulsed EF at the nanoscale. A pulsed EF with waveform 4 (Vmax-500![[thin space (1/6-em)]](https://www.rsc.org/images/entities/char_2009.gif) Ω = 20 V) was applied to GI solution during the whole process of sample preparation for a total of 5 hours. Images in Fig. 4a–c show GI LDCs formed in the presence of the pulsed EF, with a uniformly triangular shape and size around 300–400 nm. Two kinds of nuclei according to the appearance were identified. However, one of them showed relatively gentle corners and curved edges surrounded by amorphous protein molecules (Fig. 4d), indicating a primary stage of nucleation. Another nucleus, presumably in an advanced nucleation stage with sharp faceted corners and straight edges, forming a perfect rigid and rather triangular structure is shown in Fig. 4e. Furthermore, an obvious electron diffraction pattern was observed (inset of Fig. 4e), confirming the initial 3D structure of a matured nucleus. LDCs in the control group (Fig. 4f), without application of an EF show amorphous shape and random size distribution. Additionally, no nucleus or nucleus-like shape was observed in the control group. It is notable that only LDCs or nuclei with size under 500 nm were fixed on the grids and observed by TEM. According to results of the DDLS signal intensity (kHz), ordered structures occurred only after LDCs grew to a micro meter size in the absence of an EF, however, berifringence was detected at the early stages of LDCs formation under EFs. This may explane why no nuclei or ordered phases were observed by TEM in the control group. Thereby, results of TEM experiments are in good agreement with the DDLS results obtained.
Ω = 20 V) was applied to GI solution during the whole process of sample preparation for a total of 5 hours. Images in Fig. 4a–c show GI LDCs formed in the presence of the pulsed EF, with a uniformly triangular shape and size around 300–400 nm. Two kinds of nuclei according to the appearance were identified. However, one of them showed relatively gentle corners and curved edges surrounded by amorphous protein molecules (Fig. 4d), indicating a primary stage of nucleation. Another nucleus, presumably in an advanced nucleation stage with sharp faceted corners and straight edges, forming a perfect rigid and rather triangular structure is shown in Fig. 4e. Furthermore, an obvious electron diffraction pattern was observed (inset of Fig. 4e), confirming the initial 3D structure of a matured nucleus. LDCs in the control group (Fig. 4f), without application of an EF show amorphous shape and random size distribution. Additionally, no nucleus or nucleus-like shape was observed in the control group. It is notable that only LDCs or nuclei with size under 500 nm were fixed on the grids and observed by TEM. According to results of the DDLS signal intensity (kHz), ordered structures occurred only after LDCs grew to a micro meter size in the absence of an EF, however, berifringence was detected at the early stages of LDCs formation under EFs. This may explane why no nuclei or ordered phases were observed by TEM in the control group. Thereby, results of TEM experiments are in good agreement with the DDLS results obtained.
The role of net charge and dipole moment during the influence of EFs on protein LLPS
According to the results summarized before, questions of why different proteins showed different responses to pulsed EFs and why different pulsed waveforms induced different protein phase behaviors were investigated considering three factors: dipole moment, surface net charge and secondary structure composition of the proteins.As shown in ESI,† Fig. S6, it is known that molecules with an overall net charge in solution move to the oppositely charged electrode when exposed to an EF. However, proteins also possess an intrinsic electric dipole moment based on the spatial position and orientation of charged amino acids, and the orientation of secondary structure elements, particularly of α-helices. It was reported that EFs show more influences on proteins with higher dipole moments than on proteins with lower dipole moments.42 The resulting dipole moment is defined as:
Based on this correlation, we investigated the influence of EFs on the phase behaviors of proteins with different electric dipole moments. Results obtained are shown in ESI,† Fig. S7. During the experiments, negatively charged GI particles, with a dipole moment of 1082 D (1 D = 1 × 10⁻¹⁸ statC cm), moved to the anode and formed LDCs within 15 minutes after applying the EF. BPTI and β-lactoglobulin, with relatively low dipole moment compared to GI, formed LDCs around the electrode much slower. However, hemoglobin, with the lowest dipole moment of 201 D, indicated no mobility within the droplet exposed to an EF (ESI,† Fig. S7d). These results indicated a critical role of the protein dipole moment in the individual response of proteins towards EFs. In this context the dipole moment can be considered to be a key parameter to estimate whether EFs may influence the phase behavior of a distinct protein.
Secondary structure analysis
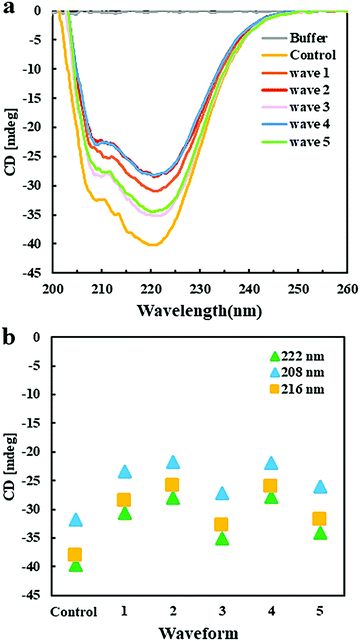
Circular dichroism spectroscopy was applied to analyze the effect of EFs on the secondary structure of GI. CD spectra in the far UV region, specifically 190–260 nm, probe the secondary structure composition of proteins. Fig. 5a shows the far UV CD spectra of GI treated with different pulsed waveforms with the Pt EF setup. The negative ellipticities at 222 nm and 208 nm correspond to α-helical structure and negative ellipticity at 216 nm is indicative for β-sheet structure. Compared to the GI spectra in the control group, without application of an EF, the decreased content of α-helices and β-sheets was mainly promoted by waveforms 1, 2, and 4 (Fig. 5b), while waveforms 3 and 5 introduced less changes in the spectra and the secondary structure of GI (Fig. 5a). This was probably caused by the high frequencies of waveforms 1, 2 and 4. Moreover, they contain pulses in the second half period of the waves, which were not present in waveforms 3 and 5 (ESI,† Fig. S1c). The CD spectroscopy assays supported to understand results obtained by optical microscopy showing that EFs with different waveforms can induce morphologically different GI LDCs. It also assisted to explain a behavior observed for ovalbumin that indeed did not form LDCs when applying waveforms 2, 4, and 1 using the Pt wire setup (ESI,† Fig. S3a). Further, CD spectroscopy results indicated that minor changes of the secondary structure composition are closely related to phase behavior and LDCs formation of protein.Perspectives
Future experiments analyzing time resolved processes of LLPS and LDCs under EFs applying particular time-resolved small angle X-ray scattering (SAXS) are planned to obtain time-resolved structural information and further insights about the process.Conclusions
Applying complementary optical microscopy, TEM, DLS/DDLS and CD spectroscopy, our investigations revealed distinct and innovative ways to modulate the morphology of protein LDCs and microcrystal growth by tuning or selecting distinct pulsed EFs. Five proteins were selected and different pulsed EF waveforms were applied for the experiments described. In summary, (I) pulsed EFs can change the dynamic process of protein phase separation. For example, the phase separation experiments with BPTI strongly indicate that EFs modulate the phase diagram and support BPTI to overcome the energy barrier to undergo phase separation. (II) Diverse morphological properties, i.e. shape, size and spatial distribution of protein LDCs and microcrystals can be obtained by tuning the frequency and amplitude of pulsed EFs. Phase-separated condensates in biological systems very often have crucial and distinct functions, as known for example for membrane-less organelles and more solid protein aggregates in neurodegenerative diseases. In this context the formation of LLPS or prevention of LLPS formation can be influenced by EFs, opening opportunities for applications of EFs in material sciences and treatment of LLPS related diseases. Particularly waveform 4 produced with the Pt EF setup supports the emergence and formation of homogeneous microcrystal suspensions, which are required for serial femtosecond X-ray crystallography diffraction data collection approaches. Waveforms 1–3 with the Pt EF setup induces a protein concentration gradient which can be used to control the crystal nucleation rate and thereby the number and dimensions of crystals to be obtained. Further, results achieved from DLS/DDLS and TEM experiments confirm a two-step crystal nucleation mechanism and demonstrate that pulsed EFs can introduce or accelerate the formation of ordered structures within LDCs. Finally, CD spectroscopy results provided evidence that the overall secondary structure content of proteins changes under pulsed EFs, which may in consequence affect protein–protein interactions and therefore the morphology and internal structure and order of LDCs.Conflicts of interest
There are no conflicts to declare.Acknowledgements
The authors acknowledge financial support by the Cluster of Excellence ‘Advanced Imaging of Matter’ of the Deutsche Forschungsgemeinschaft (DFG) – EXC 2056 – project ID 390715994, by the Helmholtz Excellence Network ‘Structure, Dynamics and Control on the Atomic Scale’, BMBF via projects 50WB1422 and 05K16GUA, by the Joachim-Herz-Stiftung Hamburg via the project Infecto-Physics, by the DFG – project ID BE1443/29-1, and by the China Scholarship Council – project ID [2020]71. Further, the authors acknowledge the use of the XBI biological sample preparation laboratory at European XFEL GmbH, enabled by the XBI User Consortium and would like to thank Cornelia Cazey (CSSB, Hamburg) for support in negative staining assay.Notes and references
- J. T. Avaro, S. L. P. Wolf, K. Hauser and D. Gebauer, Angew. Chem., Int. Ed., 2020, 59, 6155–6159 CrossRef CAS.
- T. F. Whale, M. A. Holden, A. N. Kulak, Y. Y. Kim, F. C. Meldrum, H. K. Christenson and B. J. Murray, Phys. Chem. Chem. Phys., 2017, 19, 31186–31193 RSC.
- R. R. Poudyal, F. Pir Cakmak, C. D. Keating and P. C. Bevilacqua, Biochemistry, 2018, 57, 2509–2519 CrossRef CAS.
- M. Tena-Solsona, C. Wanzke, B. Riess, A. R. Bausch and J. Boekhoven, Nat. Commun., 2018, 9, 1–8 CrossRef CAS.
- Y. Shin and C. P. Brangwynne, Science, 2017, 357, 1253 CrossRef CAS.
- S. Alberti, A. Gladfelter and T. Mittag, Cell, 2019, 176, 419–434 CrossRef CAS.
- C. N. Mudogo, S. Falke, H. Brognaro, M. Duszenko and C. Betzel, Traffic, 2020, 21, 220–230 CrossRef CAS.
- L. T. Chylack, T. Tanaka and C. Ishimoto, Science, 1977, 197, 1010–1012 CrossRef.
- V. N. Uversky, V. Davé, L. M. Iakoucheva, P. Malaney, S. J. Metallo, R. R. Pathak and A. C. Joerger, Chem. Rev., 2014, 114, 6844–6879 CrossRef CAS.
- J. D. Forman-Kay, R. W. Kriwacki and G. Seydoux, J. Mol. Biol., 2018, 430, 4603–4606 CrossRef CAS.
- F. Chiti and C. M. Dobson, Annu. Rev. Biochem., 2006, 75, 333–366 CrossRef CAS.
- G. B. Benedek, J. I. Clark, E. N. Serrallach, C. Y. Young, L. Mengel, T. Sauke, A. Bagg and K. Benedek, Philos. Trans. R. Soc., A, 2006, 293, 329–340 Search PubMed.
- C. O. E. Ishimoto, Proc. Natl. Acad. Sci. U. S. A., 1979, 76, 4414–4416 CrossRef CAS.
- S. Pagola, P. W. Stephens, D. S. Bohle, A. D. Kosar and S. K. Madsen, Nature, 2000, 404, 307–310 CrossRef CAS.
- E. P. Bentley, B. B. Frey and A. A. Deniz, Chem. – Eur. J., 2019, 25, 5600–5610 CrossRef CAS.
- C. P. Brangwynne, P. Tompa and R. V. Pappu, Nat. Phys., 2015, 11, 899–904 Search PubMed.
- J. Shorter, J. Biol. Chem., 2019, 294, 7113–7114 CrossRef CAS.
- J. D. Forman-Kay, R. W. Kriwacki and G. Seydoux, J. Mol. Biol., 2018, 430, 4603–4606 CrossRef CAS.
- M. Hofweber and D. Dormann, J. Biol. Chem., 2019, 294, 7137–7150 CrossRef CAS.
- Y. H. Lin, J. D. Forman-Kay and H. S. Chan, Biochemistry, 2018, 57, 2499–2508 CrossRef CAS.
- H. Lu, D. Yu, A. S. Hansen, S. Ganguly, R. Liu, A. Heckert, X. Darzacq and Q. Zhou, Nature, 2018, 558, 318–323 CrossRef CAS.
- S. Qamar, G. Z. Wang, S. J. Randle, F. S. Ruggeri, J. A. Varela, J. Q. Lin, E. C. Phillips, A. Miyashita, D. Williams, F. Ströhl, W. Meadows, R. Ferry, V. J. Dardov, G. G. Tartaglia, L. A. Farrer, G. S. Kaminski Schierle, C. F. Kaminski, C. E. Holt, P. E. Fraser, G. Schmitt-Ulms, D. Klenerman, T. Knowles, M. Vendruscolo and P. St George-Hyslop, Cell, 2018, 173, 720–734.e15 CrossRef CAS.
- E. W. Martin and T. Mittag, Biochemistry, 2018, 57, 2478–2487 CrossRef CAS.
- J. Wang, J. M. Choi, A. S. Holehouse, H. O. Lee, X. Zhang, M. Jahnel, S. Maharana, R. Lemaitre, A. Pozniakovsky, D. Drechsel, I. Poser, R. V. Pappu, S. Alberti and A. A. Hyman, Cell, 2018, 174, 688–699.e16 CrossRef CAS.
- C. Pareja-Rivera, M. Cuellar-Cruz, N. Esturau-Escofet, N. Demitri, M. Polentarutti, V. Stojanoff and A. Moreno, Cryst. Growth Des., 2017, 17, 135–145 CrossRef CAS.
- G. Sazaki, A. Moreno and K. Nakajima, J. Cryst. Growth, 2004, 262, 499–502 CrossRef CAS.
- Z. Q. Wu, Y. M. Liu, C. Liu, J. J. Chen, L. L. Chen, T. Di Zhang, R. Bin Zhou, C. Q. Yang, P. Shang and D. C. Yin, CrystEngComm, 2019, 21, 4001–4010 RSC.
- D. C. Yin, Prog. Cryst. Growth Charact. Mater., 2015, 61, 1–26 CrossRef CAS.
- N. C. Das, J. Microsc., 2014, 253, 198–203 CrossRef CAS.
- S. Coveney and N. Clarke, J. Chem. Phys., 2012, 137(17), 174901 CrossRef.
- D. J. Stewart, C. Cai, J. Nayler, T. C. Preston, J. P. Reid, U. K. Krieger, C. Marcolli and Y. H. Zhang, J. Phys. Chem. A, 2015, 119, 4177–4190 CrossRef CAS.
- Y. Qiu and V. Molinero, J. Am. Chem. Soc., 2015, 137, 10642–10651 CrossRef CAS.
- M. M. Fard, U. K. Krieger and T. Peter, J. Phys. Chem. A, 2017, 121, 9284–9296 CrossRef CAS.
- D. Zhao and J. Gao, Philos. Trans. R. Soc., A, 2019, 377, 20180207 CrossRef CAS.
- J. C. Palmer, R. Chen and E. Lascaris, J. Chem. Phys., 2017, 146, 234503 CrossRef.
- W. L. Wang, Y. H. Wu, L. H. Li, W. Zhai, X. M. Zhang and B. Wei, Sci. Rep., 2015, 5, 1–10 CAS.
- M. Ganesan and M. J. Solomon, Soft Matter, 2017, 13, 3768–3776 RSC.
- B. D. Smith, T. S. Mayer and C. D. Keating, Annu. Rev. Phys. Chem., 2012, 63, 241–263 CrossRef CAS.
- Z. Hammadi and S. Veesler, Prog. Biophys. Mol. Biol., 2009, 101, 38–44 CrossRef CAS.
- A. Rodríguez-Romero, N. Esturau-Escofet, C. Pareja-Rivera and A. Moreno, Crystals, 2017, 7, 1–13 Search PubMed.
- D. R. Hekstra, K. I. White, M. A. Socolich, R. W. Henning, V. Šrajer and R. Ranganathan, Nature, 2016, 540, 400–405 CrossRef CAS.
- S. Muscat, F. Stojceski and A. Danani, J. Mol. Graphics Modell., 2020, 96, 107535 CrossRef CAS.
- M. Shahabi and H. Raissi, J. Mol. Model., 2019, 25, 1–8 CrossRef CAS.
- S. Ilieva, D. Cheshmedzhieva and T. Dudev, Phys. Chem. Chem. Phys., 2019, 21, 16198–16206 RSC.
- Z. Jiang, L. You, W. Dou, T. Sun and P. Xu, Polymers, 2019, 11(2), 282 CrossRef.
- X. Wang, Y. Li, X. He, S. Chen and J. Z. H. Zhang, J. Phys. Chem. A, 2014, 118, 8942–8952 CrossRef CAS.
- A. Singh, S. Munshi and V. Raghavan, Proteomes, 2013, 1, 25–39 CrossRef CAS.
- M. Imani, S. Kazemi, M. Saviz, L. Farahmand, B. Sadeghi and R. Faraji, Bioelectromagnetics, 2019, 40(6), 375–390 CrossRef CAS.
- A. Baldan, J. Mater. Sci., 2002, 37, 2171–2202 CrossRef CAS.
- S. Grouazel, J. Perez, J. P. Astier, F. Bonneté and S. Veesler, Acta Crystallogr., Sect. D: Biol. Crystallogr., 2002, 58, 1560–1563 CrossRef CAS.
- R. Schubert, A. Meyer, K. Dierks, S. Kapis, R. Reimer, H. Einspahr, M. Perbandt and C. Betzel, J. Appl. Crystallogr., 2015, 48, 1476–1484 CrossRef CAS.
- S. Falke and C. Betzel, Radiation in Bioanalysis, 2019, pp. 173–193 Search PubMed.
- H. Brognaro, S. Falke, C. N. Mudogo and C. Betzel, Crystals, 2019, 9, 620 CrossRef CAS.
- P. G. Vekilov, Cryst. Growth Des., 2004, 4, 671–685 CrossRef CAS.
- J. Berry, C. P. Brangwynne and M. Haataja, Rep. Prog. Phys., 2018, 81(4), 046601 CrossRef.
- I. M. Lifshitz and V. V. Slezov, Sov. Phys. JETP, 1958, 35, 479–492 Search PubMed.
Footnote |
| † Electronic supplementary information (ESI) available. See DOI: 10.1039/d0sm01478h |
| This journal is © The Royal Society of Chemistry 2020 |

