 Open Access Article
Synergy of co-sensitizers in a copper bipyridyl redox system for efficient and cost-effective dye-sensitized solar cells in solar and ambient light†
Ellie
Tanaka
 a,
Hannes
Michaels
 b,
Marina
Freitag‡
 *b and
Neil
Robertson
 *a
*a
aSchool of Chemistry, University of Edinburgh, Kings Buildings, Edinburgh, EH9 3FJ, UK. E-mail: neil.robertson@ed.ac.uk
bDepartment of Chemistry, Ångström Laboratory, Uppsala University, Box 523, Uppsala, SE-751 20, Sweden. E-mail: marina.freitag@kemi.uu.se
First published on 13th December 2019
Abstract
Dye-sensitized solar cells (DSSCs) have a great potential to expand the area of photovoltaics towards portable or indoor applications. Since the dye is one of the most costly components in the device, it is always of interest to find ways to lower its associated cost. Here, we propose the co-sensitization technique as a simple and effective solution towards this aim. A less-expensive π–A dye (5T) was mixed with a better-performing D–A–π–A dye (XY1) to fabricate the co-sensitized devices (XY1 + 5T). The dyes were combined with a CuI/II(tmby)2 (tmby = (4,4′,6,6′-tetramethyl-2,2′-bipyridine)) electrolyte and tested at 1 sun and 0.1 sun conditions. The XY1 + 5T devices showed similar power conversion efficiency (PCE) to that of the XY1-only devices at 1 sun (avg. 9.1%), and superior PCE at 0.1 sun (avg. 9.4% vs. 8.6%). The charge transport behaviour in the devices was investigated through a combination of photophysical measurements, which revealed complementary effects of both dyes during device operation. The performance of XY1 + 5T at lower light intensity was further assessed using artificial fluorescent lighting, which marked a PCE as high as 29.2% at 1000 lux, among the highest reported. Finally, the cost of dye was estimated to be reduced by ca. 30% if an XY1-only device is replaced by XY1 + 5T with no loss in efficiency. The cost-performance is thus improved 1.4 times. Our findings will revalue the co-sensitization method as a means to address the challenges of DSSC commercialization.
Introduction
Photovoltaic energy generation is in growing demand to tackle the world population growth and future energy shortage.1–3 While crystalline silicon-based solar cells are well established for capturing outdoor sunlight, their performance is poor under low light conditions due to the indirect bandgap of crystalline silicon.4–6 Therefore, the development of alternative technologies is needed for areas such as portable charging devices or indoor-light capturing. Dye-sensitized solar cells (DSSCs) are expected to meet this category of photovoltaic applications, not only due to their ease of fabrication, but also based on recent reports which reveal their superior performance to any other established photovoltaic technology when tested in indoor-light conditions.7–9The DSSC is assembled from multiple components, namely the transparent conductive oxide window,10–13 n-type oxide,14–17 dye,18–21 electrolyte22–25 and cathode.26–29 Dedicated investigation on each component is the key towards optimization of the device as a whole.30 The present study will particularly focus on the dye, the core component for visible light capture in a DSSC. Although the dye uptake per device is relatively low (∼10−8 mol cm−2), the commercial price of dyes could rise to an order of magnitude higher than the simple materials-based synthesis cost,§ likely due to additional labour costs of batch synthesis. Obviously, complex multistep reactions will result in increased materials and labour costs giving limitations to mass production. Reducing the cost of the dye is thus crucial for the reduction of the total cost of the device.
Evolving from the classic ruthenium-centred dyes, organic dyes free from scarce metals have become the dye design trend in the past few years. Owing to their distinctively higher absorption coefficients in respect to metal-centred dyes, relatively high efficiencies have been achieved with thinner TiO2 films. Thus, the shift to metal-free organic dyes is an initial step to lower the overall cost of the sensitizer in the device. Nonetheless, the highest performing organic dyes tend to have a more complex structure and hence higher cost.20,23,31 A simple and versatile way to deal with this challenge is by co-sensitizing the target dye with another less expensive dye. The technique has been widely adopted to achieve panchromatic absorption by complementing the absorption spectrum of each individual dye.8,9,20,23,31–37 However, its potential towards reducing the overall device cost has been rarely discussed until now.
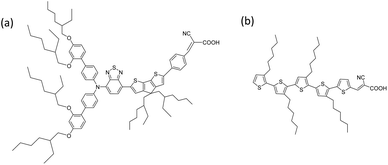
Most reported sensitizers in DSSCs have the molecular structure of D–π–A (donor/conjugated spacer/acceptor), where other variations include D–A–π–A as well as the “donor-free” π–A. The donor or end-π moiety directly interacts with the electrolyte whereas the end acceptor moiety chemically binds to the surface of the mesoporous TiO2. XY1 (Fig. 1(a)), one of the earliest D–A–π–A dyes developed by Zhang et al.,38 is a deep purple dye with a molar extinction coefficient of 56![[thin space (1/6-em)]](https://www.rsc.org/images/entities/char_2009.gif) 500 M−1 cm−1 at 552 nm. The structure employs a bulky donor in order to inhibit undesired dye aggregation and minimize charge recombination. The dye has been proven to show good power conversion efficiency (PCE) in DSSCs with a range of electrolytes including the CuI/II(tmby)2 (tmby = 4,4′,6,6′-tetramethyl-2,2′-bipyridine) redox couple.8,38 On the other hand, 5T (Fig. 1(b)), one of the earliest π–A dyes introduced by Abate et al.,39,40 is a red-orange dye with a molar extinction coefficient of 39
500 M−1 cm−1 at 552 nm. The structure employs a bulky donor in order to inhibit undesired dye aggregation and minimize charge recombination. The dye has been proven to show good power conversion efficiency (PCE) in DSSCs with a range of electrolytes including the CuI/II(tmby)2 (tmby = 4,4′,6,6′-tetramethyl-2,2′-bipyridine) redox couple.8,38 On the other hand, 5T (Fig. 1(b)), one of the earliest π–A dyes introduced by Abate et al.,39,40 is a red-orange dye with a molar extinction coefficient of 39![[thin space (1/6-em)]](https://www.rsc.org/images/entities/char_2009.gif) 000 M−1 cm−1 at 478 nm.41 The dye has been studied in combination with I−/I3− and CoII/III(bpy)3 (bpy = 2,2′-bipyridine) redox electrolytes to give promising efficiencies (PCE = 7.6% (I−/I3−) and 9.0% (CoII/III(bpy)3)).41,42
000 M−1 cm−1 at 478 nm.41 The dye has been studied in combination with I−/I3− and CoII/III(bpy)3 (bpy = 2,2′-bipyridine) redox electrolytes to give promising efficiencies (PCE = 7.6% (I−/I3−) and 9.0% (CoII/III(bpy)3)).41,42
The main issue with XY1 is the costly synthesis which involves 12 steps in total, among which 3 steps require Pd(PPh3)4 at $28 per g (Fig. S1†). Our materials-based cost estimation returns the overall synthesis cost of XY1 to be as high as $868 per mmol ($537 per g) (Table S2†), which is already higher than the commercial price of the classic N719 dye, which is $632 per mmol ($532 per g)¶.43 Therefore, it would be of interest to find a way to reduce the cost of the sensitizer while maintaining the overall power output. Here, we propose 5T as a co-sensitizer candidate for XY1 in the CuI/II(tmby)2 system based on three points (Fig. 2): (1) the UV-vis absorption peak ranges are complementary,38,41 (2) the ground-state potential of 5T (1.08 V) is more positive than the redox potential of CuI/II(tmby) (0.87 V)44 and (3) the synthesis is relatively simple (9 steps in total, where many of them are repetitive).
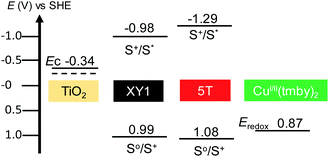 | ||
| Fig. 2 Energy diagram of the dyes used in this study, in comparison with the TiO2 anode and CuI/II(tmby)2 electrolyte. All state levels are described in volts. The values were taken from the literature.38,41,48 | ||
The effect of the choice of redox mediator upon the VOC of 5T has been previously demonstrated when a CoII/III(bpy)3 electrolyte was used instead of I−/I3−, where the VOC improved from 0.62 V to 0.79 V.42 Further increase in VOC is expected by pairing the dye with CuI/II(tmby)2. CuI/II(tmby)2 belongs to a family of recently developed fast electron-transfer copper-centred redox mediators that have opened up a new path in DSSC research.45–47 They not only have deep redox potentials but also allow minimal driving force (∼0.1 V) for dye regeneration, greatly reducing the overpotential losses at the electrolyte/dye interface.44,48 They are an interesting electrolyte choice especially if further interests lie in solid-state DSSCs (which is out of the scope of this report).45,46,48
The DSSCs fabricated in this study were sensitized with three dye conditions; (1) XY1 only (XY1), (2) 5T only (5T) and (3) a combination of 5T and XY1 (XY1 + 5T). All solar cells were assembled with the CuI/II(tmby)2 electrolyte. The current–voltage performance of the devices were characterized in response to 1 sun (AM1.5G) and 0.1 sun, and further insights on the dye/electrolyte behaviour were gained by photophysical measurements including electron lifetime and transient absorption spectroscopy.
In brief, the 5T dye in combination with CuI/II(tmby)2 electrolyte attained a VOC of max. 0.99 V (avg. 0.97 V), notably higher than the previously reported values with I−/I3− and CoII/III electrolyte.41,42 Studies on the co-sensitized XY1 + 5T devices suggested that XY1 and 5T mutually support each other at the different stages of charge transport within the cell cycle. As a consequence, the XY1 + 5T device exhibited a PCE of max. 9.53% (avg. 9.1%) at 1 sun, comparable to the XY1-only device (max. 9.56%, avg. 9.1%). At lower light intensities such as 0.1 sun, the PCE rose to max. 10.2% (avg. 9.4%), surpassing the XY1 (max. 8.94%, avg. 8.6%). Photophysical measurements suggested that the co-sensitized devices have better dye coverage compared to the mono-sensitized devices, as well as longer electron lifetime especially at lower light intensities. These indications were further assessed by testing XY1 + 5T under indoor-light conditions; revealing a high PCE of max. 29.2% (avg. 28%) at 1000 lux. Although XY1 shows higher performance than 5T in mono-sensitized DSSCs, the co-sensitized devices appear to contain more 5T dye than XY1 dye to achieve a similar PCE to the XY1-only DSSC. From UV-vis spectra analysis, the adsorbed amount of 5T dye in XY1 + 5T is estimated to be 1.7 times larger than the XY1 dye. As a result, the total dye cost (per area and per PCE) in XY1 + 5T is estimated to be lowered by ca. 30% in respect to the XY1-only device. We believe our studies are the first of a kind to evaluate the co-sensitization technique from a cost-related viewpoint.
Experimental section
Materials preparation and device fabrication
![[thin space (1/6-em)]](https://www.rsc.org/images/entities/char_2009.gif) :
:![[thin space (1/6-em)]](https://www.rsc.org/images/entities/char_2009.gif) 3 (v/v) with 1 mM chenodeoxycholic acid (CDCA). The 5T dye bath consisted of 0.1 mM 5T dye in ethanol/chloroform 7
3 (v/v) with 1 mM chenodeoxycholic acid (CDCA). The 5T dye bath consisted of 0.1 mM 5T dye in ethanol/chloroform 7![[thin space (1/6-em)]](https://www.rsc.org/images/entities/char_2009.gif) :
:![[thin space (1/6-em)]](https://www.rsc.org/images/entities/char_2009.gif) 3 (v/v) with 0.4 mM CDCA. For the pure XY1 and 5T samples, 4 mL of the premade dye solution was poured in a vial with warm films. For the XY1 + 5T co-sensitized samples, 2 mL of the premade 5T solution was poured in a vial with the warm films, immediately followed by addition of 2 mL of the XY1 solution (XY1/5T = 1
3 (v/v) with 0.4 mM CDCA. For the pure XY1 and 5T samples, 4 mL of the premade dye solution was poured in a vial with warm films. For the XY1 + 5T co-sensitized samples, 2 mL of the premade 5T solution was poured in a vial with the warm films, immediately followed by addition of 2 mL of the XY1 solution (XY1/5T = 1![[thin space (1/6-em)]](https://www.rsc.org/images/entities/char_2009.gif) :
:![[thin space (1/6-em)]](https://www.rsc.org/images/entities/char_2009.gif) 1, mol/mol and v/v). The vial was kept still to allow the two dye solutions to mix together in the bath through natural convection.
1, mol/mol and v/v). The vial was kept still to allow the two dye solutions to mix together in the bath through natural convection.
Poly(3,4-ethylenedioxythiophene) (PEDOT) was electropolymerized onto a FTO substrate (TEC8, Pilkington) from an aqueous solution of 0.1 M sodium dodecyl sulfate and 0.01 M ethylenedioxythiophene (EDOT).29 Subsequently, the photoanodes were assembled with a PEDOT cathode using a UV-curing glue (TB3035B UV Curing Sealant, Threebond) and a CS2010 High Power UV curing LED system (Thorlabs).9 The electrolyte was injected through a predrilled hole in the cathode and the hole was sealed with the UV-curing glue. The composition of the electrolyte was 0.2 M CuI(tmby)2(TFSI), 0.06 M CuII(tmby)(TFSI)2, 0.1 M lithium bis(trifluoromethanesulfonyl)imide (LiTFSI) and 0.6 M tBP in anhyd. acetonitrile. Finally, silver paint (Hans-Wohlbring GmbH) was applied to the contacts to allow optimum conductivity.
For indoor-light testing, larger-area DSSCs (active area 3.20 cm2) were fabricated following the method described above.
Characterization methods
Results and discussion
UV-vis absorption spectra
The XY1 + 5T bath showed a deep red colour as a result of the equimolar mixing of the purple XY1 dye and orange 5T dye. The films immersed in XY1, 5T and XY1 + 5T dye baths were all deeply stained, with distinct colours reflecting that of the dye bath (Fig. S2†). The UV-vis absorption spectrum of the XY1 + 5T-sensitized TiO2 film has a peak and a shoulder which can be nicely fitted as a superposition of the XY1 and 5T spectra (Fig. 3). XY1 has a shoulder at 443 nm and an absorption peak at 533 nm, while 5T has a peak at 463 nm. The co-sensitized XY1 + 5T has a peak at 459 nm and a shoulder at 534 nm. The peaks assigned to XY1 dye and 5T dye are all slightly blue-shifted when compared to the liquid-state absorption. This is a commonly observed phenomenon and is due to the dye–dye or dye–TiO2 interactions in solid-state.51,52 Combining the results from visual observation and UV-vis absorption, it can be readily seen that XY1 + 5T sensitized films incorporate both dyes. The loaded dye ratio was further estimated by referencing the solid-state UV-vis absorption data to that in solution.38,41 Full description of the calculation and a range of fittings are specified in the supporting information (Fig. S3 and S4†). The estimation suggests that a 1.7-times greater amount of 5T dye in respect to XY1 dye is incorporated in the XY1 + 5T film. One explanation of this would be the difference in size and geometry of the two dyes; the smaller and more compact 5T dye (MW: 826) has more spatial freedom when binding to the TiO2 surface compared to the bulky XY1 dye (MW: 1539), allowing 5T dye to predominate over XY1 dye when co-sensitized simultaneously.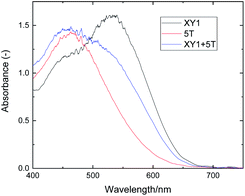 | ||
| Fig. 3 UV-vis absorption spectra of XY1-, 5T- and XY1 + 5T-sensitized transparent TiO2 films. Baseline was a non-sensitized TiO2 film. | ||
Photocurrent–voltage properties of the DSSCs
The J–V curves and basic parameters of the best performing cells are shown in Fig. 4. The average J–V characteristics of the DSSCs at 1 sun and 0.1 sun are summarized in Table 1. 7 cells were fabricated for each dye condition: XY1, 5T and XY1 + 5T. The full statistics are shown as box graphs in Fig. S5 and S6.† The VOC values at 1 sun marked a high ∼1 V in all cases, which confirms appropriate alignment of the dye HOMO levels and electrolyte redox potential. In particular, an average VOC of 0.97 V (max. 0.99 V) is the highest value reported for 5T-sensitized DSSCs.42 The large enhancement is in good agreement with the redox potential levels of the different electrolytes and our results confirm the importance of selecting the right dye/electrolyte pair. On the other hand, JSC values of 5T cells (avg. 9.9 mA cm−2, max. 10.5 mA cm−2) were lower than the previously reported I−/I3− or CoII/III systems.42 This may be explained by the employment of a thinner TiO2 film (4 μm) in this study (vs. 12 μm in literature42), which will limit the number of dye molecules that can adsorb to the mesoporous TiO2. The co-sensitized XY1 + 5T attained similar PCE to XY1 (avg. 9.1%) at 1 sun. The best device at 1 sun achieved PCE = 9.53%, while XY1 and 5T marked 9.56% and 7.93%. By lowering the light intensity of the simulated solar spectrum to 0.1 sun, XY1 + 5T outperformed XY1 with an average PCE of 9.4%, compared to XY1 (8.6%) and 5T (6.5%). The best XY1 + 5T cell achieved a PCE of 10.2%, which is clearly higher than that of XY1 (8.94%) and 5T (7.02%). The improved performance of XY1 + 5T at 0.1 sun may be related to the equilibrium drift between mass transport and charge recombination in the electrolyte and at the electrolyte/TiO2 surface.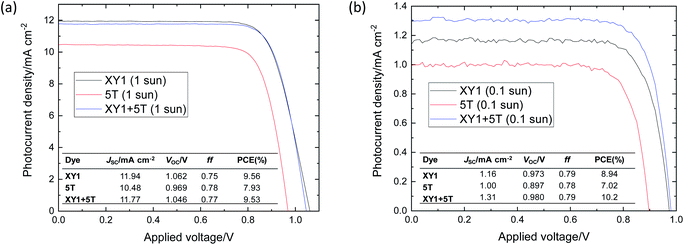 | ||
| Fig. 4 J–V curves of the best DSSCs at (a) 1 sun and (b) 0.1 sun. The insert shows the measured values of the cell parameters. | ||
| Dye condition | J SC/mA cm−2 | V OC/V | ff | PCE (%) |
|---|---|---|---|---|
| XY1 | 11.4 ± 0.4 (1.2 ± 0.5) | 1.05 ± 0.01 (0.94 ± 0.04) | 0.76 ± 0.02 (0.76 ± 0.02) | 9.1 ± 0.4 (8.6 ± 0.2) |
| 5T | 9.9 ± 0.5 (0.96 ± 0.07) | 0.97 ± 0.01 (0.87 ± 0.03) | 0.77 ± 0.02 (0.78 ± 0.04) | 7.5 ± 0.4 (6.5 ± 0.3) |
| XY1 + 5T | 11.8 ± 0.5 (1.25 ± 0.05) | 1.04 ± 0.01 (0.95 ± 0.03) | 0.74 ± 0.03 (0.80 ± 0.01) | 9.1 ± 0.3 (9.4 ± 0.4) |
Incident photon-to-current efficiency
The IPCE spectra of the DSSCs and the integrated JSC values are summarized in Fig. 5. XY1 and 5T have a maximum IPCE around 580 nm and 420 nm, respectively. The two dyes complement each other in the case of XY1 + 5T to maintain an IPCE > 65% throughout 400–620 nm. The integrated JSC values at 9.7 mA cm−2 for XY1, 6.9 mA cm−2 for 5T and 9.6 mA cm−2 for XY1 + 5T correlate well with the JSC obtained from the J–V measurements.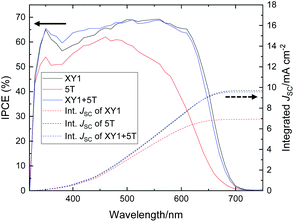 | ||
| Fig. 5 IPCE curves of XY1 (black), 5T (red) and XY1 + 5T (blue)-sensitized DSSCs. The dotted lines are the integrated current density values. | ||
Time-resolved ‘toolbox’ measurements
Time-resolved ‘toolbox’ measurements were carried out for the best solar cells with each dye condition, to investigate the relation between each dye condition and charge transport behaviour in the devices. The VOC of an illuminated cell is defined by:| VOC = EF − E0 | (1) |
EF = EC + kT![[thin space (1/6-em)]](https://www.rsc.org/images/entities/char_2009.gif) ln(nc/Nc) ln(nc/Nc) | (2) |
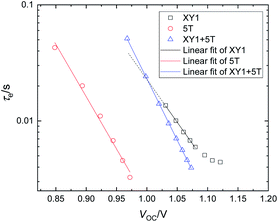
Fig. 6 depicts the electron lifetime (τe) under open-circuit conditions. The electron lifetime refers to the duration of the conduction band electrons before they recombine with the Cu2+ species. All curves show an exponential decrease, with almost identical slopes for 5T and XY1 + 5T (−9.02 s V−1, −10.6 s V−1) and a slightly deviated slope for XY1 (−7.39 s V−1 in the linear region). XY1 + 5T showing similar τe values to XY1 around the VOC ∼ 1.05 range in Fig. 6 explains the similar and high VOC (>1.0 V) achieved by both dye conditions at 1 sun (Table 1). The recombination rates are likely to be similar around this intensity. The less inclined τevs. VOC (or τevs. light intensity) slope with XY1 + 5T compared to XY1 suggests that the τe of XY1 + 5T is likely to exceed that of XY1 at lower light intensities (by extrapolating the XY1 curve towards smaller VOC). Indeed, the average VOC trend of XY1 and XY1 + 5T is flipped over from 1 sun to 0.1 sun, although the difference is very small. Investigation of the XY1 + 5T cell performance at low light conditions may give further indications on this. The D–A–π–A dye is designed so that the bulky donor prevents the Cu2+ ions from approaching the TiO2 surface and removing electrons from the TiO2 conduction band. As such, the improved electron lifetime of XY1 + 5T indicates that the amount of XY1 contained in XY1 + 5T is sufficient to suppress recombination with the Cu2+ species.38 The improved coverage of the mesoporous TiO2 with the two dyes may also suppress recombination sites in general. The size/shape difference between 5T and XY1 is probably beneficial to reach optimum coverage with minimum aggregation (Fig. S8(a)).†
The electron transport time is plotted against JSC (Fig. S9†) to investigate the speed of charge transport within the TiO2 network upon illumination. Interestingly, the transport speed declines (larger τtr) when the two dyes are combined. Slower transport during operation may generally lead to more recombination, however this is not the case with XY1 + 5T according to the electron lifetime trends. The change in transport time might be due to some surface modification of the TiO2 caused by the adsorption of both dyes. The increased risk for the electrons to recombine with Cu2+ is however likely to be traded off if the dye coverage is higher and the number of recombination sites is reduced. When both XY1 and 5T dye are present during the sensitization step, some of the voids left on the TiO2 surface by the bulky Y-shape XY1 dye could be occupied by the compact I-shape 5T dye (Fig. S8(b)).† This will then lead to an increased number of adsorbed dye molecules in XY1 + 5T compared to XY1.
Insights on charge transport by absorption spectroscopy
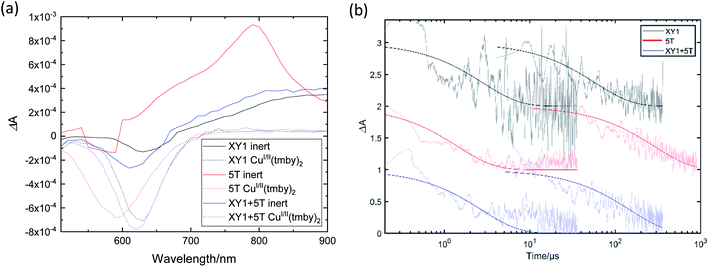
The PIA spectra of the sensitized TiO2 films for each dye condition (Fig. 7(a)) also give an insight about the electron transport and recombination of an operating device. The sensitized films in contact with an inert electrolyte show a ground-state dye bleach at ∼630 nm, ∼590 nm and ∼610 nm for XY1, 5T and XY1 + 5T, respectively. In addition, a broader absorption peak is seen at ∼790 nm for 5T and >900 nm for XY1 and XY1 + 5T. Inclusion of CuI/II(tmby)2 in the electrolyte drastically changes the spectral features. Complete disappearance of the broad absorption indicates the efficient regeneration of the dye molecules by the CuI/II(tmby)2 couple in all dye conditions. The prominent dip in the range of 500–700 nm can be assigned to a Stark bleach,53 where peaks are observed at 630 nm (XY1), ∼590 nm (5T) and 620 nm (XY1 + 5T), matching well with the bleach profiles in the inert condition. The highest bleach amplitude of XY1 + 5T in both inert and redox-active conditions may suggest higher dye coverage of XY1 + 5T compared to XY1 or 5T, consistent with our earlier predictions.TAS results are shown in Fig. 7(b). The absorption decays were fitted with an extended exponential to estimate the decay half-time for each condition. The half-time derived from the inert system relates to the recombination time of the conduction band electrons with the oxidized dyes, while that from the CuI/II(tmby)2 system relates to the speed of dye regeneration by the redox couple. The regeneration efficiency is calculated from the following equation:
| ϕreg = 1 − (τ1/2,reg/τ1/2,rec) | (3) |
Potential of XY1 + 5T for indoor DSSCs
With the contribution of both dyes in XY1 + 5T DSSCs confirmed, it is reasonable to assess their potential as indoor-operational devices; since this is the most promising direction for DSSCs in practice. In fact, the superior performance of XY1 + 5T to XY1 at 0.1 sun (max. PCE = 10.2%) indicates that this dye combination may work efficiently at ultra-low light intensities. The device fabrication and testing were similar to the work reported by Freitag et al.8 In brief, the active area was made larger (3.20 cm2) than typical lab devices (0.160 cm2) to follow conditions closer to real-life applications. A warm white fluorescent lamp at 1000 lux (303.1 μW cm−2) was chosen as the source. The PCE was calculated by Pout/Pin, where Pin is the incident light intensity (i.e. 303.1 μW cm−2 in this study) and Pout is the maximum power density recorded by the cell. Fig. 8 shows the J–V curve of the XY1 + 5T cell tested by this condition. A PCE of 29.2% was achieved, which is clearly higher than any other established photovoltaic technology including silicon and thin-films, and even amongst the highest achieved with DSSCs tested under similar conditions.6–9,54 Another DSSC was fabricated and tested to confirm the reproducibility, where the slightly lower ff led to an avg. PCE of 28% with the 2 cells (Fig. S10,†Table 1). The 3-fold efficiency jump from 1 sun to indoor-light originates from close matching of the absorption range of the dyes to the input spectral range of the light source. Although the overall PCE is lower than the best reported PCE of 31.8%,9 the VOC is comparable, marking 0.86 V in average. The relatively high VOC and PCE under ultra-low light intensity (i.e. 1000 lux) supports our findings from the electron lifetime studies. The current output with these XY1 + 5T cells is over 100 μA cm−2, which is the standard power required for low-power electronic devices in sleeping mode.8 These preliminary results suggest that the 3.2 cm2 XY1 + 5T DSSC is a practical device from the performance perspective.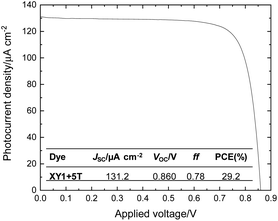 | ||
| Fig. 8 J–V curve of the best XY1 + 5T DSSC at 1000 lux. The inset shows the measured values of the cell parameters. | ||
In practice, the long-term stability of the co-sensitized devices should also be taken into consideration alongside their performance and cost. DSSCs are known to be generally chemically/thermally stable and are tolerant to moisture or oxygen at ambient levels.55,56 However, their performance can slowly deteriorate due to leakage of the volatile electrolyte from the imperfections of the sealing of the cell. In this sense, proper encapsulation of the device is crucial for the liquid electrolyte cell. On the other hand, the CuI/II(tmby)2 electrolyte selected in this study is a specific type of electrolyte that steadily converts into a stable solid hole conductor by controlled evaporation of the solvent.9,45,46,48 The device architecture employed in this study is therefore expected to facilitate future assessments on the long-term stability of the co-sensitized DSSCs as solid-state cells.
Cost estimation
Finally, the performance of the DSSCs sensitized by XY1, 5T and XY1 + 5T is discussed in relation to their preparation cost. The costs were calculated following a simple approach presented by Maciejczyk et al. In brief, the cost of XY1 and 5T was estimated from the cost of their synthesis, and the synthesis cost was approximated to the cost of the starting materials.57 We believe that this assumption is valid, since the cost of the work-up depends heavily on the scale of the synthesis and becomes negligible especially at industrial scale. The calculations in full detail are shown in Fig. S1 and S11.†The molar equivalent of the adsorbed dye(s) in XY1, 5T and XY1 + 5T was calculated by referencing the solid-state UV-vis spectra of the dyes to their liquid-state UV-vis spectra, where the peak absorbance was compared. The ratio of XY1 and 5T in the co-sensitized film was estimated by fitting the spectra of XY1 + 5T to a sum of XY1 and 5T at different ratios. The fitted curves and error trend are described in Fig. S3 and S4.†
From the cost calculation of each dye and estimated molar equivalent of each dye in XY1, 5T and XY1 + 5T, we have found that the cost of dye per unit area can be reduced to ca. 70% if we blend 5T with XY1 to reach a performance similar to XY1 (avg. PCE = 9.1% at 1 sun) (Table S2†). The contribution comes from the much cheaper 5T dye ($275 per mmol), whose synthesis cost is ca. 70% less than that of XY1 dye ($868 per mmol). Although the number of 5T dye molecules in a 5T-only device is estimated to be more than the number of XY1 dye molecules in an XY1 device (1.29 mol eq. vs. 1 mol eq.), the total dye cost per unit area is ca. 60% less in 5T. Likewise, our estimate shows that XY1 + 5T contains 1.7-times more 5T dye than XY1 dye, with a total of 1.3 mol equivalent XY1 dye and 5T dye. The estimation is in good accord with the previous suggestions that XY1 + 5T-sensitized films have higher dye coverage. When we recalculate the costs per unit area as “cost per unit area per PCE” (=cost performance), the sensitizer cost of XY1 + 5T decreases from 74% to 68% in respect to the cost of XY1-only with 0.1 sun illumination. The value is relatively close to the cost performance of 5T-only (54%). The results demonstrate that 5T dye is indeed a good co-sensitizer for XY1 dye not only in terms of performance but also in terms of cost.
Co-sensitization as a cost-improvement strategy
Our results show that the co-sensitization effectively improves parameters such as the optical absorption/IPCE, electron lifetime, dye regeneration, dye coverage and cost performance compared to the mono-sensitized DSSCs. In this study, we adopted a simple 1![[thin space (1/6-em)]](https://www.rsc.org/images/entities/char_2009.gif) :
:![[thin space (1/6-em)]](https://www.rsc.org/images/entities/char_2009.gif) 1 (mol/mol) dye mixing ratio of XY1 and 5T in order to make our findings applicable to a broader choice of dye conditions. For instance, fine tuning of the dye mixing ratio has been investigated by Freitag et al.,8 where the best performance was achieved with a ratio of D35 + XY1 = 4
1 (mol/mol) dye mixing ratio of XY1 and 5T in order to make our findings applicable to a broader choice of dye conditions. For instance, fine tuning of the dye mixing ratio has been investigated by Freitag et al.,8 where the best performance was achieved with a ratio of D35 + XY1 = 4![[thin space (1/6-em)]](https://www.rsc.org/images/entities/char_2009.gif) :
:![[thin space (1/6-em)]](https://www.rsc.org/images/entities/char_2009.gif) 1. In their study, the 1
1. In their study, the 1![[thin space (1/6-em)]](https://www.rsc.org/images/entities/char_2009.gif) :
:![[thin space (1/6-em)]](https://www.rsc.org/images/entities/char_2009.gif) 1 ratio is shown to be very close to the optimized 4
1 ratio is shown to be very close to the optimized 4![[thin space (1/6-em)]](https://www.rsc.org/images/entities/char_2009.gif) :
:![[thin space (1/6-em)]](https://www.rsc.org/images/entities/char_2009.gif) 1 ratio. In this view, we believe that the present study provides sufficient general demonstration of co-sensitization for cost-performance improvement purposes. In the case of XY1 + 5T, our data suggest that the binding ratio of XY1 dye and 5T dye in XY1 + 5T is ∼5
1 ratio. In this view, we believe that the present study provides sufficient general demonstration of co-sensitization for cost-performance improvement purposes. In the case of XY1 + 5T, our data suggest that the binding ratio of XY1 dye and 5T dye in XY1 + 5T is ∼5![[thin space (1/6-em)]](https://www.rsc.org/images/entities/char_2009.gif) :
:![[thin space (1/6-em)]](https://www.rsc.org/images/entities/char_2009.gif) 8 when a XY1
8 when a XY1![[thin space (1/6-em)]](https://www.rsc.org/images/entities/char_2009.gif) :
:![[thin space (1/6-em)]](https://www.rsc.org/images/entities/char_2009.gif) 5T = 1
5T = 1![[thin space (1/6-em)]](https://www.rsc.org/images/entities/char_2009.gif) :
:![[thin space (1/6-em)]](https://www.rsc.org/images/entities/char_2009.gif) 1 (mol/mol) bath is used. We could thus predict that increasing the amount of XY1 in the dye bath would perhaps lead to extended absorption in the longer wavelength region (as in Fig. S3,† 0.7 XY1 + 0.5 5T) and enhance the electron lifetime, resulting in higher PCE. On the other hand, increasing the amount of 5T will steadily reduce the total dye cost and also improve the dye coverage, which might lead to even cheaper DSSCs with maintained performance. Since the cost-performance is based on the balance of cost and performance, the optimized dye mixing ratio should be investigated experimentally by comparing the PCE and optical absorption for each dye ratio.
1 (mol/mol) bath is used. We could thus predict that increasing the amount of XY1 in the dye bath would perhaps lead to extended absorption in the longer wavelength region (as in Fig. S3,† 0.7 XY1 + 0.5 5T) and enhance the electron lifetime, resulting in higher PCE. On the other hand, increasing the amount of 5T will steadily reduce the total dye cost and also improve the dye coverage, which might lead to even cheaper DSSCs with maintained performance. Since the cost-performance is based on the balance of cost and performance, the optimized dye mixing ratio should be investigated experimentally by comparing the PCE and optical absorption for each dye ratio.
Conclusions
A less expensive π–A 5T dye was co-sensitized with a better-performing D–A–π–A XY1 dye to achieve efficient CuI/II(tmby)2-based DSSCs. Photophysical measurements revealed the complementary effects of XY1 and 5T in the co-sensitized devices during operation. DSSCs incorporating both XY1 and 5T achieved a PCE of 9.5% (avg. 9.1%) at 1 sun and 10.2% (avg. 9.4%) at 0.1 sun, which is similar or superior to the DSSCs using only XY1. The XY1 + 5T was further tested in indoor-light conditions, where the best cell reached an impressive power conversion efficiency of 29.2%, which is among the highest achieved by any reported solar cells under a similar condition. The co-sensitized XY1 + 5T solar cells are also less expensive than the XY1-only cells, which makes them more commercially viable than the relatively high performing mono-sensitized solar cells in terms of cost and performance.We hope this study will shed light on another aspect of the simple and well-known co-sensitization technique, with some useful indications on how to select the appropriate combination of dyes and how to evaluate them when aiming for practical usage. Overall, in addition to the established efficiency enhancement, we have demonstrated that the co-sensitization approach has great potential to be more widely studied as a cost-reduction strategy to develop genuinely practical DSSCs.
Conflicts of interest
There are no conflicts to declare.Acknowledgements
The authors thank Dr Miquel Planells for providing the 5T dye. E. T. thanks the Energy Technology Partnership for their funding towards collaborative research and JASSO for their PhD studentship.Notes and references
- World Energy Council, World Energy Resources 2016, London, United Kingdom, 2016 Search PubMed.
- R. G. Miller and S. R. Sorrell, Philos. Trans. R. Soc., A, 2014, 372, 20130179 CrossRef PubMed.
- United Nations, World Population Prospects 2019, New York, United States of America, 2019 Search PubMed.
- K. Rajkanan, R. Singh and J. Shewchun, Solid-State Electron., 1979, 22, 793–795 CrossRef CAS.
- K. L. Chopra, P. D. Paulson and V. Dutta, Prog. Photovolt. Res. Appl., 2004, 12, 69–92 CrossRef CAS.
- N. H. Reich, W. G. J. H. M. van Sark and W. C. Turkenburg, Renewable Energy, 2011, 36, 642–647 CrossRef.
- C. Hora, F. Santos, M. G. F. Sales, D. Ivanou and A. Mendes, ACS Sustainable Chem. Eng., 2019, 7, 13464–13470 CrossRef CAS.
- M. Freitag, J. Teuscher, Y. Saygili, X. Zhang, F. Giordano, P. Liska, J. Hua, S. M. Zakeeruddin, J. Moser, M. Grätzel and A. Hagfeldt, Nat. Photonics, 2017, 11, 372–378 CrossRef CAS.
- Y. Cao, Y. Liu, S. M. Zakeeruddin, A. Hagfeldt and M. Grätzel, Joule, 2018, 2, 1108–1117 CrossRef CAS.
- C. Sima, C. Grigoriu and S. Antohe, Thin Solid Films, 2010, 519, 595–597 CrossRef CAS.
- T. Kawashima, T. Ezure, K. Okada, H. Matsui, K. Goto and N. Tanabe, J. Photochem. Photobiol., A, 2004, 164, 199–202 CrossRef CAS.
- V. Kumar, N. Singh, V. Kumar, L. P. Purohit, A. Kapoor, O. M. Ntwaeaborwa and H. C. Swart, J. Appl. Phys., 2013, 114, 134506 CrossRef.
- K. Yoo, J.-Y. Kim, J. A. Lee, J. S. Kim, D.-K. Lee, K. Kim, J. Y. Kim, B. Kim, H. Kim, W. M. Kim, J. H. Kim and M. J. Ko, ACS Nano, 2015, 9, 3760–3771 CrossRef CAS PubMed.
- X. Lü, X. Mou, J. Wu, D. Zhang, L. Zhang, F. Huang, F. Xu and S. Huang, Adv. Funct. Mater., 2010, 20, 509–515 CrossRef.
- P. Tiwana, P. Docampo, M. B. Johnston, H. J. Snaith and L. M. Herz, ACS Nano, 2011, 5, 5158–5166 CrossRef CAS PubMed.
- E. Tanaka, L. Nurdiwijayanto, M. Hagiwara and S. Fujihara, J. Solid State Electrochem., 2018, 22, 3119–3127 CrossRef CAS.
- S. Muduli, O. Game, V. Dhas, K. Vijayamohanan, K. A. Bogle, N. Valanoor and S. B. Ogale, Sol. Energy, 2012, 86, 1428–1434 CrossRef CAS.
- Y. Jo, C. L. Jung, J. Lim, B. H. Kim, C. H. Han, J. Kim, S. Kim, D. Kim and Y. Jun, Electrochim. Acta, 2012, 66, 121–125 CrossRef CAS.
- S. Ito, H. Miura, S. Uchida, M. Takata, K. Sumioka, P. Liska, P. Comte, P. Péchy and M. Grätzel, Chem. Commun., 2008, 5194–5196 RSC.
- K. Kakiage, Y. Aoyama, T. Yano, K. Oya, J. Fujisawa and M. Hanaya, Chem. Commun., 2015, 51, 15894–15897 RSC.
- A. Abbotto, N. Manfredi, C. Marinzi, F. De Angelis, E. Mosconi, J. Yum, Z. Xianxi, K. Nazeeruddin and M. Grätzel, Energy Environ. Sci., 2009, 2, 1094–1101 RSC.
- G. Boschloo and A. Hagfeldt, Acc. Chem. Res., 2009, 42, 1819–1826 CrossRef CAS PubMed.
- A. Yella, H.-W. Lee, H. N. Tsao, C. Yi, A. K. Chandiran, M. K. Nazeeruddin, E. W.-G. Diau, C.-Y. Yeh, S. M. Zakeeruddin and M. Grätzel, Science, 2011, 334, 629–634 CrossRef CAS PubMed.
- M. Freitag, F. Giordano, W. Yang, M. Pazoki, Y. Hao, B. Zietz, M. Grätzel, A. Hagfeldt and G. Boschloo, J. Phys. Chem. C, 2016, 120, 9595–9603 CrossRef CAS.
- M. Wang, N. Chamberland, M. Grätzel, L. Breau, J.-E. Moser, R. Humphry-Baker, B. Marsan and S. M. Zakeeruddin, Nat. Chem., 2010, 2, 385–389 CrossRef CAS PubMed.
- X. Meng, C. Yu, X. Song, Y. Liu, S. Liang, Z. Liu, C. Hao and J. Qiu, Adv. Energy Mater., 2015, 5, 1500180 CrossRef.
- J. S. Jang, D. J. Ham, E. Ramasamy, J. Lee and J. S. Lee, Chem. Commun., 2010, 46, 8600–8602 RSC.
- J. Wu, Q. Li, L. Fan, Z. Lan, P. Li, J. Lin and S. Hao, J. Power Sources, 2008, 181, 172–176 CrossRef CAS.
- H. Ellis, N. Vlachopoulos, L. Häggman, C. Perruchot, M. Jouini, G. Boschloo and A. Hagfeldt, Electrochim. Acta, 2013, 107, 45–51 CrossRef CAS.
- M. Ye, X. Wen, M. Wang, J. Iocozzia, N. Zhang, C. Lin and Z. Lin, Mater. Today, 2015, 18, 155–162 CrossRef CAS.
- S. Mathew, A. Yella, P. Gao, R. Humphry-Baker, B. F. E. Curchod, N. Ashari-Astani, I. Tavernelli, U. Rothlisberger, M. K. Nazeeruddin and M. Grätzel, Nat. Chem., 2014, 6, 242–247 CrossRef CAS PubMed.
- J. M. Cole, G. Pepe, O. K. Al Bahri and C. B. Cooper, Chem. Rev., 2019, 119, 7279–7327 CrossRef CAS PubMed.
- J. Fang, H. Mao, J. Wu, X. Zhang and Z. Lu, Appl. Surf. Sci., 1997, 119, 237–241 CrossRef CAS.
- E. A. Knyazeva, W. Wu, T. N. Chmovzh, N. Robertson, J. D. Woollins and O. A. Rakitin, Sol. Energy, 2017, 144, 134–143 CrossRef CAS.
- M. Kimura, H. Nomoto, N. Masaki and S. Mori, Angew. Chem., Int. Ed., 2012, 51, 4371–4374 CrossRef CAS PubMed.
- J. Liu, Y. Wu, C. Qin, X. Yang, T. Yasuda, A. Islam, K. Zhang, W. Peng, W. Chen and L. Han, Energy Environ. Sci., 2014, 7, 2963–2967 RSC.
- A. Islam, M. Akhtaruzzaman, T. H. Chowdhury, C. Qin, L. Han, I. M. Bedja, R. Stalder, K. S. Schanze and J. R. Reynolds, ACS Appl. Mater. Interfaces, 2016, 8, 4616–4623 CrossRef CAS PubMed.
- X. Zhang, Y. Xu, F. Giordano, M. Schreier, N. Pellet, Y. Hu, C. Yi, N. Robertson, J. Hua, S. M. Zakeeruddin, H. Tian and M. Grätzel, J. Am. Chem. Soc., 2016, 138, 10742–10745 CrossRef CAS PubMed.
- M. Planells, A. Abate, H. J. Snaith and N. Robertson, ACS Appl. Mater. Interfaces, 2014, 6, 17226–17235 CrossRef CAS PubMed.
- A. Abate, M. Planells, D. J. Hollman, S. D. Stranks, A. Petrozza, A. R. S. Kandada, Y. Vaynzof, S. K. Pathak, N. Robertson and H. J. Snaith, Adv. Energy Mater., 2014, 4, 1400166 CrossRef.
- Y. Hu, A. Ivaturi, M. Planells, C. L. Boldrini, A. O. Biroli and N. Robertson, J. Mater. Chem. A, 2016, 4, 2509–2516 RSC.
- Y. Hu, A. Abate, Y. Cao, A. Ivaturi, S. M. Zakeeruddin, M. Grätzel and N. Robertson, J. Phys. Chem. C, 2016, 120, 15027–15034 CrossRef CAS.
- Merck Price Catalogue, https://www.sigmaaldrich.com/catalog/https://www.sigmaaldrich.com/catalog/product/aldrich/703214?lang=en%26region=GB, accessed 20 September 2019.
- Y. Saygili, M. Söderberg, N. Pellet, F. Giordano, Y. Cao, A. B. Muñoz-García, S. M. Zakeeruddin, N. Vlachopoulos, M. Pavone, G. Boschloo, L. Kavan, J.-E. Moser, M. Grätzel, A. Hagfeldt and M. Freitag, J. Am. Chem. Soc., 2016, 138, 15087–15096 CrossRef CAS PubMed.
- M. Freitag, Q. Daniel, M. Pazoki, K. Sveinbjörnsson, J. Zhang, L. Sun, A. Hagfeldt and G. Boschloo, Energy Environ. Sci., 2015, 8, 2634–2637 RSC.
- W. Zhang, Y. Wu, H. W. Bahng, Y. Cao, C. Yi, Y. Saygili, J. Luo, Y. Liu, L. Kavan, J. E. Moser, A. Hagfeldt, H. Tian, S. M. Zakeeruddin, W.-H. Zhu and M. Grätzel, Energy Environ. Sci., 2018, 11, 1779–1787 RSC.
- H. Michaels, I. Benesperi, T. Edvinsson, A. Belén Muñoz-Garcia, M. Pavone, G. Boschloo and M. Freitag, Inorganics, 2018, 6, 53 CrossRef.
- Y. Cao, Y. Saygili, A. Ummadisingu, J. Teuscher, J. Luo, N. Pellet, F. Giordano, S. M. Zakeeruddin, J.-E. Moser, M. Freitag, A. Hagfeldt and M. Grätzel, Nat. Commun., 2017, 8, 15390 CrossRef PubMed.
- G. Boschloo, L. Häggman and A. Hagfeldt, J. Phys. Chem. B, 2006, 110, 13144–13150 CrossRef CAS PubMed.
- G. Boschloo and A. Hagfeldt, Inorg. Chim. Acta, 2008, 361, 729–734 CrossRef CAS.
- L. Ducasse, F. Castet, R. Méreau, S. Nénon, J. Idé, T. Toupance and C. Olivier, Chem. Phys. Lett., 2013, 556, 151–157 CrossRef CAS.
- W. Zhu, Y. Wu, S. Wang, W. Li, X. Li, J. Chen, Z.-S. Wang and H. Tian, Adv. Funct. Mater., 2011, 21, 756–763 CrossRef CAS.
- M. Pazoki, A. Hagfeldt and G. Boschloo, Electrochim. Acta, 2015, 179, 174–178 CrossRef CAS.
- M. Foti, C. Tringali, A. Battaglia, N. Sparta, S. Lombardo and C. Gerardi, Sol. Energy Mater. Sol. Cells, 2014, 130, 490–494 CrossRef CAS.
- H. Matsui, K. Okada, T. Kitamura and N. Tanabe, Sol. Energy Mater. Sol. Cells, 2009, 93, 1110–1115 CrossRef CAS.
- K. Zhu, S.-R. Jang and A. J. Frank, Energy Environ. Sci., 2012, 5, 9492–9495 RSC.
- M. R. Maciejczyk, R. Chen, A. Brown, N. Zheng and N. Robertson, J. Mater. Chem. C, 2019, 7, 8593–8598 RSC.
Footnotes |
| † Electronic supplementary information (ESI) available. See DOI: 10.1039/c9ta10779g |
| ‡ Current address: Chemistry, School of Natural and Environmental Science, Newcastle University, Newcastle upon Tyne, UK. |
| § Claim based on our synthesis cost analysis and private conversation with suppliers. |
| ¶ £416 per g. Converted to USD by 1 GBP = 1.28 USD. |
| || The film thickness was measured with a profilometer (data not shown). |
| This journal is © The Royal Society of Chemistry 2020 |

