Short-wavelength infrared self-assessed photothermal agents based on Ho,Tm:KLu(WO4)2 nanocrystals operating in the third biological window (1.45–1.96 μm wavelength range)†
Albenc
Nexha
 ,
Joan J.
Carvajal
 *,
Maria Cinta
Pujol
,
Francesc
Díaz
and
Magdalena
Aguiló
Universitat Rovira i Virgili, Departament Química Física i Inorgànica, Física i Cristal.lografia de, Materials i Nanomaterials (FiCMA-FiCNA) – EMaS, Campus Sescelades, E-43007, Tarragona, Spain. E-mail: joanjosep.carvajal@urv.cat
First published on 22nd November 2019
Abstract
KLu1−x−yHoxTmy(WO4)2 nanocrystals with different atomic concentrations (x = 0.01, 0.03, 0.05, 0.075, 0.1, 0.15 and y = 0.05, 0.1, 0.2) were synthesized via the modified sol–gel Pechini method, using ethylenediaminetetraacetic acid as the chelating agent, and polyethyleneglycol as the esterification agent. Different doping levels were implemented with the goal to determine the optimal ratio for maximizing the intensity of their optical emission in the short-wavelength infrared (SWIR) region, their thermal sensitivity as luminescent thermometers and the photothermal conversion efficiency to act as photothermal agents. The obtained KLu1−x−yHoxTmy(WO4)2 nanocrystals exhibit a monoclinic structure and an irregular shape, with a size of around 150 nm. The photoluminescence spectrum in the SWIR region of the obtained nanocrystals, excited at 808 nm, shows three main bands attributed to the electronic transitions: 3H4 → 3F4 (1.45 μm) and 3F4 → 3H6 (1.8 μm) of Tm3+ and 5I7 → 5I8 (1.96 μm) of Ho3+. The temperature dependency of the three emission bands was recorded in the physiological range of temperatures from 293 K to 333 K, displaying a relative thermal sensitivity (Srel) of 0.90% K−1 at 293 K for the doping level of 1 at% Ho3+ and 10 at% Tm3+, representing the highest reported up to now in the SWIR region. The photothermal conversion efficiency (η) of the KLu1−x−yHoxTmy(WO4)2 nanocrystals is 40 ± 2% for the same doping levels, being competitive with other photothermal agents reported before, like metallic and semiconductor nanocrystals. The simultaneous ability of these nanocrystals to combine photothermal conversion efficiency and thermal sensing in the SWIR is demonstrated through an ex vivo experiment.
1. Introduction
Photothermal therapy refers to the process of generation of heat from the absorbance of light with the ultimate goal of inducing cellular hyperthermia. This is a process applied for the treatment of tumoral diseases between 314 K (41 °C) and 321 K (48 °C) that leads to protein aggregation, long term cell inactivation, and cell death.1 This therapy is achieved through the incorporation of the so-called photothermal agents,2 which absorb light and convert it efficiently into heat. Additionally, the photothermal agents should exhibit tumor-homing ability to improve the efficiency of the photothermal therapy without rendering toxic side effects.3Photoabsorber nanomaterials such as gold nanostructures (nanoparticles,4 nanorods,5–8 nanoshells,9 nanocages10 and hollow nanospheres11), carbon nanomaterials,12 palladium nanosheets,13 copper sulfide nanoparticles,14 and polymers15 have been reported as examples of efficient photothermal agents. However, besides efficient absorbance features, good photo-stability and excellent photothermal conversion efficiency have been reported for these structures, none of these materials allows for the reading of temperature by themselves. Thus, external temperature control is required. This is especially important when the real temperature inside the tumor is substantially different from the one that can be determined from outside the body.16 So, multifunctional thermal agents that combine photothermal conversion ability and thermal sensing are highly desired, as pointed out by Quintanilla and Liz-Marzán in their excellent and recent review about the guiding rules for selecting a nanothermometer, in which they discuss the specific case of multifunctional probes combining photothermal activity and thermometry applied to the biomedical field.17 In this context, recently, some approaches have been developed. For instance, PbS/CdS/ZnS quantum dots have been demonstrated to show heating and thermometric behavior.16 Other approaches involve thermosensitive polymer-capped gold nanorods, which combine plasmonic heating, and use the temperature-dependent local surface plasmon resonance spectra due to the submolecular conformational change of the thermosensitive polymer (pNIPAAm) to measure the temperature, with a thermal precision of 80 mK, and a temporal response as fast as <4 ms.18 Another example are the magnetoplasmonic (Co/Au or Fe/Au) nanodomes developed by Li et al., that merge exceptionally efficient plasmonic heating and temperature detection by measuring the magnetic-induced rotation of the nanodomes in solution, with a precision of 0.05 K.19
Lanthanide-based nanomaterials can also provide these two functions in a single material. The peculiar electronic configuration of lanthanide ions gives rise to a rich electronic energy level structure that can be excited with light, leading to radiative and non-radiative processes. Radiative processes emit light that can be used for thermal sensing purposes through luminescence nanothermometry, while non-radiative processes result in heat generation that can make of these materials potential photothermal agents.20,21 Lanthanide-based nanomaterials can operate in a very broad range of the electromagnetic spectrum, covering from the UV to the NIR, depending on the ion chosen, and only limited by the transparency of the host in which they are embedded. This is a clear advantage when compared to other types of photothermal agents developed up to now. In fact, by embedding neodymium in some hosts and operating above certain doping ranges, it is possible to develop multifunctional nanoparticles that can be used as both photothermal agents and luminescent thermometers.22–24
Biological windows are the spectral ranges where biological tissues become partially transparent due to a simultaneous reduction in both absorption and scattering of light.25 In biological tissues, the extinction coefficient of optical radiation is determined by the absorbance of the different components of the tissue and their optical scattering. These characteristics give rise to the different biological windows in which the biological tissues are more transparent: (i) the first biological window (I-BW) lying in the range 650–950 nm, (ii) the second biological window (II-BW) extending from 1000 to 1350 nm, and (iii) the third biological window (III-BW), also called short wavelength infrared region (SWIR), that goes from 1350 nm to 2400 nm.26,27 The III-BW, or SWIR, is important because light transmits more effectively (up to three times) through specific biological tissues like those containing melanine, achieving higher light penetration depths.28 Also, scattering is reduced in this spectral range, as it is commonly accepted that the scattering coefficient decreases with increasing wavelength into near-infrared (NIR).27
In this paper, we analyze the SWIR emission of the Ho,Tm:KLu(WO4)2 nanocrystals for temperature sensing and light-to-heat conversion after near infrared (NIR) excitation. In particular, for temperature sensing, we analyzed the emission bands at 1.45 μm and 1.8 μm of Tm3+ and the 1.96 μm emission band of Ho3+, excited at 808 nm, and we evaluated their photothermal conversion at this particular excitation wavelength. Monoclinic potassium lutetium double tungstate (KLu(WO4)2) offers a high chemical stability, large values of absorption and emission cross sections for lanthanide ions, and the possibility to dope the material, regardless of the concentration level, without fluorescence quenching.29,30 We optimized the concentration of the doping ions to maximize their performance for these two functionalities. In this way we develop multifunctional nanoparticles that can be used as self-assessed photothermal agents, in which the same nanoparticle releases heat and emits light that allows determining the temperature in situ.
2. Experiments
2.1. Materials
Lutetium nitrate hydrate (Lu(NO3)3·H2O, 99.99%), holmium nitrate pentahydrate (Ho(NO3)3·5H2O, 99.9%), potassium carbonate (K2CO3, 99.997%) and ethylenediaminetetraacetic acid (EDTA, 99%) were purchased from Alfa Aesar. Thulium nitrate pentahydrate (Tm(NO3)3·5H2O, 99.9%) and poly(ethyleneglycol) (PEG, MW = 400 g mol−1) were purchased from Sigma Aldrich. Ammonium tungstate ((NH4)2WO4, 99.99%) was purchased from American Elements.2.2. Synthesis of KLu1−x−yHoxTmy(WO4)2 nanocrystals
KLu1−x−yHoxTmy(WO4)2 (hereafter Ho,Tm:KLuW) nanocrystals with atomic concentrations x = 0.01, 0.03, 0.05, 0.075, 0.1, 0.15 and y = 0.05, 0.1, 0.2 were synthesized using the modified sol–gel Pechini method.31 Lutetium(III) nitrate hydrate, holmium(III) nitrate pentahydrate and thulium(III) nitrate pentahydrate used as starting reagents, were dissolved completely under stirring in distilled water, followed by the addition of EDTA as the chelating agent, in a molar ratio [EDTA]/[metals] = 1. Ammonium tungstate and potassium carbonate were added to the aqueous mixture, subsequently heated at 353 K under magnetic stirring during a day until the complete dissolution of the reagents. Poly(ethyleneglycol) acting as the esterification agent, was added to the mixture in a molar ratio [PEG]/[EDTA] = 2. The solution was heated at 373 K to evaporate water and generate the polymeric gel. The polymeric gel was then precalcined at 573 K for 3 hours to obtain the precursor powders that were finally calcined at 1023 K for 2 hours to eliminate the organic compounds and crystallize the desired nanocrystals.2.3. Characterization
Powder X-ray diffraction (XRD) measurements were made using a Siemens D5000 diffractometer (Bragg–Brentano parafocusing geometry and vertical θ–θ goniometer) fitted with a curved graphite diffracted-beam monochromator, incident and diffracted-beam Soller slits, a 0.06° receiving slit and a scintillation counter as a detector. The angular 2θ diffraction range was between 5 and 70°. The data were collected with an angular step of 0.05° at 3 s per step and sample rotation. Cu Kα radiation was obtained from a copper X-ray tube operated at 40 kV and 30 mA.For the morphological characterization, transmission electron microscopy (TEM) images were recorded using a JEOL JEM-1011 electron microscope operating at an accelerating voltage of 100 kV. For the preparation of the TEM grids, the nanocrystals were dispersed in ethanol using ultrasounds and around 15 μL of diluted ethanol dispersion were placed on the surface of a copper grid covered by a holey carbon film (HD200 Copper Formvar/carbon).
To characterize the vibrational modes of the nanocrystals, a micro-Raman analysis was performed, using a Renishaw inVia Reflex microscope with the unpolarized light from a 514 nm argon laser focused on the sample by a 50× Leica objective. Analysis were performed from the range of 200–2000 cm−1, using a grating with 2400 lines per mm and an exposure time of 10 s.
For the photoluminescence analysis of the nanocrystals, the emission spectra were recorded in a Yokogawa AQ6375 optical spectrum analyzer in the range from 1350 nm to 2200 nm, with a resolution of 2 nm and an integration time of 1 s. The nanoparticles were excited by a 808 nm fiber-coupled diode laser with a power of 200 mW and the beam was focused on the sample using a 20× microscope objective (numerical aperture 0.4) and bringing a spot diameter of around 1 μm in the sample. The excitation density is around 100 W cm−2. The scattered excitation radiation was eliminated by using a 850 nm longpass dichroic filter (Thorlabs). For the temperature-photoluminescence dependence analysis, the methodology was the same, except that the nanocrystals were introduced inside a heating stage (Linkam, THMS 600) equipped with a boron disk for improved temperature distribution.
The photothermal conversion efficiency was investigate by applying the method of the integrating sphere.32 A glass cuvette containing an aqueous solution of the KLu1−x−yHoxTmy(WO4)2 nanocrystals with a concentration of 1 g L−1 was placed inside the integrating sphere, perpendicular to the laser irradiation provided by the 808 nm fiber-coupled diode laser with a power of 200 mW. The laser from the fiber tip was collimated with a spot size of 5 mm in diameter on the sample. The signal was collected using a powermeter Ophir Nova II.
For the self-assessed photothermal conversion proof of concept, the methodology was exactly the same as in the photoluminescence analysis of the nanocrystals, with the addition of a digital multimeter equipped with a platinum and platinum-10% rhodium thermocouple to monitor the temperature, covered with a 2 mm thick chicken breast slice, and placed close to the injected nanoparticles.
3. Results and discussion
3.1. Structural and morphological characterizations
All Ho,Tm:KLuW nanocrystals synthesized with different molar concentrations crystallize in the monoclinic system with the C2/c spatial group, confirmed by powder X-ray diffraction (XRD) according to the reference XRD pattern of KLu(WO4)2 (JCPDS file 54-1204),33 as presented in Fig. 1 for some representative samples. The XRD patterns of all the samples are shown in Fig. S1 (ESI†).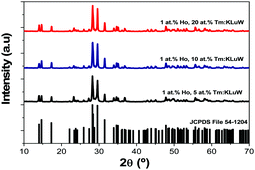 | ||
| Fig. 1 XRD pattern of the Ho,Tm:KLuW nanocrystals synthesized by the modified sol–gel Pechini method containing different dopant concentrations (1 at% Ho and 5, 10 and 20 at% Tm). The reference pattern of KLu(WO4)2 (JCPDS file 54-1204)26 is included for comparison. | ||
By using the Debye–Scherrer equation,34 we estimated an average crystallite value of 43 ± 2 nm.
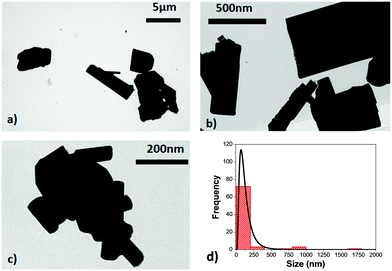
TEM micrographs reveal the irregular shape of the Ho,Tm:KLuW nanocrystals, as can be seen in Fig. 2, with the presence of aggregates with sizes up to 1.8 μm. The use of high temperature annealing to achieve the desired crystalline monoclinic phase favors the aggregation of the nanocrystals and the wide size distribution ranging from 150 ± 25 nm to 1.8 μm, as can be observed in the size distribution plot obtained after the analysis of the TEM pictures, and shown in Fig. 2(d). This behavior, however is a typical observation in the modified sol–gel Pechini method, as reported elsewhere.21,31 No differences in terms of size distribution were observed as a function of the dopant concentrations.
Due to the role of the phonon energy values in the multiphonon non-radiative decay processes, which will be related to the photothermal conversion efficiency of our nanocrystals, we have determined the optical phonons of the synthesized samples as shown in Fig. 3. The vibrational modes observed in the obtained nanocrystals are the expected ones for the monoclinic KLu(WO4)2 compound,30 taking as an example the Ho,Tm:KLuW nanoparticles (1 at% Ho, 10 at% Tm), as shown in Fig. 3. The strongest peak, observed at around 902 cm−1, is attributed to the stretching mode of (W–O). The second most intense peak, observed at around 746 cm−1, is the coupling between the stretching mode of (W–O) and the oxygen-doubled bridged (WOOW).29 The range between 270–400 cm−1 is attributed to the bending modes and the 400–1000 cm−1 range is related to the stretching modes of the WO6 group in the double tungstates.30 The phonons below 270 cm−1 are associated to the translational modes of the cations (K1+, Lu3+ and W6+) and rotational motion of WO6 groups in the unit cell.30
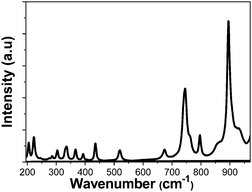 | ||
| Fig. 3 Unpolarized Raman spectra of the obtained KLu1−x−yHoxTmy(WO4)2 nanocrystals (1 at% Ho, 10 at% Tm) by the modified Pechini method. | ||
3.2. Photoluminescence characterizations
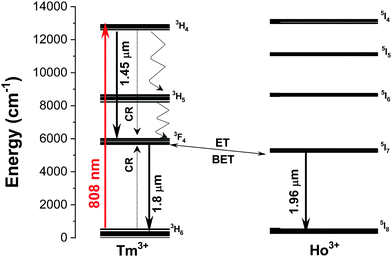
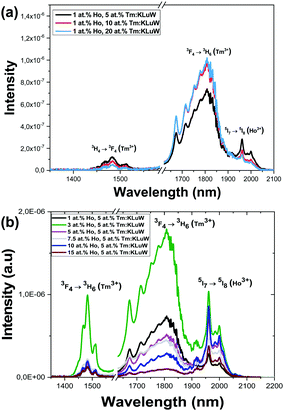
The emission spectra of the Ho,Tm:KLuW nanocrystals, regardless of the dopant concentrations while excited at 808 nm, show three main peaks assigned to the: 3H4 → 3F4 (1.45 μm) and 3F4 → 3H6 (1.8 μm) electronic transitions of Tm3+ and 5I7 → 5I8 (1.96 μm) electronic transition of Ho3+.29 The mechanisms of generation of these bands are depicted in Fig. 4. Tm3+ absorbs a photon at 808 nm and promotes its electrons from the 3H6 ground state to the 3H4 excited state. The electrons decay radiatively to the 3F4 manifold, generating the emission line at 1.45 μm. From the 3F4 level to the 3H6 ground state, the emission line at 1.8 μm is generated. Tm3+ ions undergo cross-relaxation (CR) process into the 3F4 excited state, when one of the ions is initially excited into the upper 3H4 excited state and then it relaxes non-radiatively to the 3F4 level while this energy is used to promote an electron in the 3H6 ground state to the 3F4 level, due to the energy resonance between these two processes. Also, due to the energy resonance between the 3F4 level of Tm3+ and the 5I7 level of Ho3+, an energy transfer (ET) and a back energy transfer (BET) process might take place, promoting the electrons of Ho3+ to this excited state from the ground state. Then, the electrons of Ho3+ relax radiatively to the 5I8 ground state, giving rise to the emission band at 1.96 μm.29These SWIR emissions of the Ho,Tm:KLuW nanocrystals with 1, 3, 5, 7.5, 10, 15 at% concentrations of Ho, and 5, 10, 20 at% concentration of Tm, recorded by exciting the nanoparticles with the 808 nm laser and 200 mW of power, are shown in Fig. 5(a) and (b). When the concentration of Ho3+ was kept constant at 1 at% and the concentration of Tm3+ increased from 5 to 20 at% (Fig. 5(a)), the intensities of the bands at 1.45 μm and 1.96 μm decreased, while the peak at 1.8 μm increased until reaching saturation. By increasing the amount of Tm3+, the cross relaxation (CR) process is promoted, favoring the electronic population of the 3F4 level versus the 4H4 level in the same ion. This would explain why the intensity of the 1.45 μm band decreased, while that of the 1.8 μm band increased when the Tm3+ concentration increased until a value of 10 at% of Tm3+. The intensity of this emission seems not increase further for higher Tm3+ concentrations, as can be seen for the sample containing 20 at% of Tm3+. This fact could be related to the appearance of some concentration quenching effects. In fact, in the bulk crystal singly doped with Tm3+, the concentration quenching effect for the emission located at 1.8 μm (indicated by the decrease of the measured lifetime) has been already observed at doping levels of 5 at% of Tm3+.30 This migration of energy among the Tm3+ ions could also contribute to the decrease observed in the intensity of the 1.45 μm emission. Also, the increase of the Tm/Ho concentration ratio will shift the electronic population balance between the 3F4 level of Tm3+ and the 5I7 level of Ho3+ towards the Tm3+ level (i.e. favoring the BET versus ET process35) favoring the emission located at 1.8 μm versus that located at 1.9 μm.
When the concentration of Tm3+ was kept constant at 5 at%, the intensity of the Tm3+ bands (1.45 μm and 1.8 μm) increased as the concentration of Ho3+ increased from 1 at% to 3 at%, but then decreased as the Ho3+ concentration increased from 3 to 15 at% (Fig. 5(b)). For the 1.96 μm emission band of Ho3+ from its side, it may be observed that its maximum of intensity can be seen for the sample containing 3 at% of Ho3+, and it decreases as the Ho3+ concentration increases. However, for the sample containing a 10 at% of Ho3+ an increase of intensity is observed again, without having a clear reason that could explain this behavior, since for higher Ho3+ concentration a clear concentration quenching effect is observed.
So, from these figures, it can be deduced that the sample with concentrations of Ho3+ 3 at% and of Tm3+ of 5 at% shows, in the three emission bands simultaneously, the maximum intensity that allows its further applications for luminescent thermometry.
3.3. Luminescent thermometric characterizations
We studied the temperature dependence of the intensity of the emission bands generated by KLu1−x−yHoxTmy(WO4)2 nanocrystals after pumping at 808 nm in the physiological range of temperatures between 293 K and 333 K. In general, as the temperature increases, the intensity of the emissions decreases. This behavior is related to the thermal activation of the luminescence quenching mechanisms, such as the increase of the non-radiative decay rates.20Fig. 6(a) shows the evolution of the intensity of the three bands when the temperature is gradually increased from room temperature to 333 K, taking as an example the KLu0.92Ho0.03Tm0.05(WO4)2 nanocrystals.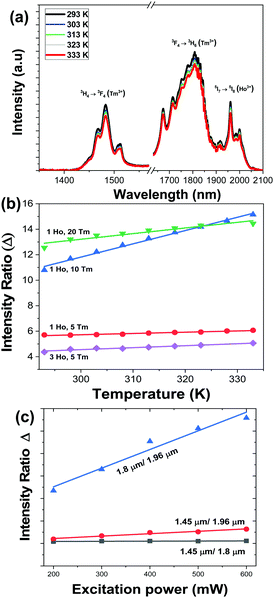 | ||
| Fig. 6 (a) Temperature dependence of the intensity of the SWIR emissions of the KLu0.92Ho0.03Tm0.05(WO4)2 nanocrystals excited at 808 nm. Please note that the part of the graph from 1580 nm to 1630 nm was removed due to the presence of the second harmonic of the 808 nm laser source. (b) Temperature dependence of the intensity ratio Δ (experimental data and linear fitting according to eqn (2) for 1.8 μm/1.96 μm for different Ho,Tm:KLu(WO4)2 nanocrystals with different Ho3+ and Tm3+ concentrations). (c) Variation of the intensity ratio Δ, calculated for the KLu0.89Ho0.01Tm0.1(WO4)2 sample, with the excitation power. | ||
To determine the luminescence thermometric performance of our nanocrystals, we calculated four different parameters: (i) the integrated intensity ratio (Δ = Ii/Ij, being Ii and Ij the integrated intensities of two of the three bands observed, defined as the thermometric parameter); (ii) the absolute thermal sensitivity (Sabs); (iii) the relative thermal sensitivity (Srel); and (iv) the temperature uncertainty (δT), which will be described later.
We calculated the evolution of the thermometric parameter Δ by using the ratio between the integrated intensity area of the emission bands centered at 1.45 μm versus 1.8 μm, 1.45 μm versus 1.96 μm, and 1.8 μm versus 1.96 μm. In general, we observed that Δ doesn’t show a significant temperature dependence (see Fig. S2 at ESI†), excluding the ratio between the 1.8 μm versus 1.96 μm for the KLu0.85Ho0.1Tm0.05(WO4)2, KLu0.92Ho0.03Tm0.05(WO4)2, KLu0.89Ho0.01Tm0.1(WO4)2, KLu0.79Ho0.01Tm0.2(WO4)2 samples, in which Δ changes significantly with the increase of the temperature, as presented in Fig. 6(b). In general, the intensity ratio between the 1.8 μm versus the 1.96 μm emission bands, compared to the other two ratios, was more influenced by the temperature changes.
The temperature dependence of Δ, can be modelled by following the approach reported by Brites et al. for dual center emission lanthanide based thermometers.36 This model is based on the fact that the total transition probability of an emitting level is the sum of the radiative and non-radiative transition probabilities37 and relating the integrated luminescence intensity to the inverse of the total transition probability,38 the temperature dependence of the intensity ratio can be expressed by:
 | (1) |
If the exponential term dominates in the intensities of the transitions involved, as it is our case, and assuming a single deactivation channel (1 ≪ αi![[thin space (1/6-em)]](https://www.rsc.org/images/entities/char_2009.gif) exp(−ΔEi/kBT)), eqn (1) could be transformed into:
exp(−ΔEi/kBT)), eqn (1) could be transformed into:
 | (2) |
 is an empirical constant to be determined by fitting and
  is the energy difference between the two activation energies for the thermally quenched processes, while kB is the Boltzmann constant expressed in cm−1 (kB = 0.695 cm−1).
By fitting eqn (2) to the experimental emission-temperature dependence for each sample (shown in Fig. 6(b)), we estimated the values of B and C. The results are summarized in Table 1.
| Sample (intensity ratio considered) | B | C | ΔE1 − ΔE2 (cm−1) | R 2 | S abs (K−1) 293 K | S rel (% K−1) 293 K | δT (K) 293 K |
|---|---|---|---|---|---|---|---|
| 1 at% Ho, 10 at% Tm (1.45 μm/1.96 μm) | 4.4 | 773 | 537 | 0.99 | 0.0027 | 0.90 | 0.55 |
| 1 at% Ho, 5 at% Tm (1.8 μm/1.96 μm) | 9.9 | 165 | 114 | 0.95 | 0.011 | 0.19 | 2.62 |
| 3 at% Ho, 5 at% Tm (1.8 μm/1.96 μm) | 13 | 318 | 221 | 0.95 | 0.016 | 0.37 | 1.34 |
| 1 at% Ho, 10 at% Tm (1.8 μm/1.96 μm) | 155 | 773 | 537 | 0.99 | 0.097 | 0.90 | 0.55 |
| 1 at% Ho, 20 at% Tm (1.8 μm/1.96 μm) | 37 | 313 | 218 | 0.92 | 0.046 | 0.37 | 1.36 |
We also determined the variation of the integrated intensity ratio with the excitation power, since it is a very important point when envisaging the application of these luminescent nanothermometers in biomedical fields. Fig. 6(c) shows that the relationship between the integrated intensity ratio and the excitation power can be assimilated to be linear for the three different intensity ratios considered in this work concerning the 1.45 μm, the 1.8 μm and the 1.96 μm emissions, calculated for the KLu0.89Ho0.01Tm0.1(WO4)2 sample. As can be seen in the figure, the intensity ratio that exhibits the highest change, and that also deviates the most from the linear behavior is the ratio between the emissions located at 1.8 μm and 1.96 μm. This is important, since during biological application there is no real control on the power actually reaching the nanoparticles, and this might become a source of inaccuracy. Thus, having a linear relationship, this inaccuracy source is minimized.
By using eqn (2) and the calculated values of the constants B and C for each Ho,Tm:KLuW nanocrystals, we can estimate the thermometric performance of our nanocrystals by calculating the absolute thermal sensitivity Sabs and the relative thermal sensitivity Srel. The absolute thermal sensitivity was introduced by dos Santos et al.39 and it is expressed by:
 | (3) |
Usually Srel is used as a figure of merit to compare the performance of different thermometers, independently of their nature, whereas Sabs cannot be used to compare the performance of different luminescent thermometers because it depends on the experimental setup and characteristics of the sample such as the absorption and lifetimes.36
The relative thermal sensitivity expresses the maximum change in the intensity ratio Δ for each temperature degree and it is defined, according to Brites et al. by:36
 | (4) |
 | (5) |
Besides Srel, the temperature resolution δT is also another parameter to determine the thermometer's performance. The temperature resolution is defined as the smallest temperature change that can be resolved in a given measurement and it is estimated according to Brites et al.:36
 | (6) |
Fig. 7(a)–(c) and Table 1 give the values of Sabs, Srel and δT and all the fitting parameters for the selected nanocrystals operating in the SWIR regime. The maximum Srel for the 1.8 μm/1.96 μm of all the synthesized nanocrystals are shown in Fig. S3 and Table S1 in the ESI.†
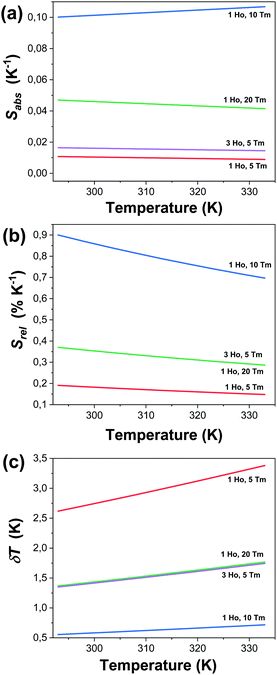 | ||
| Fig. 7 Determination of the: (a) absolute thermal sensitivity (Sabs), (b) relative thermal sensitivity (Srel), and (c) temperature resolution (δT) for selected Ho,Tm:KLuW nanocrystals. | ||
KLu0.89Ho0.01Tm0.1(WO4)2 nanocrystals showed the highest relative thermal sensitivity reported so far in the literature for the SWIR regime, with a value of 0.90% and the smallest temperature resolution of 0.55 K at 293 K. For this sample, the highest Srel = 0.90% K−1 at 293 K decreased to 0.70% K−1 when the temperature increased up to 333 K, while δT increased to 0.72 K. Thus, they are excellent thermal probes to operate in the biological range of temperatures, with temperature resolutions always below one degree.
Another interesting observation is that Srel calculated for the same sample, considering Δ calculated with the two integrated intensity ratios 1.45 μm/1.96 μm and 1.8 μm/1.96 μm, gives the same value. This is due to the fact that Srel is calculated by using the ΔE1 − ΔE2 obtained from the fitting, which was the same in both cases (see Table 1), and it is related to the difference of energy of the two thermal activation energy values for the non-radiative quenching process related to each emission. Pandey et al.40 assumed that this difference of energy can be correlated to the energy gap between the two emitting levels of the two transitions used to calculate the intensity ratio (despite they are non-thermally coupled levels), so, in parallel, we can assume that this difference of energy, 537 cm−1, corresponds to the energy gap between the levels 5I7 of Ho3+ and 3F4 of Tm3+. The reported value of this energy gap in Ho,Tm:KLuW bulk single crystals is 660 cm−1,41 close to the one determined by our fitting. The electronic population equilibrium between these two resonant emitting levels determines the thermometric behavior of our samples. Our hypothesis is that the electronic populations of the two emitting levels of Tm3+ are linked by the efficient cross relaxation (CR) process 3H4,3H6 → 3F4,3F4 thus favoring the occupation of the 3F4 level, and the corresponding energy transfer (ET) and back-energy transfer (BET) processes with the 5I7 level of Ho3+, marked as dashed arrows in Fig. 4. Thus, apparently, the thermal sensing performance of our nanocrystals is governed by these energy transfer and back transfer processes, and this is why Srel is the same in these two cases.
The reason why the nanocrystals with a doping level of 1 at% Ho and 20 at% Tm or 3 at% Ho and 5 at% Tm exhibit lower experimental values of ΔE1 − ΔE2 might be related to the fact that other thermally activated processes such as diffusion among lanthanide (Ln3+) ions are happening, and also multiphonon non-radiative decays might become more important, thus affecting the electronic population balance between the 3F4 and 5I7 levels.
As described in the eqn (3) and (6), the values of Srel and δT are calculated directly from the (ΔE1 − ΔE2) obtained by the fitting, so the variation of the temperature resolution for the different samples follows the same trend that the thermal relative sensitivity.
Table 2 compares the performance of different lanthanide based luminescent thermometers operating in the SWIR region. As can be seen Ho,Tm:KLuW nanocrystals exhibit the highest Srel reported up to now, indicating that they would allow for the smallest temperature resolution when used as thermal probes. We also demonstrated that by optimizing the concentration of dopants in the nanocrystals, Srel can be increased by 50%, when compared to previous reported values for the same material.42
| Material | ΔT (K) | λ exc (nm) | λ em (nm) | Transitions | Δ | S rel (% K−1) | Ref. |
|---|---|---|---|---|---|---|---|
| KLu0.89Ho0.01Tm0.1(WO4)2 | 293–333 | 808 | 1450 | 3H4 → 3F4 | I1450/I1960 | 0.90 | This work |
| 1800 | 3F4 → 3H6 | I1800/I1960 | |||||
| 1960 | 5I7 → 5I8 | ||||||
| KLu0.975Ho0.01Tm0.015(WO4)2 | 293–333 | 808 | 1480 | 3H4 → 3F4 | I1480/I1780 | 0.61 | 42 |
| 1780 | 3F4 → 3H6 | ||||||
| Tm,Yb:NaYF4 | 298–333 | 980 | 1470 | 3H4 → 3F4 | I1470/I1740 | 0.6 | 42 |
| 1740 | 3F4 → 3H6 | ||||||
| Tm,Yb,Ho:KLu(WO4)2 | 298–333 | 980 | 1480 | 3H4 → 3F4 | I1480/I1780 | 0.57 | 42 |
| 1780 | 3F4 → 3H6 | ||||||
| Er,Yb:LuVO4 | 298–523 | 980 | 1637 | 4I13/2 → 4I15/2 | I1637/I1660 | 0.54 | 43 |
| 1660 | |||||||
| Tm,Yb,Ho:KLu(WO4)2 | 298–333 | 980 | 1780 | 3F4 → 3H6 | I1780/I1960 | 0.45 | 42 |
| 1960 | 5I7 → 5I8 | ||||||
| Tm,Yb:KLu(WO4)2 | 298–333 | 980 | 1480 | 3H4 → 3F4 | I1480/I1780 | 0.22 | 42 |
| 1780 | 3F4 → 3H6 | ||||||
| Er,Yb:LuVO4@SiO2 | 298–523 | 915 | 1496, 1527 | 4I13/2 → 4I15/2 | I1496/I1527 | 0.18 | 44 |
| Er,Yb:NaY2F5O | 298–333 | 980 | 1535, 1554 | 4I13/2 → 4I15/2 | I1535/I1554 | 0.15 | 42 |
| Er,Yb:KLu(WO4)2 | 298–333 | 980 | 1535, 1553 | 4I13/2 → 4I15/2 | I1535/I1553 | 0.095 | 42 |
| Er,Yb:Lu2O3 | 298–333 | 980 | 1535, 1556 | 4I13/2 → 4I15/2 | I1535/I1556 | 0.09 | 42 |
| Er,Yb:NaYF4 | 298–333 | 980 | 1535, 1554 | 4I13/2 → 4I15/2 | I1535/I1554 | 0.06 | 42 |
3.4. Photothermal conversion efficiency
To determine the photothermal conversion efficiency, i.e. the ability of our nanocrystals to convert the absorbed light into heat, we used the integrating sphere method.21,32In this method, the photothermal conversion efficiency (η) is calculated from the following expression:
 | (7) |
The photothermal conversion efficiency for all synthesized samples is reported in Table S1 of the ESI.† The KLu0.94Ho0.01Tm0.05(WO4)2 and KLu0.89Ho0.01Tm0.1(WO4)2 nanocrystals exhibited the highest photothermal conversion efficiency, with values of 38 ± 3% and 40 ± 2%, respectively. These results are in agreement with the ones obtained previously from Savchuk et al. for the photothermal conversion efficiency of KLu0.84Ho0.01Tm0.15(WO4)2 nanocrystals.21 The photothermal conversion is favored by the increase of probability of multiphonon decay transitions to happen and also to the appearance of some quenching processes due to impurities attached to the surface of the nanocrystals.45 The increase of concentration of the active lanthanide ion is usually related to the increase of the probability of these mentioned processes to happen.46Fig. 8 shows the efficiency of the photothermal conversion versus the concentration ratio of Ho3+/(Ho3+ + Tm3+). As shown in the figure, there is a tendency to increase the photothermal conversion in our nanocrystals when the Ho3+ doping versus the total doping concentrations is decreased, so this could be related with the fact that the main deactivation non radiative channels are present in the Tm3+ ions, as shown in Fig. 4. However, Tm3+ ions are not only responsible for this behavior. In fact, when plotting the efficiency of the photothermal conversion versus the Tm3+ concentration, no apparent tendency is observed (see Fig. S4 in the ESI†). From these results it is evident that the energy transfer processes between Tm3+ and Ho3+, and the energy difference between the 3F4 level of Tm3+ and the 5I7 electronic level of Ho3+ are responsible for the photothermal conversion of these nanocrystals.
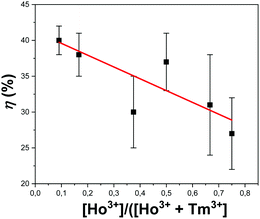 | ||
| Fig. 8 Variation of photothermal conversion efficiency with the concentration ratio of Ho3+versus all doping ions. The red line is included as an eye guide for the reader. | ||
Additionally, we measured the dependence of the photothermal conversion efficiency with the power of the excitation source for the KLu0.89Ho0.01Tm0.1(WO4)2 sample, excited at 808 nm. η shows no change when the pumping power is changed (see Fig. S5 in the ESI†).
Table 3 shows a comparison of the values of the photothermal conversion efficiency of different materials in which this property has been analyzed, together with the method used for the determination of η, and the excitation wavelengths used.
| Material | Method | λ exc (nm) | η (%) | Ref. |
|---|---|---|---|---|
| Au nanostars | Double beam fluorescence thermometry | 808 | 102 | 47 |
| Au nanorods | Double beam fluorescence thermometry | 808 | 95 | 47 |
| NaNdF4@NaYF4@Nd:NaYF4 | Thermal relaxation | 808 | 72.7 | 48 |
| NdVO4 in water | Thermal relaxation | 808 | 72.1 | 49 |
| Au nanoshells | Double beam fluorescence thermometry | 808 | 68 | 47 |
| Graphene in DMF | Integrating sphere | 808 | 67 | 32 |
| Au nanorods | Double beam fluorescence thermometry | 808 | 63 | 47 |
| Au nanorods | Thermal relaxation | 815 | 61 | 50 |
| Au/AuS nanoshells | Thermal relaxation | 815 | 59 | 50 |
| Graphene oxide in water | Integrating sphere | 808 | 58 | 32 |
| Ho,Tm:KLu(WO4)2 | Integrating sphere | 808 | 40 | This work |
| Au/SiO2 nanoshells | Thermal relaxation | 815 | 34 | 50 |
| FePt nanoparticles |
P
converted![[thin space (1/6-em)]](https://www.rsc.org/images/entities/char_2009.gif) to to![[thin space (1/6-em)]](https://www.rsc.org/images/entities/char_2009.gif) heat/Pexcitation heat/Pexcitation |
800 | 30 | 51 |
| Cu9S5 | Thermal relaxation | 980 | 25.7 | 52 |
| Au nanoshells | Thermal relaxation | 808 | 25 | 53 |
Ho,Tm:KLu(WO4)2 nanocrystals show a lower photothermal conversion efficiency values when compared to others Ln3+ doped systems such as NaNdF4@NaYF4@Nd:NaYF4,48 and NdVO4 nanoparticles,49 and also graphene materials,32 and gold nanostructures,47,50 as can be seen in Table 2. However, they exhibit a higher photothermal conversion efficiency than other metallic and semiconductor nanocrystals also reported as photothermal agents, as they are also listed in Table 2.
3.5. Self-assessed nanocrystals: proof of concept
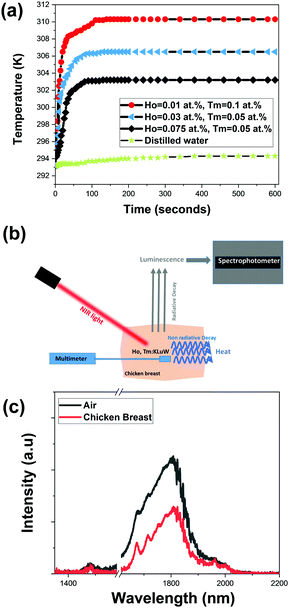
However, the main benefit of using Ho,Tm:KLu(WO4)2 nanocrystals as photothermal conversion agents compared to other types of materials is the ability to self-determine the temperature reached by the system, through luminescence thermometry, generating self-assessed photothermal agents. It should be noted here that although NaNdF4@NaYF4@Nd:NaYF448 and NdVO449 nanoparticles should have the same potentiality, the reading of temperature in these cases has been done using an external thermal probe and not by using the emissions generated by the nanoparticles. Even, Rocha et al.,54 that reported Nd3+-doped LaF3 as self-monitored photothermal agents, compared only the temperature measured at the surface of the biological tissue with the temperature determined by the nanoparticles inside the tissue, without validating this last temperature with an external thermal probe.To proof the self-assessed ability of our nanocrystals, we prepare a dispersion of the nanocrystals in distilled water using a concentration of 1 g L−1. This water dispersion was used to fill a glass vial, inside of which we introduced a Pt–Pt/Rh thermocouple to monitor the temperature, at the same time that the dispersion was excited at 808 nm with a power of 0.2 W and a beam spot diameter of 10 μm on the external surface of the vial, and its photoluminescence spectrum was recorded.
Fig. 9(a) shows the temperature evolution in the water dispersion achieved by different Ho,Tm:KLu(WO4)2 nanoparticles with different doping concentrations. Also, the temperature reached in pure distilled water is included in the figure for comparison. When comparing with the water only behavior, it can be affirmed that mainly the temperature increase is attributed to the light-to-heat conversion of the nanocrystals. The general tendency observed is a fast increase in the temperature in the first 25–30 s and then a more slow tendency until reaching a saturation temperature after around 100 s.
The three selected samples KLu0.89Ho0.01Tm0.1(WO4)2 (high η), KLu0.92Ho0.03Tm0.05(WO4)2 (medium η) and KLu0.875Ho0.075Tm0.05(WO4)2 (low η), achieve an increase of temperature of 17 K, 13.5 K and 10 K, respectively. As expected, the sample with the highest photothermal conversion efficiency (KLu0.89Ho0.01Tm0.1(WO4)2) shows the highest temperature increase. Thus, to prove the concept of the self-assessed photothermal agents in real biological samples in an ex vivo experiment, we selected this sample.
For the ex vivo experiment, the measurement scheme-methodology applied for the temperature determination was adapted from a previous article from our group with slight modifications, as is shown in Fig. 9(b).55 For that a piece of chicken breast meat was cut in two pieces. On the top of the first piece, a small amount of KLu0.89Ho0.01Tm0.1(WO4)2 luminescent nanoparticles were deposited. Close to the nanoparticles, a thermocouple was located also on this piece of chicken breast. Then, the second piece of chicken breast, 2 mm thick, was placed on the top of these nanoparticles, covering both the luminescent nanoparticles and the thermocouple, so that the nanoparticles (and the reference thermocouple, of course) are wrapped by the same medium in all directions. The KLu0.89Ho0.01Tm0.1(WO4)2 nanoparticles where then illuminated with the 808 nm laser with a power of 200 mW and a spot size of 10 μm on the surface of the chicken breast. The power of the excitation laser beam was set to the maximum value that the chicken breast can hold showing no degradation or burning on its surface. This laser beam crossed the chicken breast piece of meat before exciting the luminescent nanoparticles. Finally, the spectrum generated by the luminescent nanoparticles was recorded from the exterior of the chicken breast piece of meat. This spectrum was recorded when, according to Fig. 9(a) and Fig. S7 in the ESI,† the temperature was stabilized. Furthermore, we confirmed that the temperature was not fluctuating any longer through the reading of the temperature performed with the thermocouple located close to the nanoparticles. With this spectrum we extracted the thermometric parameter Δ, and by comparing its value against the calibration curve shown in Fig. 6(b) and its expression according to eqn (2), we determined the temperature inside the chicken breast piece of meat. This temperature was compared with the one measured by the thermocouple located close to the nanoparticles.
The SWIR emission of our nanocrystals transmitted through the 2 mm chicken breast is shown in Fig. 9(c), together with the spectrum of the same nanoparticles not covered by the chicken breast piece of meat, to show the attenuation of the signal caused by the biological tissue. This was the maximum thickness that allowed us to record a spectra with appropriate intensities ratios among the three emission bands in order to determine the temperature. It is worth to mention that the excitation beam is also going through the chicken piece of meat so the level of laser power reaching the nanocrystals has also been reduced by the scattering and absorption of the tissue (the transmittance of the chicken breast is shown in Fig. S6 at ESI†).
We determined the 1.8 μm/1.96 μm thermometric parameter from the spectrum recorded and shown in Fig. 9(c), and then, by using the calibration curve shown in Fig. 6(b) and its mathematical expression according to eqn (2), we calculated a temperature of 312.8 K. The thermocouple, from its side, indicated a temperature value of 312 K (the graph of temperature evolution with time in that case is shown in Fig. S7, ESI†). Thus, the difference between the temperature determined with the emission of our nanocrystals and that of the thermocouple is 0.8 K. This difference might be assigned to the different thermal conductivity of our nanoparticles (dielectric material) and that of the thermocouple (metal). Another possibility for this difference might be that the calibration of the luminescent thermometer has been done in air, and not directly inside the chicken breast, thus, the medium in which the nanoparticles are embedded can also affect to the determination of temperature by luminescence means. A solution to avoid this problem would be to perform a recalibration of the thermometer in the new medium.56 Another possibility is determining the relationship between the intensity ratio and the excitation power inside of the new medium and adjust the B parameter in eqn (2), as suggested by Quintanilla et al.57 However, up to the moment this approach has been proved to be effective only for single center emitting luminescent thermometers, in which the emissions considered to calculate the thermometric parameter are generated only by the same lanthanide ion. Still, another possibility is generating a primary thermometer with these luminescence nanoparticles, as pointed out by Balabhadra et al.58 However, again, all the theory developed to generate these primary thermometers concerns only single center emitting luminescent thermometers. In our case, however, we assessed the temperature determined by the luminescent thermometer by comparing it with the temperature read with a thermocouple. Obviously, for practical applications in the future, the thermocouple should be removed, and any one of the solutions proposed to mitigate the differences between the temperature determined by the luminescent thermometer and the thermocouple should be applied. Despite of this, we consider that with the approach presented in the present manuscript we demonstrated that Ho,Tm:KLuW nanoparticles can be used as self-assessed photothermal conversion agents.
4. Conclusions
Monoclinic KLu1−x−yHoxTmy(WO4)2 nanocrystals synthesized via the modified sol–gel Pechini method were analyzed as candidates for luminescence nanothermometers in the SWIR region. Exciting the KLu1−x−yHoxTmy(WO4)2 nanocrystals with a 808 nm laser diode, produced three emission peaks located at 1.45 μm, 1.8 μm and 1.96 μm attributed to the 3H4 → 3F4, 3F4 → 3H6 transitions of Tm3+ and the 5I7 → 5I8 transition of Ho3+, respectively. The emission intensity ratio between 1.45 μm/1.96 μm or 1.8 μm/1.96 μm produced the highest relative thermal sensitivity Srel reported so far in the SWIR region, reaching a value of 0.90% K−1 at 293 K and a temperature resolution δT of 0.55 K for the KLu0.89Ho0.01Tm0.1(WO4)2 nanocrystals. The ability to convert light into heat for these nanocrystals was also analyzed, achieving a photothermal conversion efficiency on the range of 40 ± 2% for the same nanocrystals. We probed that these nanocrystals can be used as self-assessed photothermal agents: the same nanoparticle releases heat that will increase the temperature of the environment in which it is embedded, and emits light that allows determining the temperature in situ without the addition of an external thermal probe.Despite the penetration depth at which this probe of concept could be performed was restricted to 2 mm in the present experiments to avoid damages in the biological tissues, it has been probed that the SWIR region, or third biological window, is the most suitable one for deep tissue imaging.27 In this spectral region the penetration power of light is higher than the one that can be achieved in the second biological windows, and much higher than the one that can be achieved in the first biological window. In fact, by an appropriate dispersion of the nanoparticles in biological compatible fluids, a penetration depth of 1 cm has been demonstrated when operating in the second biological window.59 Thus, we are convinced that by optimizing the measurement conditions similar or higher penetration depths can be achieved for this kind of self-assessed photothermal agents.
Conflicts of interest
There are no conflicts to declare.Acknowledgements
This work was supported by the Spanish Government under project MAT2016-75716-C2-1-R (AEI/FEDER, UE) and by the Generalitat de Catalunya under project 2017SGR755. A. N. acknowledges financial support from the Generalitat de Catalunya under grant 2017FI_B00620, 2018FI_B100161 and 2019FI_B2 00154.References
- D. Jaque, L. Martínez Maestro, B. del Rosal, P. Haro-Gonzalez, A. Benayas, J. L. Plaza, E. Martín Rodríguez and J. García Solé, Nanoscale, 2014, 6, 9494–9530 RSC.
- E. S. Day, J. G. Morton and J. L. West, J. Biomech. Eng., 2009, 131, 074001 CrossRef.
- J. Key and K. Park, Int. J. Mol. Sci., 2017, 18, 594 CrossRef.
- D. A. Giljohann, D. S. Seferos, W. L. Daniel, M. D. Massich, P. C. Patel and C. A. Mirkin, Angew. Chem., Int. Ed., 2010, 49, 3280–3294 CrossRef CAS PubMed.
- P. K. Jain, X. Huang, I. H. El-Sayed and M. A. El-Sayed, Acc. Chem. Res., 2008, 41, 1578–1586 CrossRef CAS PubMed.
- A. M. Alkilany, L. B. Thompson, S. P. Boulos, P. N. Sisco and C. J. Murphy, Adv. Drug Delivery Rev., 2012, 64, 190–199 CrossRef CAS PubMed.
- L. C. Kennedy, L. R. Bickford, N. A. Lewinski, A. J. Coughlin, Y. Hu, E. S. Day, J. L. West and R. A. Drezek, Small, 2011, 7, 169–183 CrossRef CAS.
- G. von Maltzahn, J.-H. Park, A. Agrawal, N. K. Bandaru, S. K. Das, M. J. Sailor and S. N. Bhatia, Cancer Res., 2009, 69, 3892–3900 CrossRef CAS.
- C. Loo, A. Lowery, N. Halas, J. West and R. Drezek, Nano Lett., 2005, 5, 709–711 CrossRef CAS.
- S. E. Skrabalak, L. Au, X. Lu, X. Li and Y. Xia, Nanomedicine, 2007, 2, 657–668 CrossRef CAS.
- J. Z. Zhang, J. Phys. Chem. Lett., 2010, 1, 686–695 CrossRef CAS.
- K. Yang, L. Feng, X. Shi and Z. Liu, Chem. Soc. Rev., 2013, 42, 530–547 RSC.
- X. Huang, S. Tang, X. Mu, Y. Dai, G. Chen, Z. Zhou, F. Ruan, Z. Yang and N. Zheng, Nat. Nanotechnol., 2011, 6, 28–32 CrossRef CAS PubMed.
- Q. Tian, M. Tang, Y. Sun, R. Zou, Z. Chen, M. Zhu, S. Yang, J. Wang, J. Wang and J. Hu, Adv. Mater., 2011, 23, 3542–3547 CrossRef CAS.
- L. Cheng, K. Yang, Q. Chen and Z. Liu, ACS Nano, 2012, 6, 5605–5613 CrossRef CAS.
- B. del Rosal, E. Carrasco, F. Ren, A. Benayas, F. Vetrone, F. Sanz-Rodríguez, D. Ma, Á. Juarranz and D. Jaque, Adv. Funct. Mater., 2016, 26, 6060–6068 CrossRef CAS.
- M. Quintanilla and L. M. Liz-Marzán, Nano Today, 2018, 19, 126–145 CrossRef CAS.
- X. Chen, Q. Xia, Y. Cao, Q. Min, J. Zhang, Z. Chen, H.-Y. Chen and J.-J. Zhu, Nat. Commun., 2017, 8, 1498 CrossRef.
- Z. Li, A. Lopez-Ortega, A. Aranda-Ramos, J. L. Tajada, J. Sort, C. Nogues, P. Vavassori, J. Nogues and B. Sepulveda, Small, 2018, 14, 1800868 CrossRef.
- L. A. Riseberg and H. W. Moos, Phys. Rev., 1968, 174, 429–438 CrossRef CAS.
- O. A. Savchuk, J. J. Carvajal, C. D. S. Brites, L. D. Carlos, M. Aguilo and F. Diaz, Nanoscale, 2018, 10, 6602–6610 RSC.
- A. Bednarkiewicz, D. Wawrzynczyk, M. Nyk and W. J. A. P. B. Strek, Appl. Phys. B: Lasers Opt., 2011, 103, 847–852 CrossRef CAS.
- H. Suo, X. Zhao, Z. Zhang and C. Guo, ACS Appl. Mater. Interfaces, 2017, 9, 43438–43448 CrossRef CAS.
- E. Carrasco, B. del Rosal, F. Sanz-Rodríguez, Á. J. de la Fuente, P. H. Gonzalez, U. Rocha, K. U. Kumar, C. Jacinto, J. G. Solé and D. Jaque, Adv. Funct. Mater., 2015, 25, 615–626 CrossRef CAS.
- R. Weissleder, Nat. Biotechnol., 2001, 19, 316–317 CrossRef CAS.
- E. Hemmer, A. Benayas, F. Légaré and F. Vetrone, Nanoscale Horiz., 2016, 1, 168–184 RSC.
- L. Shi, L. A. Sordillo, A. Rodríguez-Contreras and R. Alfano, J. Biophotonics, 2016, 9, 38–43 CrossRef CAS.
- D. J. Naczynski, M. C. Tan, M. Zevon, B. Wall, J. Kohl, A. Kulesa, S. Chen, C. M. Roth, R. E. Riman and P. V. Moghe, Nat. Commun., 2013, 4, 2199 CrossRef CAS.
- V. Jambunathan, X. Mateos, M. C. Pujol, J. J. Carvajal, J. Massons, M. Aguiló and F. Díaz, J. Lumin., 2009, 129, 1882–1885 CrossRef CAS.
- V. Petrov, M. Cinta Pujol, X. Mateos, Ò. Silvestre, S. Rivier, M. Aguiló, R. M. Solé, J. Liu, U. Griebner and F. Díaz, Laser Photonics Rev., 2007, 1, 179–212 CrossRef CAS.
- M. Galceran, M. Pujol, M. Aguiló and F. Díaz, J. Sol-Gel Sci. Technol., 2007, 42, 79–88 CrossRef CAS.
- O. A. Savchuk, J. J. Carvajal, J. Massons, M. Aguiló and F. Díaz, Carbon, 2016, 103, 134–141 CrossRef CAS.
- M. C. Pujol, A. Aznar, X. Mateos, X. Solans, J. Massons, S. Suriñach, F. Díaz and M. Aguiló, J. Appl. Crystallogr., 2006, 39, 230–236 CrossRef CAS.
- A. L. Patterson, Phys. Rev., 1939, 56, 978–982 CrossRef CAS.
- S. A. Payne, L. K. Smith, W. L. Kway, J. B. Tassano and W. F. Krupke, J. Phys.: Condens. Matter, 1992, 4, 8525–8542 CrossRef CAS.
- C. D. S. Brites, A. Millán and L. D. Carlos, in Handbook on the Physics and Chemistry of Rare Earths, ed. B. Jean-Claude and P. Vitalij K, Elsevier, 2016, vol. 49, pp. 339–427 Search PubMed.
- N. F. Mott, Proc. R. Soc. A, 1938, 167, 384–391 CrossRef.
- M. Duarte, E. Martins, S. L. Baldochi, N. D. Vieira and M. M. F. Vieira, Opt. Commun., 1999, 159, 221–224 CrossRef CAS.
- P. V. d. Santos, M. T. d. Araujo, A. S. Gouveia-Neto, J. A. M. Neto and A. S. B. Sombra, Appl. Phys. Lett., 1998, 73, 578–580 CrossRef.
- A. Pandey and V. Rai, Appl. Phys. B: Lasers Opt., 2013, 113 Search PubMed.
- V. Jambunathan, A. Schmidt, X. Mateos, M. C. Pujol, U. Griebner, V. Petrov, C. Zaldo, M. Aguiló and F. Díaz, J. Opt. Soc. Am. B, 2014, 31, 1415–1421 CrossRef CAS.
- O. A. Savchuk, J. J. Carvajal, P. Haro-Gonzalez, M. Aguiló and F. Díaz, J. Alloys Compd., 2018, 746, 710–719 CrossRef CAS.
- Y. Ma, G. Xiang, J. Zhang, Z. Liu, P. Zhou, W. Liu, X. Tang, S. Jiang, X. Zhou, L. Li, Y. Luo and Y. Jin, J. Alloys Compd., 2018, 769, 325–331 CrossRef CAS.
- G. Xiang, X. Liu, J. Zhang, Z. Liu, W. Liu, Y. Ma, S. Jiang, X. Tang, X. Zhou, L. Li and Y. Jin, Inorg. Chem., 2019, 58, 8245–8252 CrossRef PubMed.
- B. del Rosal, U. Rocha, E. C. Ximendes, E. Martín Rodríguez, D. Jaque and J. G. Solé, Opt. Mater., 2017, 63, 185–196 CrossRef CAS.
- I. E. Kolesnikov, A. A. Kalinichev, M. A. Kurochkin, D. V. Mamonova, E. Y. Kolesnikov, E. Lähderanta and M. D. Mikhailov, Nanotechnology, 2019, 30, 145501 CrossRef CAS.
- L. M. Maestro, P. Haro-González, A. Sánchez-Iglesias, L. M. Liz-Marzán, J. García Solé and D. Jaque, Langmuir, 2014, 30, 1650–1658 CrossRef CAS PubMed.
- L. Marciniak, A. Pilch, S. Arabasz, D. Jin and A. Bednarkiewicz, Nanoscale, 2017, 9, 8288–8297 RSC.
- B. del Rosal, A. Pérez-Delgado, E. Carrasco, D. J. Jovanović, M. D. Dramićanin, G. Dražić, Á. J. de la Fuente, F. Sanz-Rodriguez and D. Jaque, Adv. Opt. Mater., 2016, 4, 782–789 CrossRef CAS.
- J. R. Cole, N. A. Mirin, M. W. Knight, G. P. Goodrich and N. J. Halas, J. Phys. Chem. C, 2009, 113, 12090–12094 CrossRef CAS.
- C.-L. Chen, L.-R. Kuo, S.-Y. Lee, Y.-K. Hwu, S.-W. Chou, C.-C. Chen, F.-H. Chang, K.-H. Lin, D.-H. Tsai and Y.-Y. Chen, Biomaterials, 2013, 34, 1128–1134 CrossRef CAS PubMed.
- Q. Tian, F. Jiang, R. Zou, Q. Liu, Z. Chen, M. Zhu, S. Yang, J. Wang, J. Wang and J. Hu, ACS Nano, 2011, 5, 9761–9771 CrossRef CAS PubMed.
- V. P. Pattani and J. W. Tunnell, Lasers Surg. Med., 2012, 44, 675–684 CrossRef PubMed.
- U. Rocha, K. U. Kumar, C. Jacinto, J. Ramiro, A. J. Caamaño, J. G. Solé and D. Jaque, Appl. Phys. Lett., 2014, 104, 053703 CrossRef.
- O. A. Savchuk, J. J. Carvajal, C. Cascales, M. Aguiló and F. Díaz, ACS Appl. Mater. Interfaces, 2016, 8, 7266–7273 CrossRef CAS PubMed.
- A. S. Souza, L. A. O. Nunes, I. G. N. Silva, F. A. M. Oliveira, L. L. da Luz, H. F. Brito, M. C. F. C. Felinto, R. A. S. Ferreira, S. A. Júnior, L. D. Carlos and O. L. Malta, Nanoscale, 2016, 8, 5327–5333 RSC.
- M. Quintanilla, Y. Zhang and L. M. Liz-Marzán, Chem. Mater., 2018, 30, 2819–2828 CrossRef CAS.
- S. Balabhadra, M. L. Debasu, C. D. S. Brites, R. A. S. Ferreira and L. D. Carlos, J. Phys. Chem. C, 2017, 121, 13962–13968 CrossRef CAS.
- O. Savchuk, J. J. Carvajal, L. G. De la Cruz, P. Haro-González, M. Aguiló and F. Díaz, J. Mater. Chem. C, 2016, 4, 7397–7405 RSC.
Footnote |
| † Electronic supplementary information (ESI) available. See DOI: 10.1039/c9tc04228h |
| This journal is © The Royal Society of Chemistry 2020 |

