A cost-device efficiency balanced spiro based hole transport material for perovskite solar cells†
Received
12th January 2020
, Accepted 27th March 2020
First published on 30th March 2020
Abstract
Although spiro-MeOTAD 1 is a superior hole-transporting material (HTM) commonly employed in perovskite solar cells (PSC), its high cost is one of the major issues holding back commercialization, which has not been resolved to-date. In this article we introduce a new HTM comprising a cyclic spiro-backbone appended with four diphenylimidazole substituents, namely spiro-omethoxyimidazole, or spiro-OMeIm 2. When compared to the benchmark 1, introduction of the imidazole functionality into this versatile platform decreases the first oxidation potential from 0.6 V to 0.53 V, which approaches the energy of the HOMO of the perovskite light absorber. Studies on PSC devices fabricated from 2 reveal that the values of the short-circuit current (Jsc) and open-circuit voltage (Voc) are very similar to 1 and its power efficiency is 11.64 vs. 14.46% recorded for spiro-OMeTAD under the same conditions. Nevertheless, the commercial cost of synthesizing OMeIm is approximately 80% less than the synthetic precursors to the best spiro-OMeTAD derivatives reported to-date, which makes spiro-OMeIm less expensive to produce and therefore a very attractive HTM for the future development of low-cost PSCs.
Introduction
The phrase “the interface is the device” used by Herbert Kroemer in his Nobel laureate lecture1 exactly holds true for the operation of perovskite solar cells (PSCs). In fact, the actual breakthrough in the efficiency of PSCs was achieved when a light absorbing perovskite layer was sandwiched compatibly between the interface of electron transport (ET) and hole transport materials (ETM).2,3 This means that the most efficient PSC can be realized through the rational optimization of the interface between the ET layer, the perovskite and the hole transport layer (HTL).4,5 The most important ETL in a PSC is TiO2 or a close analogue thereof, whereas the molecular structures of organic compounds developed as HTMs are much more structurally diverse.6–8 In recent years, the discovery of the key role of HTMs in PSCs has resulted in a large unexpected leap forward in terms of their power conversion efficiencies (PCEs), which has also advanced the discovery of more efficient HTMs. In this respect, research initiatives in this field have focused on tuning the molecular structures of the HTMs so that the transfer of holes from the perovskite layer to the Au cathode is optimized.9 From these studies, it has become apparent that an ideal HTM should include the following: (i) a good energy match to the HOMO of the perovskite together with high mobility parameters;10 (ii) compatible solvents, i.e. the solvent of the HTM which is generally chlorobenzene should not interfere with the perovskite solvent that is typically DMF and (iii) the minimum of the molar absorption coefficient (ε) should be in the visible region of the spectrum and a marked decrease in photoluminescence quenching within the perovskite should be observed.11 Despite working to optimize these parameters, a major problem concerning the suitability of these materials for device applications is the high costs of their preparation. For example, the price associated with the preparation of spiro-OMeTAD 1, one of the best known HTMs is estimated to be about 92 US $ per g,12 which highlights the fact that the cost of the HTM is the most expensive component of a PSC. Although the introduction of new efficient, low-cost HTMs is now considered to be a mature field, research efforts are still underway to reach a good balance between device cost and efficiency.13 One of the major research goals therefore concerns the rational tuning of the molecular structures of HTMs to optimize the match between their HOMO energy levels and those of the perovskite. For example, the work of Seok et al. demonstrates that the best substitution position for a methoxy group in spiro-OMeTAD is on the two para positions of the diphenylamine substituents, when compared to the para–meta and para–ortho spiro-OMeTAD derivatives.14 The molecular structure of spiro-OMeTAD is shown in Fig. 1 and comprises of four diphenylamine substituents appended to a spiro-cyclic core. Although as previously mentioned, 1 is one of the most commonly used HTMs, the synthesis of its diphenylamine precursor is low yielding that requires the use of a Pd catalyst together with a number of purification steps.14
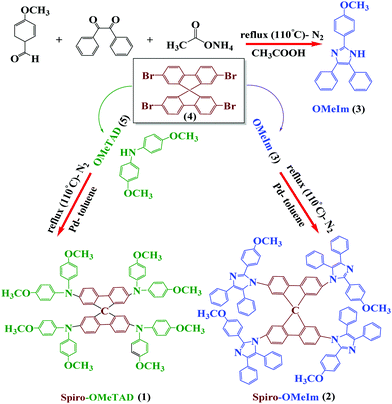 |
| | Fig. 1 Synthetic routes to spiro-OMeTAD 1 and spiro-OMeIm 2. | |
Imidazole compounds currently lend themselves to a broad range of biological and chemical applications that include anticancer agents,15 antibacterial activators,16 as well as for the development of catalysts for water splitting in photosynthesis II.17 With a view to developing more efficient light emissive compounds, imidazole derivatives have also been extensively employed in a range of photonic applications that include organic light-emitting diodes (LED's),18 light electrochemical cells (LECs)19,20 and dye-sensitized solar cells (DSSCs).21,22 In contrast however, they have not yet been used for the development of HTMs for optoelectronic applications that include PSCs. We report herein the synthesis and solar cell applications of a new HTM spiro-OMeIm 2, in which the four diphenylamine moieties in the gold standard, spiro-OMeTAD 1 are replaced with diphenyl imidazole substituents. The overall goal of this study is therefore to develop synthetic methodology for the rational synthesis of a new efficient, lower cost alternative to spiro-OMeTAD.
Results and discussion
The synthetic procedure for the preparation of spiro-OMeIm 2 comprises of the three steps as highlighted in Fig. 1.
The target imidazole precursor, 2-(4-methoxyphenyl)-4,5-diphenyl-1H-imidazole (OMeIm), 3 was prepared in 62% yield without the need for a catalyst or any time-consuming purification procedures, (Fig. 1, top). Spiro-OMeIm was then synthesized in 51% yield via the Buchwald–Hartwig amination reaction between 3 and commercially available 2,2′,7,7′-tetrabromo-9,9′-spirobifluorene 4. When compared to 1, the synthesis of the new imidazole derivative 2, is more efficient, synthetically facile and lower in cost, which makes it a very attractive compound for device fabrication. Consequently, the optoelectronic properties and thermal stability of 2 were initially probed by a range of methods that include UV-Vis spectroscopy, photoluminescence (PL), cyclic voltammetry (CV) and differential scanning calorimetry (DSC) and the data is summarized in Table 1.
Table 1 Summary of the optical, electrochemical and thermal properties for spiro-OMeTAD 1vs. spiro-OMeIm 2
| HTM |
Spiro-OMeTAD 1 |
Spiro-OMeIm 2 |
|
UV-Vis and photoluminescence spectra were measured in CHCl3.
CV measurements, 0.1 M chloroform/tetrabutylammonium perchlorate (TBAP) vs. Ag/AgCl at scan rate of 100 mV s−1. EHOMO = −(Eox (vs. Ag/AgCl) + 4.8 eV).
E
LUMO = EHOMO + E0–0.
η
quench = (PLbare − PLquench)/PLbare, where PLbare and PLquench are the integrated PL intensities of perovskite on sapphire substrates with and without the HTM layer, respectively.
Pristine state.
Doped state.
|
|
λ
max absa [nm] |
304, 378, 525 |
291, 320 (sh) |
|
λ
max Fa [nm] |
425 |
457 |
| HOMOb [eV] |
−5.21 |
−5.13 |
| LUMOb [eV] |
−2.18 |
−1.93 |
|
T
m
[°C] |
248 |
>350 |
|
η
quenching
|
0.89 |
0.87 |
| Hole mobilitye [cm2 V−1 s−1] |
2.5 × 10⁻⁵ |
1.6 × 10⁻⁵ |
| Hole mobilityf [cm2 V−1 s−1] |
3.1 × 10⁻⁴ |
2.2 × 10⁻⁴ |
The UV-Vis absorption and PL emission spectra of 1 and 2 in chloroform are shown in Fig. 2a. For spiro-OMeIm 2, two absorption bands are present at λmax = 291 and 320 nm (shoulder), assigned to the π–π* transitions of the π-electron system. Furthermore, the PL spectrum displays a maximum emission at λ = 457 nm. The intersection of the UV-Vis and PL spectra for both 1 and 2 were measured to estimate the energy of the lowest unoccupied molecular orbital (LUMO), Fig. 2a.
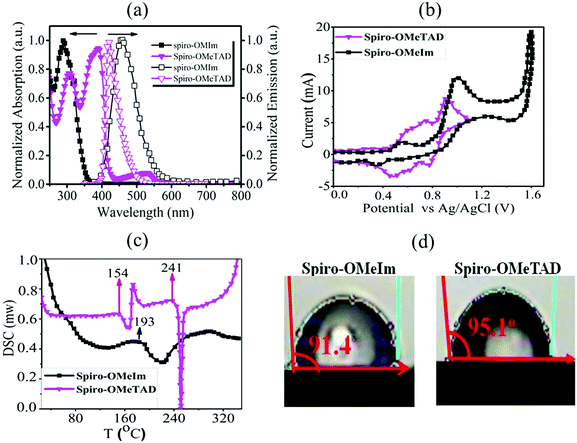 |
| | Fig. 2 (a) UV-Vis and photoluminescence spectra of spiro-OMeIm and spiro-OMeTADin CHCl3 (inset: the zoomed image of visible region of absorption spectra of spiro-OMeIm and spiro-OMeTAD); (b) cyclic voltammograms of spiro-OMeIm and spiro-OMeTAD; (c) differential scanning calorimetry of spiro-OMeIm and spiro-OMeTAD (the value in the image is related to glass transition temperature (Tg)); (d) contact angle of spiro-OMeIm and spiro-OMeTAD. | |
CV measurements (Fig. 2b) to investigate the electrochemical properties of spiro-OMeIm 2 were performed and energy levels were calculated based on the standard equations (eqn (3) and (4)) reported in the Experimental section.23 In this respect, the energy of the HOMO of 2 was calculated to be −5.33 eV from the potential of the first oxidation half-wave, Table 1. Comparing the electrochemical data for 1 and 2, it is apparent that the first oxidation half-wave of spiro-OMeIm is shifted to a lower potential i.e. from −0.6 V to −0.53 V when compared to spiro-OMeTAD 1, hence it is more easily oxidized to [spiro-OMeIm]+. Furthermore, the lower oxidation potential also results in a lower energy HOMO which makes it a better match to the valence band of the perovskite layer. We attribute this phenomenon to the extended π-system of the imidazole substituents over their diphenyl counterparts in spiro-OMeTAD. Fig. 2c shows differential scanning calorimetry (DSC) data for 1 and 2. The crystallization temperatures of spiro-OMeIm and spiro-OMeTAD are 193 °C and 154 °C respectively, confirming the enhanced stability of the new HTM. Furthermore, the melting point of spiro-OMeIm is 350 °C vs. 248 °C reported for spiro-OMeTAD24 and no obvious glass transition temperature (Tg) is observed, confirming that no amorphous phase is exhibited. This leads us to conclude that the overall thermal stability of spiro-OMeTAD is better than the benchmark spiro-OMeTAD. Contact angle measurements confirm that the hydrophobicity properties of the newly synthesized 2 are comparable with the best HTM materials reported to-date.25 The reported angles are an average of five individual measurements, and each measurement was made at t = 0 and 5 min from the water drop fall. Water contact angle tests for 2 reveals that spiro-OMeIm exhibits excellent hydrophobicity with a contact angle >90°, that is very close to the angle recorded for 1 under the same conditions, (Fig. 2d). Surprisingly, the contact angle of the newly synthesized HTM was without any change after leaving for 5 min, in contrast to spiro-OMeTAD for which a 2 degree decrease in the contact angle was observed over the same time period. The hole mobility values for the 1 and 2 HTMs, were determined to be 2.5 × 10⁻⁵ and 1.6 × 10⁻⁵ cm2 V−1 s−1 respectively, according to the space-charge limited currents (SCLCs) method. However, after the addition of dopants (LiTFSI and tBupy) to the HTM layers, their hole mobilities dramatically increased to 3.1 × 10⁻⁴ and 2.2 × 10⁻⁴ cm2 V−1 s−1, respectively. The energy-level diagram for spiro-OMeIm is presented in Fig. 3a. The ambipolar property of the (FAPbI3)0.85(MAPbBr3)0.15 perovskite layer, causes the electrons to be effectively injected into the conductive band of the m-TiO2, generating holes which collect at the Au electrode.
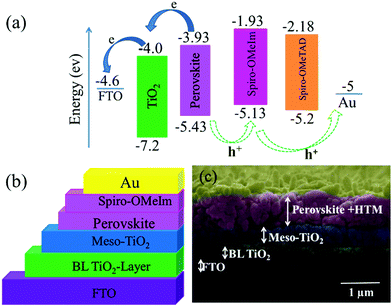 |
| | Fig. 3 (a) Energy band diagram of spiro-OMeIm; (b) schematic structure of a fully printable mesoscopic perovskite solar cell device using spiro-OMeIm as the HTM; (c) cross sectional SEM image of the active layers of the interfacial junction structure of the device. | |
The thin layer of spiro-OMeIm efficiently extracts the holes preventing photogenerated carrier recombination, which is attributed to its hole-transporting properties and suitable energy-levels. Examination of the energy levels for the various components of the device reveal that the HOMO of 2 is matched to the valence band (VB) of both the (FAPbI3)0.85(MAPbBr3)0.15 perovskite (−5.43 eV) and the Au cathode (−5 eV) when compared to 1, which ensures an efficient hole transfer from the perovskite layer to the spiro-OMeIm. In addition, the LUMO energy level of spiro-OMeIm is higher than the conduction band of the perovskite, which prevents electron transfer from the perovskite to the Au cathode and thus reduces the amount of carrier recombination.26 Given this promising initial data, for direct comparison PSCs were subsequently fabricated from both spiro-OMeIm 2 and spiro-OMeTAD 1. The layer arrangement of the resulting PSC, that includes FTO/blocking, layer-TiO2/mesoporous, layer-TiO2/(FAPbI3)0.85(MAPbBr3)0.15/spiro-OMeIm or spiro-OMeTAD/Au is shown in Fig. 3b, which corresponds to the following configuration: anode/electron transport layer, (ETL)/light absorbing layer, (perovskite)/hole transport layer and (HTL)/cathode. A cross-sectional SEM image of the active layers at the interfacial junction structure of the spiro-OMeIm device is shown in Fig. 3c. The perovskite fully penetrates inside the TiO2, which injects electrons into the conduction band of the TiO2 and holes into valence band of the spiro-OMeIm. The thickness of each layer of the device was optimized according to the literature. Moreover, no breaking defects or pores were observed in any of the layers, which indicates that they were successfully compacted together. Previous studies have shown that PL steady state studies of perovskite and HTMs deposited onto perovskites can be a useful method to determine the ability of a HTM to transfer holes from the perovskite layer to the cathode.27,28Fig. 4a shows charge transfer at the interface of the perovskite/HTM which as seen, the quenching effect of spiro-OMeIm is 0.87. However, carrying out the same study using spiro-OMeTAD HTM afforded slightly higher quenching effects of 0.89.
| |  | (1) |
Time resolved PL spectroscopy was subsequently employed to determine the lifetime (
τ2) of the charge carrier dynamics of perovskite and perovskite/HTMs, (
Fig. 4b).
30 After fitting the PL decay traces with a bi-exponential decay model,
τ2 values for the perovskite, perovskite/spiro-OMeTAD and perovskite/spiro-OMeIm systems were determined to be 441.24, 55.83 and 56.06 ns respectively. Interestingly, this study also reveals that the charge carrier dynamics of the newly engineered HTM
2 and the benchmark
1 are very similar and as expected, much smaller than those obtained for the perovskite without any HTM. In this context, it is known that the neutral form of spiro-OMeTAD has a low hole mobility and low conductivity.
31 However, addition of dopants (LiTFSI and
tBuPy) to a layer containing spiro-OMeTAD increases both of these properties and thus increases the efficiency of this material in PSCs. Spiro-OMeTAD is stabilized by the LiTFSI counterion according to the reactions shown in
Fig. 5.
32–35
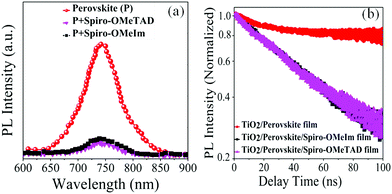 |
| | Fig. 4 (a) The PL of the substrate FTO/TiO2/HTMs and FTO/TiO2/perovskite; (b) photoluminescence decay of perovskite, perovskite/spiro-OMeTAD and perovskite/spiro-OMeIm. In this respect, the PL quenching efficiencies (η quenching) of 1 and 2 were obtained from7eqn (1)29 and are reported in Table 1. | |
 |
| | Fig. 5 Top, equilibrium between spiro-OMrTAD and oxidized OMeTAD˙+O2˙−; bottom, reaction of the superoxide radical with Li+. | |
LiTFSI plays a dual role. On the one hand, it behaves as an ionic salt increasing the conductivity and mobility of the HTM. On the other hand however, addition of LiTFSI shifts the equilibrium between spiro-OMeTAD with O2 and oxidized spiro-OMeTAD˙+O2˙−, since the superoxide radical reacts with Li+ to afford LixOy, that in turn facilitates the rapid degradation of spiro-OMeTAD to a spiro-[OMeTAD]˙+TFSI− species. The observation of a broad absorption band around 525 nm in the visible region of spiro-OMeTAD is consistent with the presence of oxidized [spiro-OMeTAD]˙+ species. It has therefore been shown that LiTFSI facilitates the production of oxidized spiro-OMeTAD as well as illumination by AM1.5 (100 mW cm−2).36 However, in our new HTM, the LiTFSI does not cause the generation of oxidized [spiro-OMeIm]˙+ since it has no effect on the region around 450 nm. As highlighted in Fig. 6, when the concentration of LiTFSI in the spiro-OMeTAD increases, the absorption peak in the visible region gradually rises, while no change in the absorption band in the visible region of spiro-OMeIm is observed. This is strong evidence to further support the enhanced stability of spiro-OMeIm over its spiro-OMeTAD counterpart.
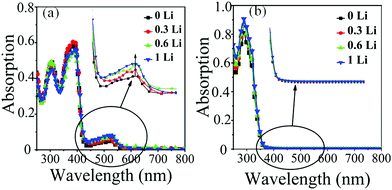 |
| | Fig. 6 UV-vis absorption spectra of spiro-OMeTAD (a) and spiro-OMeIm (b) in chloroform at an illumination time of 1 h with 0, 0.3, 0.6, and 1 molar ratios of LiTFSI/HTM. | |
The J–V curves of the best devices under 100 mW cm−2 AM1.5G solar illumination with reverse (BW) and forward (FW) scans are shown in Fig. 7a, and the corresponding data are summarised in Table 2. The tolerance of Voc, Jsc, FF and PCE of spiro-OMeIm for 20 samples of PSCs fabricated with spiro-OmeIm is shown in Fig. S1 (ESI†). The device fabricated from spiro-OMeIm as the HTM, shows a power conversion efficiency (PCE) of 17.10%, with a Voc of 1.10 V, a Jsc of 20.46 mA cm−2, and a fill factor (FF) of 76%, under backward (BW) scan conditions. The statistical distribution of 20 perovskite solar cells based on spiro-OMeIm and spiro-OMeTAD including the mean and standard deviation are provided in Fig. S1 (ESI†) and Table 2. However, there is a small hysteresis and distortion in the J–V curves in both the reverse and forward scans. For comparison, PSCs containing spiro-OMeTAD and no HTM were also investigated under the same conditions (Fig. 7a and Table 2).
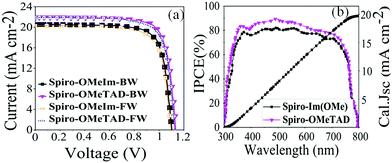 |
| | Fig. 7 (a) J–V and IPCE curves for PSCs based on spiro-OMeTAD, spiro-OMeIm and HTMs; (b) the corresponding IPCE spectra for spiro-OMeTAD 1 and spiro-OMeIm 2. (FW and BW refer to the forward and backward (reverse) sweeping voltage direction scans respectively) | |
Table 2 Top four rows, photovoltaic data for the best PSCs based on spiro-OMeIm and spiro-OMeTAD HTMs obtained from testing 20 samples; bottom 4 rows, the mean photovoltaic data and associated standard deviations obtained from testing 20 samples
| HTMs |
V
oc [V] |
J
sc [mA cm−2] |
FF [%] |
PCE [%] |
| Spiro-OMeIm-BW |
1.10 |
20.46 |
76 |
17.10 |
| Spiro-OMeIm-FW |
1.10 |
20.35 |
75 |
16.78 |
| Spiro-OMeTAD-BW |
1.13 |
21.86 |
78 |
19.26 |
| Spiro-OMeTAD-FW |
1.12 |
21.82 |
77 |
18.81 |
| Mean (spiro-OMeIm) |
1.07 |
19.79 |
72 |
15.25 |
| Std (spiro-OMeIm) |
0.029 |
0.82 |
0.043 |
1.81 |
| Mean (spiro-OMeTAD) |
1.07 |
21.46 |
76 |
17.60 |
| Std (spiro-OMeTAD) |
0.025 |
0.39 |
0.031 |
1.41 |
Studies reveal that the values of Jsc and Voc for both the spiro-OMeIm and spiro-OMeTAD devices are very similar, while the FF of spiro-OMeTAD is higher than spiro-OMeIm, resulting in a slightly larger power conversion efficiency (PCE). This disparity is in line with the results of PL steady state studies where the lower PCE of 2 is most likely attributed to a decline in the charge carrier dynamics between the HTM and the perovskite layers.37 To put the results for this new system into context, device parameters for other reported spiro-based HTMs38 are summarized in Table S1 of the ESI.† The difference between the PCE of a new HTM and the benchmark spiro-OMeTAD has been previously defined as ΔHTM–Spiro = PCEnewHTM − PCEspiro-OMeTAD, which typically affords values ranging from −5.9 to 2.2. Applying this methodology to 2 affords a PCE value of −2.5 which is among the highest reported for any spiro-HTM to-date. In terms of cost, OMeIm can be synthesized at a cost of 15 US $ g−1, while for other HTMs, the costs associated with preparing the desired precursors to append to the cyclic SBF core, (SBF = (9,9′-spirobi[fluorene])) can be as much as 70 US $ g−1, (Fig. 6a and b). Eqn (2) was employed to further determine the cost-per-peak-Watt ($ per Wp, denoted here as Cw) for the utilization of OMeIm vs. di-p-methoxyphenylamine,39 where η is the solar cell efficiency in the range 5–30%, Cg is the cost-per-gram, p is the density that is assumed to be 1.1 g cm−3, t is the thickness of the donor material (t) and I is the solar insolation under peak conditions, that is assumed to be 100 nm and 1000 W m−2 respectively.
| |  | (2) |
The plot of
Cw as a function of solar cell efficiency reveals that the cost of preparation of the OMeIm precursor is much more economical than its di-
p-methoxyphenylamine counterpart, (
Fig. 8 left). For example, for 10% efficiency, the cost of using OMeIm is estimated to be $0.017, whereas the estimated cost of using diphenylamine is seven times higher at $0.076.
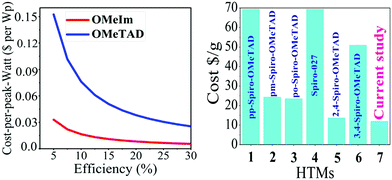 |
| | Fig. 8 (left) Cost per peak Watt ($ per Wp) for OMeTAD and OMeIm; (right) the cost ($ per g) of the preparation of precursors to a range of well-known HTMs and their comparison to the newly introduced OMeIm in 2 (see also Table S1 in the ESI†). | |
Conclusions
This study represents the first-time diphenyl imidazole substituents have been introduced into a spiro-cyclic framework for the discovery of a new HTM. The facile synthetic pathway and high product yields of these substituents, when compared to their diphenylamine counterparts make spiro-OMeIm a very promising hole transport material for the large-scale fabrication of cost-effective perovskite solar cells. Furthermore, the difference between the PCE of the newly synthesized HTM and spiro-OMeTAD is only 2.5%, which is amongst the smallest values reported for any spiro-HTM to-date.
Experimental
All chemicals and reagents were purchased from Merck or Sigma Aldrich and used without further purification unless stated otherwise.
Synthetic procedures
2-(4-Methoxyphenyl)4,5-diphenyl-1H-imidazole (OMeIm) (3).
In a 100 mL two-necked flask, 4-methoxybenzaldehyde (0.136 g, 1 mmol) was added to of acetic acid (10 mL) and the resulting solution was stirred for 10 minutes under a nitrogen atmosphere. Benzil (0.210 g, 1 mmol) was then added followed by ammonium acetate (3.854 g, 50 mmol) and the resulting mixture was refluxed at 127 °C for 15 hours. The solution was then neutralized to pH = 7 via the addition of ammonia, and the product was extracted into chloroform and dried over anhydrous MgSO4. Evaporation of the solvent afforded 3 as an off-white solid in 62% yield. 1H-NMR (DMSO, 500 MHz) δ = 12.668 (s, 1H), 8.011 (d, 2H), 7.507 (d, 4H), 7.344 (d, 4H), 7.319 (t, 2H), 7.040 (d, 2H), 3.790 (s, 3H). Anal. calc. for (C22H18N2O): C, 80.96; H, 5.57; N, 8.58%; found: C, 80.97; H, 8.59; N, 8.58%. ESI-MS: m/z, 325.27, [M − H]+.
Spiro-OMeIm (2).
2,2′,7,7′-Tetrabromo-9,9′-spirobi[9H-fluorene] (0.158 g, 0.25 mmol), 2-(4-methoxy phenyl),5-diphenyl-1H-imidazole (OMeIm) (0.632 g, 1 mmol), tris(dibenzilidene-acetone)dipalladium (0)![[thin space (1/6-em)]](https://www.rsc.org/images/entities/char_2009.gif) :
:![[thin space (1/6-em)]](https://www.rsc.org/images/entities/char_2009.gif) BINAP
BINAP![[thin space (1/6-em)]](https://www.rsc.org/images/entities/char_2009.gif) :
:![[thin space (1/6-em)]](https://www.rsc.org/images/entities/char_2009.gif) sodiumtert-butoxide (0.05
sodiumtert-butoxide (0.05![[thin space (1/6-em)]](https://www.rsc.org/images/entities/char_2009.gif) :
:![[thin space (1/6-em)]](https://www.rsc.org/images/entities/char_2009.gif) 0.15
0.15![[thin space (1/6-em)]](https://www.rsc.org/images/entities/char_2009.gif) :
:![[thin space (1/6-em)]](https://www.rsc.org/images/entities/char_2009.gif) 2) (1.922 g, 5.8 mmol) were placed in a 50 mL two-necked flask. Anhydrous toluene (10 mL) was then added to the flask under a nitrogen atmosphere. The reaction mixture was heated to 110 °C for 12 h under a nitrogen. After cooling to room temperature, the reaction mixture was extracted with a 1
2) (1.922 g, 5.8 mmol) were placed in a 50 mL two-necked flask. Anhydrous toluene (10 mL) was then added to the flask under a nitrogen atmosphere. The reaction mixture was heated to 110 °C for 12 h under a nitrogen. After cooling to room temperature, the reaction mixture was extracted with a 1![[thin space (1/6-em)]](https://www.rsc.org/images/entities/char_2009.gif) :
:![[thin space (1/6-em)]](https://www.rsc.org/images/entities/char_2009.gif) 2 mixture of ethyl acetate and brine and then dried over anhydrous MgSO4. The solvent was evaporated, and the residue was purified by column chromatography using silica-gel and eluting with a 1
2 mixture of ethyl acetate and brine and then dried over anhydrous MgSO4. The solvent was evaporated, and the residue was purified by column chromatography using silica-gel and eluting with a 1![[thin space (1/6-em)]](https://www.rsc.org/images/entities/char_2009.gif) :
:![[thin space (1/6-em)]](https://www.rsc.org/images/entities/char_2009.gif) 8 mixture of ethyl acetate and hexane to afford 2 as a yellow solid in 51% yield. 1H-NMR (CDCl3, 500 MHz) δ = 7.850 (d, 4H), 7.661 (d, 8H), 7.508 (d, 16H), 7.293 (q, 16H), 7.268 (t, 8H), 6.913 (d, 4H), 6.882 (s, 4H), 6.841 (d, 8H), 3.815 (s, 12H). 13C-NMR (CDCl3, 125 MHz) δ = 160.081, 148.798, 146.204, 128.468, 127.855, 127.223, 126.922, 122.694, 122.172, 121.695, 114.176, 77.530, 77.021, 76.515, 55.309, 29.698. Anal. calc. for (C115H88N8O4): C, 83.92; H, 5.40; N, 6.81%; found: C, 83.94; H, 5.42; N, 6.82%. ESI-MS: m/z, 1644.65, [M − H]+.
8 mixture of ethyl acetate and hexane to afford 2 as a yellow solid in 51% yield. 1H-NMR (CDCl3, 500 MHz) δ = 7.850 (d, 4H), 7.661 (d, 8H), 7.508 (d, 16H), 7.293 (q, 16H), 7.268 (t, 8H), 6.913 (d, 4H), 6.882 (s, 4H), 6.841 (d, 8H), 3.815 (s, 12H). 13C-NMR (CDCl3, 125 MHz) δ = 160.081, 148.798, 146.204, 128.468, 127.855, 127.223, 126.922, 122.694, 122.172, 121.695, 114.176, 77.530, 77.021, 76.515, 55.309, 29.698. Anal. calc. for (C115H88N8O4): C, 83.92; H, 5.40; N, 6.81%; found: C, 83.94; H, 5.42; N, 6.82%. ESI-MS: m/z, 1644.65, [M − H]+.
Compound characterization
NMR measurements were performed on a Bruker 250 MHz spectrometer in CDCl3. UV-Vis digitized spectra were collected in chloroform using an Ultrospec 3100 prospectrophotometer in the 200–800 nm range. Photoluminescence (PL) emission spectra were measured on a Varian-Cary Eclipse fluorescence spectrophotometer. Electrochemical studies were carried out using a SAMA500 potentiostat electrochemical analyzer with a conventional three electrode cell, a Pt disk as the working electrode, a Pt wire as the counter electrode. Ag/AgCl was used as the reference electrode and the supporting electrolyte was 0.1 M tetrabutylammonium perchlorate (TBAP). CV measurements were carried out on 3 × 10⁻⁵ M solutions in chloroform. EHOMO and ELUMO were obtained from eqn (3) and (4) below:40| | | EHOMO = −(4.80 (Fc/Fc+) + Eox,onset − EFc/Fc+) | (3) |
Perovskite solar cell fabrication
At first, part of the glass coated with FTO was etched with Zn powder and a 2 M ethanol solution of HCl followed by distilled water, detergent, acetone and ethanol were used to wash the substrate. To prevent direct contact between FTO and the hole-conducting layer, a layer of TiO2 (bl-TiO2) was deposited onto fluorine-doped tin oxide (FTO) substrate by spin-coating at 2000 rpm for 30 s using titanium diisopropoxide bis(acetylacetonate) solution (Aldrich) at 500 °C. 300–400 nm thick mesoporous TiO2 (Sharif Solar Co. PST-20T) films were spin-coated onto the bl-TiO2/FTO substrate at 2000 rpm for 10 s, and then calcined at 500 °C for 30 min to remove the organic part. The (FAPbI3)0.85(MAPbBr3)0.15 solution was prepared by dissolving PbI2 (1.15 M), FAI (1.10 M), PbBr2 (0.2 M), and MABr (0.2 M) in anhydrous DMF![[thin space (1/6-em)]](https://www.rsc.org/images/entities/char_2009.gif) :
:![[thin space (1/6-em)]](https://www.rsc.org/images/entities/char_2009.gif) DMSO = 4
DMSO = 4![[thin space (1/6-em)]](https://www.rsc.org/images/entities/char_2009.gif) :
:![[thin space (1/6-em)]](https://www.rsc.org/images/entities/char_2009.gif) 1 (volume ratio), and then coated onto the mp-TiO2/bl-TiO2/FTO substrate by two step spin coating at 1000 and 5000 rpm for 90 s and 30 s respectively. For deposition of the hole transport layers, spiro-OMeIm and spiro-OMeTAD were prepared at a concentration of 78 mM, in chlorobenzene. In addition, 18 μL LiTFSI (from a stock solution in acetonitrile with concentration of 1.0 M), 29 μL of tert-butyl pyridine (from a stock solution in chlorobenzene with concentration of 1.0 M) were added to the spiro-OMeIm and spiro-OMeTAD solutions as additives. Finally, an Au electrode was deposited by thermal evaporation.11
1 (volume ratio), and then coated onto the mp-TiO2/bl-TiO2/FTO substrate by two step spin coating at 1000 and 5000 rpm for 90 s and 30 s respectively. For deposition of the hole transport layers, spiro-OMeIm and spiro-OMeTAD were prepared at a concentration of 78 mM, in chlorobenzene. In addition, 18 μL LiTFSI (from a stock solution in acetonitrile with concentration of 1.0 M), 29 μL of tert-butyl pyridine (from a stock solution in chlorobenzene with concentration of 1.0 M) were added to the spiro-OMeIm and spiro-OMeTAD solutions as additives. Finally, an Au electrode was deposited by thermal evaporation.11
Device characterization
The current density–voltage (J–V) curves were measured using a solar simulator (Newport, Oriel Class A, 91195A) equipped with a source meter (Keithley 2420) under 100 mW cm−2 illumination (AM 1.5G) and calibrated with a Si-reference cell certificated by NREL. The J–V curves of both devices were measured by masking the active area with a metal mask of area 0.096 cm2. J–V curves were recorded scanning at 0.01 V s−1 from forward bias (FB) to short-circuit condition (SC) and vice versa. EQEs were measured using a power source (Newport 300 W xenon lamp, 66920), equipped with a monochromator (Newport Cornerstone 260) and a multimeter (Keithley 2001). The resulting data is shown in Fig. S1 of the ESI.†
Conflicts of interest
There are no conflicts to declare.
Acknowledgements
This work was funded by the NSERC Discovery program (2018 04255, M. Pilkington). Gabriele Delle Monache acknowledges Brock University for an OGS Scholarship. L. K., H. S. and B. P wish to thank the University of Zanjan for financial support.
Notes and references
- H. Kroemer, ChemPhysChem, 2001, 2, 490 CrossRef CAS PubMed.
- M. M. Lee, J. Teuscher, T. Miyasaka, T. N. Murakami and H. J. Snaith, Science, 2012, 338, 643 CrossRef CAS PubMed.
- F. De Angelis, D. Meggiolaro, E. Mosconi, A. Petrozza, M. K. Nazeeruddin and H. J. Snaith, ACS Energy Lett., 2017, 2, 857 CrossRef CAS.
- J. H. Kim, P. W. Liang, S. T. Williams, N. Cho, C. C. Chueh, M. S. Glaz, D. S. Ginger and A. K. Y. Jen, Adv. Mater., 2015, 27, 695 CrossRef CAS PubMed.
- K.-C. Wang, J.-Y. Jeng, P.-S. Shen, Y.-C. Chang, E. W.-G. Diau, C.-H. Tsai, T.-Y. Chao, H.-C. Hsu, P.-Y. Lin, P. Chen, T.-F. Guo and T.-C. Wen, Sci. Rep., 2014, 4, 4756 CrossRef PubMed.
- Z. H. Bakr, Q. Wali, A. Fakharuddin, L. Schmidt-Mende, T. M. Brown and R. Jose, Nano Energy, 2017, 34, 271 CrossRef CAS.
- A. Krishna and A. C. Grimsdale, J. Mater. Chem. A, 2017, 5, 16446 RSC.
- S. Ameen, M. A. Rub, S. A. Kosa, K. A. Alamry, M. S. Akhtar, H. S. Shin, H. K. Seo, A. M. Asiri and M. K. Nazeeruddin, ChemSusChem, 2016, 9, 10 CrossRef CAS PubMed.
- C. Rodríguez-Seco, L. Cabau, A. Vidal-Ferran and E. Palomares, Acc. Chem. Res., 2018, 51, 869 CrossRef PubMed.
- R. Grisorio, R. Iacobellis, A. Listorti, L. De Marco, M. P. Cipolla, M. Manca, A. Rizzo, A. Abate, G. Gigli and G. P. Suranna, ACS Appl. Mater. Interfaces, 2017, 9, 24778 CrossRef CAS PubMed.
- M. Saliba, S. Orlandi, T. Matsui, S. Aghazada, M. Cavazzini, J.-P. Correa-Baena, P. Gao, R. Scopelliti, E. Mosconi, K.-H. Dahmen, F. D. Angelis, A. Abate, A. Hagfeldt, G. Pozzi, M. Graetzle and M. K. Nazeeruddin, Nat. Energy, 2016, 1, 15017 CrossRef CAS.
- A. T. Murray, J. M. Frost, C. H. Hendon, C. D. Molloy, D. R. Carbery and A. Walsh, Chem. Commun., 2015, 51, 8935 RSC.
- A. Connell, Z. Wang, Y.-H. Lin, P. C. Greenwood, A. A. Wiles, E. W. Jones, L. Furnell, R. Anthony, C. P. Kershaw, G. Cooke, H. J. Snaith and P. J. Holliman, J. Mater. Chem. C, 2019, 7, 5235 RSC.
- N. J. Jeon, H. G. Lee, Y. C. Kim, J. Seo, J. H. Noh, J. Lee and S. I. Seok, J. Am. Chem. Soc., 2014, 136, 7837 CrossRef CAS PubMed.
- I. Ali, M. N. Lone and H. Y. Aboul-Enein, MedChemComm, 2017, 8, 1742 RSC.
- N. Rani, A. Sharma and R. Singh, Mini-Rev. Med. Chem., 2013, 13, 1812 CrossRef CAS PubMed.
- J. P. McEvoy and G. W. Brudvig, Chem. Rev., 2006, 106, 4455 CrossRef CAS PubMed.
- R. Butkute, R. Lygaitis, V. Mimaite, D. Gudeika, D. Volyniuk, G. Sini and J. V. Grazulevicius, Dyes Pigm., 2017, 146, 425 CrossRef CAS.
- B. N. Bideh and H. Shahroosvand, Sci. Rep., 2017, 7, 15739 CrossRef PubMed.
- B. N. Bideh, C. Roldán-Carmona, H. Shahroosvand and M. K. Nazeeruddin, J. Mater. Chem. C, 2016, 4, 9674 RSC.
- Y. S. Yen, J. S. Ni, T. Y. Lin, W. I. Hung, J. T. Lin and M. C. P. Yeh, Eur. J. Org. Chem., 2015, 7367 CrossRef CAS.
- D. Kumar, K. Justin Thomas, C.-P. Lee and K.-C. Ho, J. Org. Chem., 2014, 79, 3159 CrossRef CAS PubMed.
- C. M. Cardona, W. Li, A. E. Kaifer, D. Stockdale and G. C. Bazan, Adv. Mater., 2011, 23, 2367 CrossRef CAS PubMed.
- T. Leijtens, I.-K. Ding, T. Giovenzana, J. T. Bloking, M. D. McGehee and A. Sellinger, ACS Nano, 2012, 6, 1455 CrossRef CAS PubMed.
- T. Leijtens, T. Giovenzana, S. N. Habisreutinger, J. S. Tinkham, N. K. Noel, B. A. Kamino, G. Sadoughi, A. Sellinger and H. J. Snaith, ACS Appl. Mater. Interfaces, 2016, 8, 5981 CrossRef CAS PubMed.
- Y. Xu, J. Shi, S. Lv, L. Zhu, J. Dong, H. Wu, Y. Xiao, Y. Luo, S. Wang, D. Li, X. Li and Q. Meng, ACS Appl. Mater. Interfaces, 2014, 6, 5651 CrossRef CAS PubMed.
- Q. Jiang, L. Zhang, H. Wang, X. Yang, J. Meng, H. Liu, Z. Yin, J. Wu, X. Zhang and J. You, Nat. Energy, 2017, 2, 16177 CrossRef CAS.
- K. Wojciechowski, S. D. Stranks, A. Abate, G. Sadoughi, A. Sadhanala, N. Kopidakis, G. Rumbles, C.-Z. Li, R. H. Friend, A. K.-Y. Jen and H. J. Snaith, ACS Nano, 2014, 8, 12701 CrossRef CAS PubMed.
- S. R. Scully, P. B. Armstrong, C. Edder, J. M. Fréchet and M. D. McGehee, Adv. Mater., 2007, 19, 2961 CrossRef CAS.
- J. Burschka, N. Pellet, S.-J. Moon, R. Humphry-Baker, P. Gao, M. K. Nazeeruddin and M. Grätzel, Nature, 2013, 499, 316 CrossRef CAS PubMed.
- A. Abate, T. Leijtens, S. Pathak, J. Teuscher, R. Avolio, M. E. Errico, J. Kirkpatrik, J. M. Ball, P. Docampo, I. McPherson and H. J. Snaith, Phys. Chem. Chem. Phys., 2013, 15, 2572 RSC.
- U. B. Cappel, T. Daeneke and U. Bach, Nano Lett., 2012, 12, 4925 CrossRef CAS PubMed.
- Z. Hawash, L. K. Ono, S. R. Raga, M. V. Lee and Y. Qi, Chem. Mater., 2015, 27, 562 CrossRef CAS.
- L. Yang, B. Xu, D. Bi, H. Tian, G. Boschloo, L. Sun, A. Hagfeldt and E. M. J. Johansson, J. Am. Chem. Soc., 2013, 135, 7378 CrossRef CAS PubMed.
- S. Kazim, M. K. Nazeeruddin, M. Grätzel and S. Ahmad, Angew. Chem., Int. Ed., 2014, 53, 2812 CrossRef CAS PubMed.
- S. Wang, W. Yuan and Y. S. Meng, ACS Appl. Mater. Interfaces, 2015, 7, 24791 CrossRef CAS PubMed.
- M. S. Kang, S. D. Sung, I. T. Choi, H. Kim, M. Hong, J. Kim, W. I. Lee and H. K. Kim, ACS Appl. Mater. Interfaces, 2015, 7, 22213 CrossRef CAS PubMed.
-
(a) N. J. Jeon, H. G. Lee, Y. C. Kim, J. Seo, J. H. Noh, J. Lee and S. I. Seok, J. Am. Chem. Soc., 2014, 136, 7837 CrossRef CAS PubMed;
(b) Y. Shi, Y. Xue, K. Hou, G. Meng, K. Wang, R. Chi, F. Chen, H. Ren, M. Pang and C. Hao, RSC Adv., 2016, 6, 96990 RSC;
(c) M.-D. Zhang, D.-X. Zhao, L. Chen, N. Pan, C.-Y. Huang, H. Cao and M.-D. Chen, Sol. Energy Mater. Sol. Cells, 2018, 176, 318 CrossRef CAS.
- T. P. Osedach, T. L. Andrew and V. Bulović, Energy Environ. Sci., 2013, 6, 711 RSC.
- W. Hong, B. Sun, H. Aziz, W.-T. Park, Y.-Y. Noh and Y. Li, Chem. Commun., 2012, 48, 8413 RSC.
Footnote |
| † Electronic supplementary information (ESI) available. See DOI: 10.1039/d0tc00196a |
|
| This journal is © The Royal Society of Chemistry 2020 |
Click here to see how this site uses Cookies. View our privacy policy here.  *a,
Babak
Pashaei
a,
Gabriele Delle
Monache
b,
Mohammad Khaja
Nazeeruddin
 c and
Melanie
Pilkington
 *b
*b


![[thin space (1/6-em)]](https://www.rsc.org/images/entities/char_2009.gif) :
:![[thin space (1/6-em)]](https://www.rsc.org/images/entities/char_2009.gif) BINAP
BINAP![[thin space (1/6-em)]](https://www.rsc.org/images/entities/char_2009.gif) :
:![[thin space (1/6-em)]](https://www.rsc.org/images/entities/char_2009.gif) sodiumtert-butoxide (0.05
sodiumtert-butoxide (0.05![[thin space (1/6-em)]](https://www.rsc.org/images/entities/char_2009.gif) :
:![[thin space (1/6-em)]](https://www.rsc.org/images/entities/char_2009.gif) 0.15
0.15![[thin space (1/6-em)]](https://www.rsc.org/images/entities/char_2009.gif) :
:![[thin space (1/6-em)]](https://www.rsc.org/images/entities/char_2009.gif) 2) (1.922 g, 5.8 mmol) were placed in a 50 mL two-necked flask. Anhydrous toluene (10 mL) was then added to the flask under a nitrogen atmosphere. The reaction mixture was heated to 110 °C for 12 h under a nitrogen. After cooling to room temperature, the reaction mixture was extracted with a 1
2) (1.922 g, 5.8 mmol) were placed in a 50 mL two-necked flask. Anhydrous toluene (10 mL) was then added to the flask under a nitrogen atmosphere. The reaction mixture was heated to 110 °C for 12 h under a nitrogen. After cooling to room temperature, the reaction mixture was extracted with a 1![[thin space (1/6-em)]](https://www.rsc.org/images/entities/char_2009.gif) :
:![[thin space (1/6-em)]](https://www.rsc.org/images/entities/char_2009.gif) 2 mixture of ethyl acetate and brine and then dried over anhydrous MgSO4. The solvent was evaporated, and the residue was purified by column chromatography using silica-gel and eluting with a 1
2 mixture of ethyl acetate and brine and then dried over anhydrous MgSO4. The solvent was evaporated, and the residue was purified by column chromatography using silica-gel and eluting with a 1![[thin space (1/6-em)]](https://www.rsc.org/images/entities/char_2009.gif) :
:![[thin space (1/6-em)]](https://www.rsc.org/images/entities/char_2009.gif) 8 mixture of ethyl acetate and hexane to afford 2 as a yellow solid in 51% yield. 1H-NMR (CDCl3, 500 MHz) δ = 7.850 (d, 4H), 7.661 (d, 8H), 7.508 (d, 16H), 7.293 (q, 16H), 7.268 (t, 8H), 6.913 (d, 4H), 6.882 (s, 4H), 6.841 (d, 8H), 3.815 (s, 12H). 13C-NMR (CDCl3, 125 MHz) δ = 160.081, 148.798, 146.204, 128.468, 127.855, 127.223, 126.922, 122.694, 122.172, 121.695, 114.176, 77.530, 77.021, 76.515, 55.309, 29.698. Anal. calc. for (C115H88N8O4): C, 83.92; H, 5.40; N, 6.81%; found: C, 83.94; H, 5.42; N, 6.82%. ESI-MS: m/z, 1644.65, [M − H]+.
8 mixture of ethyl acetate and hexane to afford 2 as a yellow solid in 51% yield. 1H-NMR (CDCl3, 500 MHz) δ = 7.850 (d, 4H), 7.661 (d, 8H), 7.508 (d, 16H), 7.293 (q, 16H), 7.268 (t, 8H), 6.913 (d, 4H), 6.882 (s, 4H), 6.841 (d, 8H), 3.815 (s, 12H). 13C-NMR (CDCl3, 125 MHz) δ = 160.081, 148.798, 146.204, 128.468, 127.855, 127.223, 126.922, 122.694, 122.172, 121.695, 114.176, 77.530, 77.021, 76.515, 55.309, 29.698. Anal. calc. for (C115H88N8O4): C, 83.92; H, 5.40; N, 6.81%; found: C, 83.94; H, 5.42; N, 6.82%. ESI-MS: m/z, 1644.65, [M − H]+.
![[thin space (1/6-em)]](https://www.rsc.org/images/entities/char_2009.gif) :
:![[thin space (1/6-em)]](https://www.rsc.org/images/entities/char_2009.gif) DMSO = 4
DMSO = 4![[thin space (1/6-em)]](https://www.rsc.org/images/entities/char_2009.gif) :
:![[thin space (1/6-em)]](https://www.rsc.org/images/entities/char_2009.gif) 1 (volume ratio), and then coated onto the mp-TiO2/bl-TiO2/FTO substrate by two step spin coating at 1000 and 5000 rpm for 90 s and 30 s respectively. For deposition of the hole transport layers, spiro-OMeIm and spiro-OMeTAD were prepared at a concentration of 78 mM, in chlorobenzene. In addition, 18 μL LiTFSI (from a stock solution in acetonitrile with concentration of 1.0 M), 29 μL of tert-butyl pyridine (from a stock solution in chlorobenzene with concentration of 1.0 M) were added to the spiro-OMeIm and spiro-OMeTAD solutions as additives. Finally, an Au electrode was deposited by thermal evaporation.11
1 (volume ratio), and then coated onto the mp-TiO2/bl-TiO2/FTO substrate by two step spin coating at 1000 and 5000 rpm for 90 s and 30 s respectively. For deposition of the hole transport layers, spiro-OMeIm and spiro-OMeTAD were prepared at a concentration of 78 mM, in chlorobenzene. In addition, 18 μL LiTFSI (from a stock solution in acetonitrile with concentration of 1.0 M), 29 μL of tert-butyl pyridine (from a stock solution in chlorobenzene with concentration of 1.0 M) were added to the spiro-OMeIm and spiro-OMeTAD solutions as additives. Finally, an Au electrode was deposited by thermal evaporation.11


