 Open Access Article
Novel Aurivillius Bi4Ti3−2xNbxFexO12 phases with increasing magnetic-cation fraction until percolation: a novel approach for room temperature multiferroism†
Miguel
Algueró
 *a,
Miguel
Pérez-Cerdán
a,
Rafael P.
del Real
ab,
Jesús
Ricote
 a and
Alicia
Castro
a
aInstituto de Ciencia de Materiales de Madrid (ICMM), CSIC, Cantoblanco, 28049 Madrid, Spain. E-mail: malguero@icmm.csic.es
bInstituto de Magnetismo Aplicado (UCM), Unidad Asociada (CSIC), Spain
First published on 1st August 2020
Abstract
Aurivillius oxides with general formula (Bi2O2)(Am−1BmO3m+1) are being extensively investigated for room-temperature multiferroism and magnetoelectric coupling. The chemical design strategy behind current investigations is the incorporation of magnetically active BiMO3 units (M: Fe3+, Mn3+, Co3+…) to the pseudoperovskite layer of known ferroelectrics like Bi4Ti3O12, increasing m. The percolation of magnetic cations at the B-site sublattice is required for magnetic ordering and thus, phases with m ≥ 5 are searched. Alternatively, one can try to directly substitute magnetic species for Ti4+ in the perovskite slab, without introducing additional oxygen octahedra. We report here the mechanosynthesis of Aurivillius Bi4Ti3−2xNbxFexO12 phases with increasing x values up to 1. A maximum magnetic fraction of 1/3, surpassing the threshold for percolation, was reached. Preliminary structural analysis indicated a continuous solid solution, though hints of structural changes between x = 0.25 and 0.5 were found. Ceramic processing was accomplished by spark plasma sintering of the mechanosynthesized phases, including those with high-x ones with reduced thermal stability. This has enabled us to carry out full electrical characterization and to demonstrate ferroelectricity for all phases up to x = 1. Magnetic measurements were also carried out, and weak ferromagnetism was found for x = 1. Therefore, Bi4TiNbFeO12 is proposed to be a novel room-temperature multiferroic.
1. Introduction
Magnetoelectric multiferroics are compounds that show coexistence of magnetic and electric ferroic orders.1,2 They can present large magnetoelectric coefficients,2 and coupled magnetic and ferroelectric domains.3 This opens the possibility of achieving electrically driven magnetization reversal. A range of potentially disruptive related technologies have been proposed, which would make use of the ability to control electric polarization with a magnetic field, and conversely magnetization with an electric field. Examples are magnetoelectric memory devices combining low-power, fast electrical-writing with non-destructive magnetic-reading operations,4 and electrically tunable spintronics.5 However, and in spite of extensive research during the last decade, compounds capable of enabling these technologies have not been developed, and the challenge lies in the design of alternative material single-phase approaches that result in targeted functional magnetoelectric responses.6A very active line of research focuses on spin-driven multiferroics. These are magnetic ferroelectrics, in which spontaneous polarization develops during magnetic transition involving complex magnetic orders.7 The first reported compounds were orthorhombic manganese oxides, such as TbMnO3 and TbMn2O5.8,9 Large magnetoelectric effects, basically changes and even reversal of polarization, are observed when the magnetic order is tuned with high fields. However, complex magnetic orders result from competing spin interactions and thus, usually develop at very low temperature. Exceptions are a number of hexaferrites like Z-type Sr3Co2Fe24O41, for which nonlinear magnetoelectric effects have been reported at room temperature.10 A novel non-volatile memory concept has been demonstrated based on the electrical switching of the sign of the magnetoelectric coefficient.11
A second major line of research focuses on perovskite oxides. The best known example, and the most topical multiferroic material, is antiferromagnetic/ferroelectric BiFeO3, whose Néel and Curie temperatures are above room temperature.12,13 Spin canting and weak ferromagnetism can be achieved by doping,14 nanostructuring,15 or in strained films.16 Indeed, electrically driven deterministic switching of weak magnetization has been demonstrated for epitaxial layers.17 Similarly, room-temperature coexistence of ferroelectricity and weak ferromagnetism, and distinctive magnetoelectric effects have been reported for 0.85BiTi0.1Fe0.8Mg0.1O3–0.15CaTiO3.18 This compound is placed at a morphotropic phase boundary (MPB) between ferroelectric phases with rhombohedral and orthorhombic symmetry, respectively. A first-principles study has anticipated a large phase-change magnetoelectric response at MPBs in multiferroic perovskite solid solutions,19 which has been experimentally observed for the BiFeO3–BiMnO3–PbTiO3 ternary compound, chemically engineered to be placed at one such MPB.20
Perovskite solid solutions showing self-assembling of magnetic chemical clusters within highly polarizable matrices are also being actively investigated. Magnetically induced reorientation of ferroelectric domains has been demonstrated for PbZr0.53Ti0.47O3–PbFe1/2Ta1/2O3, associated with the interaction of unidentified spin clusters with a high sensitivity piezoelectric matrix.21 Multiferroic clusters embedded within a relaxor matrix have been investigated for BiFe0.9Co0.1O3–Bi1/2K1/2TiO3. Ferrimagnetism was proposed, and local electrically induced reversal of the magnetization, along with the direct magnetoelectric effect, was demonstrated.22
An issue common to all these material approaches for multiferroism is that the achieved room-temperature magnetizations are consistently low, either because they originate from spin canting within an antiferromagnetic order, or from nano-sized magnetic clusters self-assembled in non-magnetic matrices. Recently, saturation and remnant magnetizations as high as ≈24 and 10 emu g−1, respectively, have been reported for Bi6Ti2.99Fe1.46Mn0.55O18 epitaxial films.23 This is a bismuth layer-structured Aurivillius compound with general formula (Bi2O2)(Am−1BmO3m+1), which have been extensively studied for ferroelectric random access memories, and as high temperature piezoelectrics.24,25 Multiferroism in these materials was devised by the incorporation of magnetically active BiMO3 layers, where M is Fe3+, Co3+ or Mn3+, to the perovskite slab of the ferroelectric Aurivillius Bi4Ti3O12 (m = 3), to obtain [(Bi2O2)(Bi2Ti3O10 + nBiMO3)] compounds.26 Indeed, local ferroelectric switching under high magnetic fields has been reported for textured Bi4.25La0.75Ti3Fe0.5Co0.5O15 bulk ceramics and Bi6Ti2.8Fe1.52Mn0.68O18 thin films with n(m) = 1(4) and 2(5), respectively.27,28 The magnetic order requires a threshold fraction of magnetic species at the B-site,29 and then high n, and so m values are targeted. However, high-m Aurivillius phases are difficult to prepare and have a tendency to form intergrowths of compounds with alternating m values.30
Alternatively, one can try to introduce magnetic species by directly substituting for a B-site cation in the perovskite layer, while maintaining m. This has been done by substituting Fe3+ for Ti4+ in Bi4Ti3O12, which requires the simultaneous incorporation of a 5+ cation like Nb or Ta to maintain charge neutrality.31 A recent paper explored the system Bi4Ti3−2xNbxFexO12 and carried out its synthesis and ceramic processing by conventional means.32 Aurivillius single phase materials could only be obtained up to x = 0.5, for which ferroelectricity persisted, yet the magnetic order did not develop.32 The issue was probably the fraction of magnetic species that was only 1/6 in this case.
We report here the successful synthesis of Bi4Ti3−2xNbxFexO12 phases with x values beyond 0.5 and up to 1 by using a mechanochemical technique, after a previous study on Bi4Ti3O12.33,34 Ceramic processing was accomplished by spark plasma sintering (SPS) of the mechanosynthesized oxides, and dense materials suitable for electrical characterization were obtained for all compositions. The results of this characterization, along with magnetic measurements, showed the persistence of ferroelectricity up to x = 1, and the appearance of weak ferromagnetism above x = 0.5, so that both Bi4Ti1.5Nb0.75Fe0.75O12 and Bi4TiNbFeO12 might be room-temperature multiferroics.
2. Experimental
2.1. Preparation
The mechanosynthesis of Aurivillius Bi4Ti3−2xNbxFexO12 phases was achieved by mechanical treatment of precursors in a high energy planetary mill. Six compositions with x = 0, 0.1, 0.25, 0.5, 0.75 and 1 were addressed. First, stoichiometric mixtures of analytical grade Bi2O3, TiO2 anatase, Nb2O5 and Fe2O3 were thoroughly ground in an agate mortar, and 4 g were placed in an 80 cm3 tungsten carbide vessel, along with five 20 mm diameter balls of the same material. Mechanical treatment was then carried out with a Fritsch Pulverisette 6 planetary mill operating at 300 rpm. Cumulative cycles of 30 min milling and 10 min break were used, which was necessary to prevent overheating, and also small amounts of samples were retrieved to monitor the mixture evolution during the treatment. Phases were controlled by X-ray powder diffraction (XRD) with a Bruker AXS D8 Advance diffractometer. Patterns were recorded between 12 and 60° 2θ, with 2θ increments of 0.05 and a counting time of 0.2 s per step. The Cu-Kα doublet (λ = 1.5418 Å) was used in the measurements. Aurivillius phases were obtained for all cases, and milling was stopped when neither traces of precursors nor secondary phases were observed. Lastly, the product morphology was characterized by field emission scanning electron microscopy (FEG-SEM) with a Philips XL 30 S-FEG FE-SEM apparatus.Synthesis completion and phase stability under subsequent heating were studied by carrying out cumulative thermal treatments at increasing temperatures in a conventional furnace, while controlling phases up to the appearance of secondary ones.
Ceramic processing was accomplished by spark plasma sintering. Experiments were carried out with a SPS-212Lx Dr Sinter Lab Jr. system, dies of 8 mm diameter and ≈1.2 g of material. Graphite dies and temperatures just below the onset of phase decomposition, as determined in the previous cumulative heating experiments, were initially tested. A pressure of 60 MPa was selected. In a typical process, the temperature was linearly increased up to a temperature of 100 °C below the target one in 4 min, and at the same time the pressure was increased until 50 MPa. The final temperature and pressure were then attained in another 2 min step, conditions at which the system was maintained for 5 min. Finally, the temperature was reduced to 300 °C in 2 min while the pressure was unloaded down to 50 MPa. Full unloading followed in another minute, and at the same time, room temperature was reached. The complete experiment lasted for a total of 15 min. The attained densification was measured after the experiment by the Archimedes’ method, while phases were controlled by XRD with the same equipment used to monitor the synthesis. Secondary phases appeared for x ≥ 0.5 under the initial conditions, so the final temperatures and pressures were tailored until they disappeared, while maintaining high densification (≥90%). For x = 0.75 and 1, a combination of very low temperature and high pressure is required, under which graphite dies fail, so tungsten carbide ones were used instead.
2.2. Characterization
The crystallographic symmetry and cell parameters of the obtained Aurivillius phases were investigated by XRD. This was carried out on samples with enhanced crystallinity, prepared by heating the mechanosynthesized oxides at the maximum temperature phases they can withstand before secondary ones appear. Patterns in this case were also recorded between 12 and 60° 2θ, with a reduced 2θ increment of 0.02 and an enlarged counting time of 2.7 s per step. Refinements were accomplished using a least-square method (CELREF).Ceramic capacitors for electrical characterization were prepared by painting silver electrodes on opposite faces of the sintered discs, and their subsequent sintering at a temperature equal to the maximum one to be attained during permittivity measurements, selected to surpass that of the ferroelectric transition. This was known to be ≈675 °C for Bi4Ti3O1235 and thus, 750 °C was chosen for this composition. This temperature had to be decreased as x was increased to avoid phase decomposition, so that 650 °C was used for x = 1. In the first step, the temperature dependences of the dielectric permittivity and losses were measured between room temperature (RT) and the selected maximum temperature with an Agilent E4980A LCR meter. Measurements were dynamically carried out during the heating/cooling cycle with ±1.5 °C min−1 rate at several frequencies between 100 Hz and 1 MHz. In the second step, the RT high field response was recorded under voltage sine waves of increasing amplitude up to 10 kV with frequencies between 1 and 10 Hz, obtained by the combination of a HP 3325B synthesizer/function generator and a TREK 10/40 high-voltage amplifier, while the charge was measured with a homebuilt charge to voltage converter and software for loop acquisition and analysis.
Ceramic microstructures were characterized after polishing one surface of the sintered discs with alumina suspensions of decreasing particle size down to 0.1 μm, followed by thermal etching and quenching at a temperature equal to that attained in the electrical measurements. Note that the actual values were above SPS temperatures for x = 0.75 and x = 1 and thus, the occurrence of some additional grain growth cannot be disregarded in these cases. A Philips XL 30 S-FEG FE-SEM was also used in these studies. Additional experiments were carried out for x = 1 with a NovaTM NanoSEM 230 microscope equipped with an Oxford INCA 250 energy dispersive X-ray spectrometer (EDXS), in order to control chemical homogeneity.
Piezoresponse force microscopy (PFM) experiments were also accomplished for x = 1. This is a contact mode scanning probe microscopy for characterizing ferroelectrics, based on the measurement of the local surface deformation under an alternate voltage (converse piezoelectric effect) applied between the tip and the sample. This is done as the tip is scanned to reveal polar domains, and at a fixed position as voltage is increased in steps to obtain piezoresponse hysteresis loops when polarization is locally reversed.36 The details of the experimental set-up and protocol for bulk ceramic samples can be found in ref. 37.
Finally, the magnetic response was evaluated on SPS discs. Two types of measurements were carried out. First, room temperature magnetization was measured with a KLATencorEV7a vibrating-sample magnetometer (VSM) and fields up to 18 kOe. Accuracy is estimated as 0.5 × 10⁻⁶ emu. Second, ZFC and FC responses were recorded with a Quantum Design 6000 physical property measurement system (PPMS) and a VSM between 5 K and RT under an applied field of 50 Oe. For this equipment accuracy is ±0.5%. In these measurements, the sample was previously demagnetized at RT under an alternating magnetic field, followed by cooling down to 5 K with no field. Then, a magnetic field of 50 Oe was applied, and magnetization was measured as the temperature increased up to RT (ZFC curve). Once again, the temperature was reduced until 5 K, but this time under an applied field of 50 Oe, the temperature was raised again for measuring magnetization (FC curve).
3. Results
3.1. Mechanosynthesis
As already pointed out, Aurivillius single-phase nanocrystalline phases were obtained for all cases, including x = 0.75 and 1 that had not been synthesized by high temperature solid state reactions.32 No significant differences in the mixture evolution during mechanical treatment or in the required milling times for completing the synthesis were found among samples, and 24 h was established as a suitable time to stop mechanical treatment for all cases. Phase evolution during milling is illustrated in Fig. 1 for x = 1 as an example. Severe particle size reduction takes place during the first hour of mechanical treatment, and amorphization is mostly attained after three hours, but with traces of nanocrystalline precursors. An Aurivillius phase appears on further milling, so that it is basically isolated after 18 h. No further evolution is found when mechanical treatment is prolonged up to 24 h, time at which the reaction is considered complete. The XRD patterns of all mechanosynthesized phases are provided in the ESI† (Fig. S1). The final powder consisted of submicron-sized, tight agglomerates of nanometric primary particles, as shown in Fig. 2a.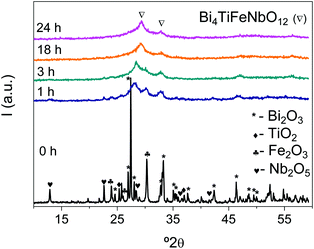 | ||
| Fig. 1 XRD patterns showing the evolution of precursors during high energy planetary milling up to the synthesis of the Aurivillius Bi4Ti3−2xNbxFexO12 phase with x = 1. | ||
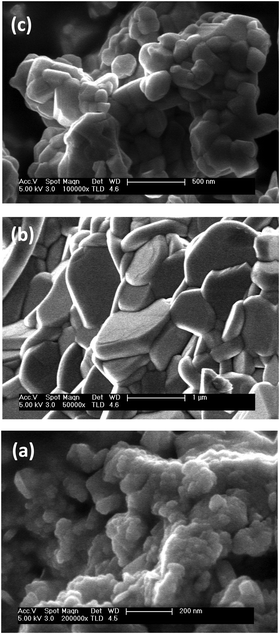 | ||
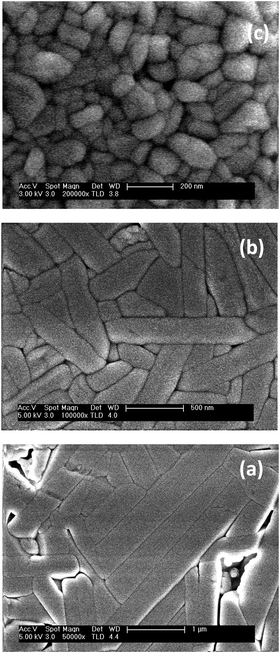
| Fig. 2 Morphology of the mechanosynthesized Aurivillius Bi4Ti3−2xNbxFexO12 phases: (a) x = 1, (b) x = 0.5 after thermal treatment at 850 °C, (c) x = 1 after treatment at 660 °C (SEM images). | ||
Neither residual precursors nor secondary phases appeared when the nanocrystalline powders were heated at increasing temperatures until Aurivillius phase decomposition, which confirmed the synthesis completion. XRD patterns of Bi4Ti1.5Nb0.75Fe0.75O12 after thermal treatments at increasing temperatures up to 700 °C, the limit above which this specific phase decomposes, are given in the ESI,† as an example (Fig. S2). This limit was not the same for all phases, but a distinctive trend with composition was observed, which decreased from 900 °C for x = 0, 0.1 and 0.25, down to 850, 700 and 660 °C for x = 0.5, 0.75 and 1, respectively. Note the step-like decrease of thermal stability between 0.5 and 0.75. We will come back to this point in the discussion.
Extensive particle growth takes place during heating, and a platelet-like morphology typical of Aurivillius phases develops. Dimensions scale with temperature and thus, maximum sizes attainable are limited by decomposition temperatures, so that particle diameters of 0.5–1.5 μm (and thickness of 0.2–0.4 μm) were obtained for x ≤ 0.5, while values as small as ∼0.2 μm (and below 0.1 μm within the nanoscale) resulted for x = 1 (see Fig. 2b and c).
3.2. Crystal structure
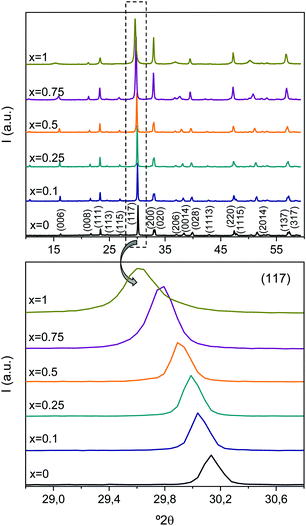
XRD patterns for all Aurivillius phases with enhanced crystallinity are shown in Fig. 3.Temperatures of the thermal treatments were the maximum ones, above which each phase decomposes, as explained before. The particle and thus, the crystal size then changed with x, so that it abruptly decreased between x = 0, 5 and 0.75 down to the verge of nanoscale. All patterns can be indexed to the Aurivillius phase with m = 3, isostructural with ferroelectric Bi4Ti3O12 that crystallizes in the non-centrosymmetric monoclinic B1a1 space group.38 Nonetheless, and as classically done for powdered samples when crystallinity is not high enough and the monoclinic distortion becomes unobservable, phases have been indexed to orthorhombic B2cb.35 The progressive shift of the peak towards smaller angles is noted, which indicates a continuous evolution of the crystal lattice, and strongly suggests the formation of an Aurivillius solid solution all across the compositional range investigated.
The cell parameters for the different phases are given in Table 1. Lattice parameter c continuously increases with x, and the same trend is found for parameters a and b up to x = 0.25. Beyond this value, b shows a step decrease at x = 0.5, above which it maintains a constant value. Regarding a, it still increases for x = 0.5, and shows the step decrease at x = 0.75, but increases again for x = 1. The calculated cell volumes are also given in the table. A continuous increase with x forms the main trend, but for x = 0.75, this shows an anomalously low value.
| x | 0 | 0.1 | 0.25 | 0.5 | 0.75 | 1 |
|---|---|---|---|---|---|---|
| T (°C) | 900 | 900 | 900 | 850 | 700 | 660 |
| a (Å) | 5.410(2) | 5.4210(8) | 5.430(1) | 5.455(5) | 5.41(1) | 5.46(2) |
| b (Å) | 5.449(2) | 5.4561(6) | 5.463(1) | 5.444(2) | 5.443(3) | 5.442(5) |
| c (Å) | 32.848(7) | 32.906(3) | 32.977(5) | 33.17(2) | 33.41(3) | 33.9(1) |
| V (Å3) | 968.2(6) | 973.3(2) | 978.2(3) | 985(1) | 984(2) | 1008(6) |
3.3. Spark plasma sintering
The as-mechanosynthesized phases without any subsequent thermal treatment were used in the first set of experiments. These types of nanocrystalline powders are characterized by nanoscale chemical homogeneity and have been shown to facilitate densification and phase control during sintering.39 Aurivillius single-phase ceramic materials with densifications between 90 and 94% were obtained for x = 0, 0.1 and 0.25 by SPS of the nanocrystalline powders at 60 MPa and 900 °C. XRD patterns are given in the ESI† (Fig. S3). The microstructure for x = 0.25 is shown in Fig. 4a, as an example. Anisometric grains typical of Aurivillius phases with long dimension between 2 and 5 μm and submicron short dimension between 0.3 and 0.8 μm were obtained. These values can be compared with the diameter and thickness of the single-crystal platelets, obtained by thermal treatment of the nanocrystalline phases in a conventional furnace at the same temperature. Note that larger values are attained for the ceramics in spite of the short processing time, which highlights the highly effective mass transport taking place during the SPS. Indeed, a bimodal grain size distribution was apparent for x = 0, which showed very large grains with long and short dimensions as high as 20–60 μm and 2–4 μm, respectively. Exaggerated grain growth also occurred for x = 0.1 and 0.25, though the percentage of large grains drastically decreased with x. Low magnification images illustrating this effect are given in the ESI† (Fig. S4).Secondary phases appeared after SPS of the mechanosynthesized phases with x = 0.5. x = 0.75 and x = 1 at 850, 700 and 660 °C and 60 MPa, respectively, so processing was tailored. Aurivillius single-phase ceramic materials with x = 0.5 could be obtained at 800 °C and 60 MPa, while materials with x = 0.75 and 1 required a further decrease in temperatures down to 600 and 500 °C, respectively, and an increase of pressure up to 200 MPa (see Fig. S3 for the XRD patterns, ESI†). Final densifications ranged between 91 and 94% but for x = 1, for which 99% was obtained. Microstructures for the ceramic materials with x = 0.5 and x = 1 are shown in Fig. 4b and c. Grain dimensions decreased with temperature, as well as anisometry, so that long and short dimensions of 1–1.5 μm and ∼0.25 μm resulted for x = 0.5, and as small as 0.15–0.25 μm and ∼0.1 μm for x = 1. Exaggerated grain growth was not observed above x = 0.25.
A highly homogeneous microstructure with no indication of secondary phases was found for all Aurivillius phases including x = 0.75 and 1 as illustrated in the ESI,† for the latter case (Fig. S5). No significant difference between the average chemical composition and that of individual grains was found, and a Bi/B ratio of 1.35 and Ti![[thin space (1/6-em)]](https://www.rsc.org/images/entities/char_2009.gif) :
:![[thin space (1/6-em)]](https://www.rsc.org/images/entities/char_2009.gif) Nb
Nb![[thin space (1/6-em)]](https://www.rsc.org/images/entities/char_2009.gif) :
:![[thin space (1/6-em)]](https://www.rsc.org/images/entities/char_2009.gif) Fe relationships of 0.95
Fe relationships of 0.95![[thin space (1/6-em)]](https://www.rsc.org/images/entities/char_2009.gif) :
:![[thin space (1/6-em)]](https://www.rsc.org/images/entities/char_2009.gif) 1.15
1.15![[thin space (1/6-em)]](https://www.rsc.org/images/entities/char_2009.gif) :
:![[thin space (1/6-em)]](https://www.rsc.org/images/entities/char_2009.gif) 0.9 were obtained that are the nominal ones within typical uncertainties of 5–10% for standardless EDXS. Note however that point analysis still averages several grains because of nanostructuring. A mapping is provided in Fig. S6 (ESI†).
0.9 were obtained that are the nominal ones within typical uncertainties of 5–10% for standardless EDXS. Note however that point analysis still averages several grains because of nanostructuring. A mapping is provided in Fig. S6 (ESI†).
Microstructural localized textures in the form of bunches of aligned anisometric grains were consistently observed for materials with x ≤ 0.25 (see Fig. 4a), which suggested the presence of a certain level of preferred crystallographic orientation. Indeed, SPS is a well-known method to obtain highly textured Aurivillius ceramic materials. This is due to the reorientation of typical platelet-like particles perpendicular to the loading during the SPS, so that a fiber-type c-preferred orientation develops.25,27 However, low Lotgering factors40 of ≈0.35 were obtained by SPS of the mechanosynthesized Aurivillius phases, most probably due to the equiaxial morphology of the initial nanoparticles. In order to explore the possibility of obtaining textured materials, a second set of SPS experiments was carried out starting from powders that had been thermally treated at the maximum possible temperature before phase decomposition, and that presented the platelet-like morphology. Same processing conditions were used, and very high densifications of 99% resulted for all compositions. Note that this implied using SPS temperatures that were equal to those of the previous thermal treatments of powders for x = 0, 0.1, 0.25, and even lower (with a difference that increased with x) for x = 0.5, 0.75 and 1. It is not unexpected then that similar microstructures to those obtained with as-mechanosynthesized phases resulted for x ≤ 0.25, along with a limited additional crystallographic texture that decreased with x: Lotgering factors of 0.47, 0.39 and 0.37 were found for x = 0, 0.1 and 0.25. Slightly coarsened microstructures were obtained for x ≥ 0.5 that actually were determined by the initial particle size (diameters of 0.15–0.2 μm and a thickness of ≈0.1 μm for x = 1). SEM images are provided in the ESI† (Fig. S7). The ability of the technique to fully densify the submicron-sized platelets with hardly grain growth in these two latter cases is remarkable, in which no additional texturing developed. This is probably a consequence of the reduced aspect ratio of the initial particles with x = 0.75 and 1, in turn caused by the decreasing temperature used to obtain them. All SPS conditions and attained densifications are listed in Table 2.
| x | 0 | 0.1 | 0.25 | 0.5 | 0.75 | 1 | |
|---|---|---|---|---|---|---|---|
| T (°C) | 900 | 900 | 900 | 800 | 600 | 500 | |
| P (MPa) | 60 | 60 | 60 | 60 | 200 | 200 | |
| d (%) | MS | 94 | 90 | 90 | 91 | 94 | 99 |
| TT | 99 | 99 | 98 | 99 | 99 | 99 | |
3.4. Electrical properties
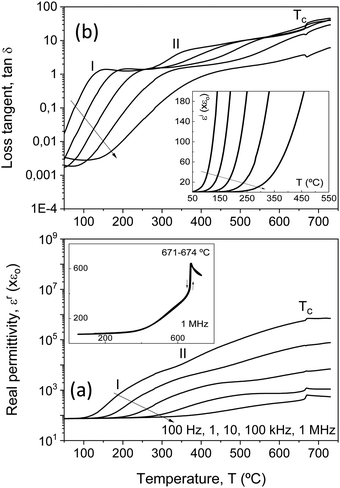
The two sets of ceramic samples, processed from either as-mechanosynthesized nanocrystalline phases or thermally treated crystalline ones, were characterized. The temperature and frequency dependences of dielectric permittivity and losses were first recorded, and significant differences between the two sets were not found. Permittivity and loss tangent values irreversibly changed during the first thermal cycling, so measurements were repeated until a reversible response was obtained, which usually required between two and three cycles. A reduction of dielectric losses resulted, which is thought to reflect the partial re-oxidation, redistribution and homogenization of oxygen vacancies introduced during the SPS.All compositions showed significant dispersion above room temperature. This is illustrated in Fig. 5 for Bi4Ti3O12, whose dielectric properties have been extensively investigated, and reflect the high conductivity.41–43 Indeed, this compound shows mixed electronic–ionic conduction, the latter an oxygen anion contribution that dominates above 600 °C.43 At moderate temperatures, from ∼100 °C onwards, p-type conductivity is observed to be associated with compensation of Bi vacancies by holes, or the presence of acceptor impurities.42 Note the inset of Fig. 5b, where the imaginary permittivity is provided at five selected frequencies directly reflecting the presence of this conductivity. Dielectric losses are proportional to the dc conductivity and scale with the reciprocal frequency.
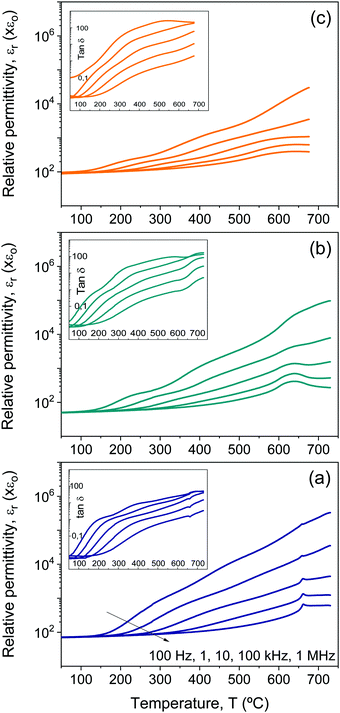
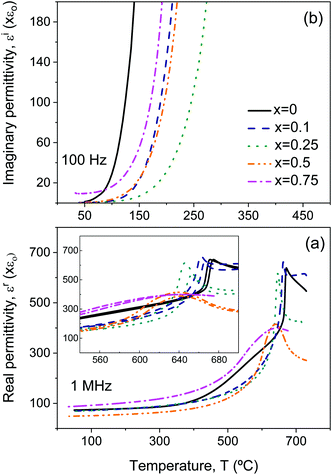
Besides conduction, Bi4Ti3O12 shows two successive dielectric relaxations before the ferroelectric transition at ≈675 °C, labelled as I and II in the figure. They are present in single-crystals44,45 and ceramics,46 and have been related to the short range movement of oxygen anions within the crystal lattice.46 Analogous relaxation phenomena are found for all the Aurivillius Bi4Ti3−2xNbxFexO12 phases with increasing x up to 0.75, as shown in Fig. 6. The main compositional effect is the decrease of the height of the step signaling the first relaxation phenomenon with x. This takes place at the same time when conductivity significantly decreases, as it is reflected by the imaginary permittivity shown in Fig. 7 at 100 Hz. Note the distinctive shift of the onset of conduction losses, which exponentially increase with temperature, towards higher temperatures when x is increased from 0 up to 0.1 and 0.25. This trend is reversed for high x, though conduction losses for x = 0.75 are still lower than those for x = 0. This indicates the reduction of the concentration of charge carriers, namely holes, with the Fe3+/Nb5+ co-substitution. An analogous effect has been described for Nb doped Bi4Ti3O12.46
Back to Bi4Ti3O12, and above the two dielectric relaxations, the dielectric anomaly associated with the first order ferroelectric transition can be observed at ≈675 °C (labelled with Tc), though overlapped with a conduction contribution. This background decreases with conduction losses as frequency increases, so that a typical ferroelectric transition peak is basically isolated at 1 MHz, as shown in the inset of Fig. 5a for the complete heating/cooling cycle illustrating thermal hysteresis. Analogous dielectric anomalies were found for all Aurivillius phases up to 0.75, as shown in Fig. 6 and 7a for the ceramic materials processed from as-mechanosynthesized nanocrystalline powders. A distinctive evolution is found between 0.25 and 0.5, so that sharp dielectric anomalies similar to that of Bi4Ti3O12 are obtained for x ≤ 0.25, while a depleted and broadened one is found for x = 0.5 and 0.75. Shifts of maxima with frequency are not found for any composition, which seems to rule out the appearance of relaxor states with increasing x.47 Note that x = 0.5 is the first composition, for which SPS was carried out at a decreased temperature and thus, ceramic shows a refined microstructure. A coarsened ceramic of this composition was obtained by SPS of thermally treated crystalline phases. Indeed, the height of the dielectric anomaly increased up to values comparable to those of x = 0.25. However, sharpness was not recovered, but the anomaly remained broadened. This shows that broadening for x ≥ 0.5 is not a microstructural but a truly compositional effect. It indicates the presence of a distribution of Curie temperatures, not necessarily associated with chemical inhomogeneities, and it is usually referred to as diffuse phase transition. Permittivity curves for the set of materials processed from thermally treated phases are provided in the ESI† (Fig. S8).
Electrical characterization of the materials with x = 1 turned out challenging, as the dielectric anomaly associated with the transition was not observed when heated up to 650 °C. Recall that 660 °C was the maximum temperature, at which this phase could be heated before phase decomposition. Measuring runs at increasing temperatures searching the transition were done, but the anomaly was not found and a progressive, irreversible decrease of the room temperature permittivity resulted that reflected the formation of secondary phases. Their presence was confirmed by XRD after the last run. The experiment, in which a maximum temperature of 725 °C was reached, is summarized in the ESI† (Fig. S9).
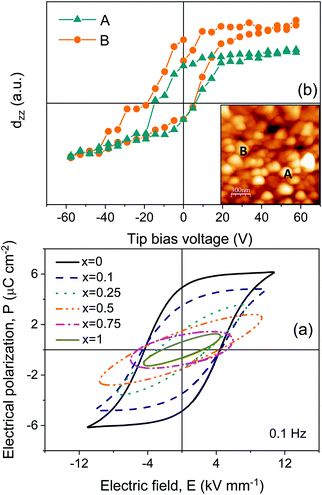
Room-temperature high field characterization, aimed at obtaining ferroelectric hysteresis loops, was also carried out for the two sets of ceramic materials, though those processed from as-mechanosynthesized nanocrystalline phases consistently showed a low dielectric strength, so that breakdown typically occurred at ∼6 kV mm−1. Not surprisingly for an Aurivillius phase typically characterized by high coercive fields, no ferroelectric switching was observed (see Fig. S10 in the ESI†). Much higher fields up to 10 kV mm−1 could be attained for materials processed from thermally treated crystalline phases, and the results are shown in Fig. 8a. Unsaturated ferroelectric hysteresis loops were recorded for x = 0 and x = 0.1. A remnant polarization of ≈5 μC cm−2 was obtained for x = 0 that decreased down to 3.5 μC cm−2 after the Fe3+/Nb5+ substitution, while the apparent coercive field remained at 4.5 kV mm−1. The dielectric strength decreased for materials with x ≥ 0.25, and ferroelectric switching was not observed. It is remarkable that switching was not found for x = 0.5 under an electric field as high as 9.5 kV mm−1. This suggests a coercive field above this value and would indicate a significant increase of this parameter with x. Indeed, materials with x = 0.25 and 0.5 showed an effective permittivity that linearly increased with the field (see Fig. S11 in the ESI†). This is a Rayleigh-type behavior, typical of ferroelectric materials in the subcoercive regime.48 Note that all materials showed dielectric anomalies typical of ferroelectric phase transitions, and that all phases apparently remained orthorhombic B2cb at RT (even though a more detailed structural analysis is required; see Discussion). Therefore, they could be expected to be ferroelectric.
To confirm the latter point, namely that all phases are ferroelectric but a coercive field is higher than the dielectric strength for x ≥ 0.25, local ferroelectricity at the microcrystal level was studied by piezoresponse force microscopy (PFM) for the ceramic material with x = 1. Indeed, the technique readily confirmed that the ceramic material was piezoactive and revealed polar domains. Besides, local piezoresponse switching could be obtained. Note that quite large bias voltages were required, even if local fields at surface grains below the tip are highly enhanced in contact mode. These results unambiguously demonstrate ferroelectricity. Amplitude and phase images showing the presence of ferroelectric domains, along with a piezoresponse loop, are shown in Fig. 8b and in the ESI† (Fig. S12).
3.5. Magnetic properties
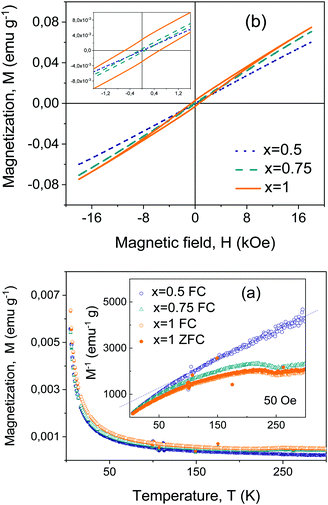
ZFC and FC magnetizations are shown in Fig. 9a for the Bi4Ti3−2xNbxFexO12 materials with x = 0.5, 0.75 and 1 from 5 K up to room temperature. Measurements were carried out on the sintered ceramic samples processed from thermally treated crystalline phases. No irreversibility was found for x = 0.5 that showed paramagnetic behavior from ∼125 K up to RT. Below this temperature, an increasing magnetization develops that progressively deviates from the extrapolated paramagnetic response, suggesting the onset of a canted magnetic order (note in the inset the reciprocal magnetization that becomes zero at a negative temperature). Irreversibility is found for x = 0.75 and 1 up to room temperature, and a paramagnetic regime cannot be identified in the measuring range. This indicates magnetic ordering that sets out above RT. Additionally, a magnetic anomaly takes place at about ∼250 K for both compositions that might be associated with some rearrangement of the magnetic order.High-field magnetizations supported the proposed scenario. The RT response up to 18 kOe is given in Fig. 9b for the same three materials. A very linear response with no hint of hysteresis was found for x ≤ 0.5, while a distinctive weak ferromagnetism developed for x = 0.75 and x = 1. Remnant magnetization increased from 0.45 × 10⁻³ up to 3.2x × 10−3 emu g−1 when x is increased from x = 0.75 up to 1, while the coercive field increased from 95.5 up to 616 Oe.
A ceramic material with x = 1, processed from as-mechanosynthesized nanocrystalline powders, was also investigated for comparison. The results are given in the ESI† (Fig. S13). A reduced weak magnetism is found. Note that this set of ceramic materials has a refined microstructure as compared with the former one, consistent with the lower preparation thermal budget, and also higher conductivity. One can assume them to have a larger concentration of defects and thus disregard the possibility of weak ferromagnetism being related to the defects.
4. Discussion
The first result of this research is the mechanosynthesis of Aurivillius Bi4Ti3−2xNbxFexO12 phases beyond x = 0.5, namely Bi4Ti1.5Nb0.75Fe0.75O12 (x = 0.75) and Bi4TiNbFe5O12 (x = 1) that had not been obtained by high temperature solid state reactions. This latter compound has a magnetic-cation fraction at the B-site of 1/3, above the threshold for percolation. Mechanochemical techniques are a powerful means of preparing nanocrystalline functional oxides, which have been extensively applied to the preparation of ferroelectric perovskites.49 Specifically, mechanosynthesis in high energy planetary mills has been shown suitable for obtaining most topical multiferroic perovskite oxides,20,50 encompassing a number of high-pressure phases.51,52 Mechanochemical activation techniques have also been applied to ferroelectric Aurivillius oxides,53 and in particular to Bi4Ti3O12.33,34 High energy planetary milling was also used in these precedents, for which highly reactive amorphous powders33 and a nanocrystalline Aurivillius phase34 were obtained, respectively. The different products related to the specific milling conditions can be rationalized with the Burgio's model54 that provides the ball-impact energy ΔEB and frequency νt for given parameters, from which the released weight-normalized cumulative kinetic energy can be readily calculated as a function of time.54 This model has been previously used to construct milling maps for the mechanosynthesis of perovskite NaNbO3.55 When applied in a previous study on Bi4Ti3O12, it suggested that a threshold ball impact energy was required to achieve the mechanosynthesis, because amorphous powders resulted in ref. 33 with ΔEB ≈ 20 mJ hit−1, while nanocrystalline Aurivillius phases were obtained in ref. 34 with ≈110 mJ hit−1. Note that time was not the issue, as the final weight-normalized cumulative kinetic energy was higher in ref. 33 than in ref. 34: 1728 kJ g−1 against 1395 kJ g−1. Therefore, and aiming at obtaining Bi4Ti3−2xNbxFexO12 phases beyond x = 0.5, milling parameters were selected to have a high ball impact energy of 520 mJ hit−1. All targeted phases up to x = 1 were mechanosynthesized, and a cumulative energy of 7440 kJ g−1 was necessary to complete the synthesis.The second result is the ceramic processing of all Aurivillius phases, which is challenging because of their tendency to decompose when heated. Recall that the maximum temperature at which phases could be thermally treated decreased as x increased, so that it was only 660 °C for x = 1. Indeed, ceramic processing for x > 0.5 was only possible by the combination of SPS and the highly reactive nanocrystalline powders obtained by mechanosynthesis. This approach had been previously demonstrated for the ceramic nanostructuring of a range of ferroelectric perovskite oxides,56 including high-sensitivity piezoelectric low tolerance factor ones,57 and it has been shown here suitable for Aurivillius phases with reduced thermal stability. Ceramic materials with submicron size microstructures were obtained, which were the key to accomplishing sound electrical characterization, and to demonstrating the persistence of ferroelectricity in the new phases.
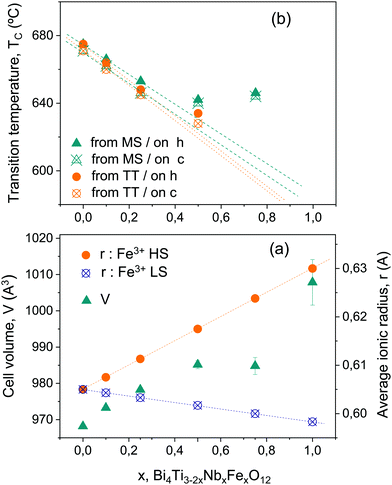
Besides, the evolution of the Aurivillius crystal structure of the Bi4Ti3−2xNbxFexO12 phases with x has been preliminary described. Though all phases have been assigned to the non-centrosymmetric orthorhombic B2cb space group, the lattice parameters suggest a change of behavior between 0.25 and 0.5. For Aurivillius phases with x between 0 and 0.25, all cell parameters and thus, volume increase with x. This is the expected trend according to the evolution of the average cationic radius at the B-site, if high spin configuration is assumed for Fe3+ as illustrated in Fig. 10a. The ionic radius for Ti4+, Nb5+ and Fe3+ in octahedral coordination was taken from Shannon's data.58 For x ≥ 0.5, errors in cell parameters progressively increase due to peak broadening (associated with the decreasing crystal size), and some scatter is evident, yet the tendency is to approach a saturation volume even if cell parameter c keeps increasing. Temperatures of phase decomposition significantly reduce for high-x values. A more detailed structural characterization would be required to gain further insight into this behavior, and a change of symmetry cannot be disregarded, yet always to a polar group because ferroelectricity persisted up to x = 1. However, it is worth noting that a reduction in average cationic radius is obtained, and thus a decrease in cell volume is expected, if Fe3+ ions were in low spin configuration (see also Fig. 10a). Therefore, results might alternatively indicate a change of Fe3+ spin configuration as x increases. Indeed, ZFC and FC magnetizations at 5 K unexpectedly decreased when x was increased from x = 0.5 to 0.75, i.e. when the amount of Fe increases, which is consistent with this scenario.
Ferroelectric ordering temperatures Tc also suggest the occurrence of structural changes between x = 0.25 and 0.5. The evolution of Tc with x, as obtained from the temperature dependence of permittivity and the position of the dielectric anomaly associated with the ferroelectric transition, is given in Fig. 10b for the two sets of ceramic materials, processed from either the as-mechanosynthesized nanocrystalline powders or the thermally treated crystalline ones. No significant differences between the two sets were found, and a distinctive change in trend was found above x = 0.25. From x = 0 up to 0.25, Tc linearly decreases with x, from a value of ≈675 °C for x = 0, in good agreement with the literature, down to ∼650 °C for x = 0.25. These are values on heating, and the thermal hysteresis typical of first order transitions is found for all compositions. Sharp dielectric anomalies are characteristics of this low-x range. For x ≥ 0.5, Tc clearly deviates from the extrapolation of the former linear behavior, so that anomalously high values are found. Indeed, the trend with x is reversed, and Tc is higher for x = 0.75 (≈645 °C) than for x = 0.5 (∼638 °C). Moreover, the Tc of x = 1 was not reached during measurements up to 725 °C. Note that PFM unambiguously demonstrated ferroelectricity at room temperature. This indicates that the hypothetical transition temperature of Bi4TiNbFe5O12 is above the maximum one reached during the electrical measurements, and actually that this phase decomposes before undergoing the transition. Broadened dielectric anomalies typical of diffuse phase transition are found in the high-x range.
Note that the reversed trend in Tc for x ≥ 0.5, along with the appearance of diffuseness in the transition, cannot be understood as a microstructural effect. This possibility was studied by processing a ceramic material in the low-x range (x = 0.25) by SPS at 600 °C and 200 MPa (the conditions used for x = 0.75), and characterizing its electrical response. The microstructure was highly refined as pretended, but the transition temperature did not change, and the anomaly remained sharp. Dielectric anomalies for materials with x = 0.25 and tailored microstructures are given in the ESI† (Fig. S14). This clearly demonstrates changes to be a truly compositional effect. Chemical inhomogeneities were not observed by EDXS, as anticipated for ceramic materials processed from phases obtained by mechanosynthesis. This technique is well known to provide nanoscale chemical homogeneity when applied to complex oxides, and specifically to perovskite solid solutions.39 Therefore, a different source of disorder must be responsible for diffuse phase transitions at high x-values, such as a fraction of Fe3+ having low spin configuration. It is worth noting that if the modification of the ferroelectric ordering characteristics was actually driven by the change of the Fe3+ spin configuration, it would reflect the presence of magnetoelectric coupling.
Last but not least, room temperature weak ferromagnetism developed for x = 0.75, and strengthened for x = 1, which have been shown to be ferroelectrics with high ordering temperatures. Therefore, both Bi4Ti1.5Nb0.75Fe0.75O12 (x = 0.75) and Bi4TiNbFe5O12 (x = 1) might be novel room temperature multiferroics, chemically designed and synthesized for the first time in this research. The magnetic order in Aurivillius oxides is known to require a threshold fraction of magnetic species at the B-site.29 This is related to the short-range character of the superexchange interactions, and the necessity of having percolation of magnetic species at the B-cation sublattice, i.e. that each magnetic species had at least one magnetic nearest neighbor. The minimal average occupation of simple cubic lattice for percolation is 0.312.59 In the case of the Bi4Ti3−2xNbxFexO12 phases, this figure was surpassed when x was increased from 0.75 up to 1 (with magnetic fractions of 1/4 and 1/3, respectively). Ordering could then be anticipated for the latter material. Note that the magnetic order is most probably antiferromagnetic, as expected from Fe3+–O2−–Fe3+ superexchange coupling. Weak ferromagnetism might arise from spin canting, as that described for BiFO3 that is linked to magnetoelectric coupling.13 Weak ferromagnetism is already observed for x = 0.75 that is below the threshold for percolation. This might indicate a role of next nearest neighbours,59 the presence of magnetic clustering, or even partitioning phenomena. The preferential presence of Fe and Mn in the three central layers has been reported for Bi6TixFeyMnzO18.60
The possible effect of magnetic second phase impurities at trace levels must be considered before weak ferromagnetism can be ascribed to the Aurivillius oxides. Indeed, a weight fraction as small as ∼0.00016 of spinel Fe3O4 could account for the remnant magnetization found for x = 1. In ref. 28, Keeney et al. carried out a statistical analysis of a large number of HR-SEM and TEM images at different magnifications for Aurivillius Bi6Ti2.8Fe1.52Mn0.68O18 thin films prepared by sol–gel, which showed no Fe3O4, and concluded that contribution to remanence from hypothetical unobserved inclusions would be <0.0028 emu g−1 with a confidence level above 99.5%. We have to accept then that we cannot unambiguously assign the obtained value of 0.0032 emu g−1 to the Aurivillius phase. Note however, that overall results show a continuous evolution of the structural and ferroelectric parameters with x, and that no secondary phases were detected by XRD or FEG-SEM/EDXS. Therefore, the synthesis of the novel Aurivillius phases with increasing magnetic cation fraction until surpassing percolation was achieved, and magnetic ordering is expected for the material with x = 1.
The objective for future work is to develop strategies to enhance magnetization, Ferromagnetic superexchange interactions could be promoted by partial substitution of Fe3+ by a second magnetic species like Co3+ or Mn3+, approach that has been successfully applied to Aurivillius phases with m = 4 and 5.23,26 The ferroelectric coercive field must be also decreased, and at the same time, the dielectric strength improved. Substitution of La3+ for Bi3+ in Bi4Ti3O12 is known to decrease both the coercive field and conductivity, so that Bi3.25La0.75Ti3O12 thin films have been extensively investigated for memories.24 Both approaches were recently combined in ref. 61, where Bi3.25La0.75Ti2.5Nb0.25(Fe0.5Co0.5)0.25O12 was prepared and characterized. Low temperature ferromagnetism was observed, even though the magnetic fraction was only 1/12. This supports the possible role of magnetic clustering, as already suggested for Bi4Ti1.5Nb0.75Fe0.75O12.
5. Conclusions
Mechanical treatment in high energy planetary mills has been shown to be an adequate technique to mechanosynthesize nanocrystalline Aurivillius Bi4Ti3−2xNbxFexO12 phases with x increasing up to a value as high as 1, which has not been obtained before and corresponds to a magnetic fraction at the B-site of 1/3. This is above the threshold for percolation of Fe3+, and magnetic ordering is anticipated. XRD patterns were preliminary indexed to Aurivillius orthorhombic B2cb for all phases, though the evolution of the lattice parameters with x indicates a structural modification between 0.25 and 0.5 that is consistent with a change in the Fe3+ spin configuration. High-x phases are unstable under moderate heating, and ceramic processing was only possible by spark plasma sintering of the nanocrystalline phases obtained by mechanosynthesis. Dense, submicron-structured materials with low crystallographic textures were obtained, suitable for carrying out a full electrical characterization. All phases were found to be ferroelectric with high ordering temperature. Its evolution with x was obtained, and a distinctive trend change was revealed for x > 0.5. Weak ferromagnetism was found for Bi4TiNbFeO12 (x = 1), which is proposed to be a novel room temperature multiferroic.Conflicts of interest
There are no conflicts to declare.Acknowledgements
Research is funded by Spanish MICINN through project MAT2017-88788-R. Technical support by Ms I. Martínez, at ICMM-CSIC is also acknowledged.References
- N. A. Spaldin and M. Fiebig, The renaissance of magnetoelectric multiferroics, Science, 2005, 309, 391–392 CrossRef CAS PubMed.
- W. Eerenstein, N. D. Mathur and J. F. Scott, Multiferroic and magnetoelectric materials, Nature, 2006, 442, 759–765 CrossRef CAS PubMed.
- T. Zhao, A. Scholl, F. Zavaliche, K. Lee, M. Barry, A. Doran, M. P. Cruz, Y. H. Chu, C. Ederer, N. A. Spaldin, R. R. Das, D. M. Kim, S. H. Baek, C. B. Eom and R. Ramesh, Electrical control of antiferromagnetic domains in multiferroic BiFeO3 films at room temperature, Nat. Mater., 2006, 5, 823–829 CrossRef CAS PubMed.
- M. Bibes and A. Barthelemy, Multiferroics: towards a magnetoelectric memory, Nat. Mater., 2009, 7, 425–426 CrossRef PubMed.
- S. Fusil, V. Garcia, A. Barthelemy and M. Bibes, Magnetoelectric devices for spintronics, Ann. Rev. Mater. Res., 2014, 4, 91–116 CrossRef.
- N. A. Spaldin and R. Ramesh, Advances in magnetoelectric multiferroics, Nat. Mater., 2019, 18, 203–212 CrossRef CAS PubMed.
- S. W. Cheong and M. Mostovoy, Multiferroics: a magnetic twist for ferroelectricity, Nat. Mater., 2007, 6, 13–20 CrossRef CAS PubMed.
- T. Kimura, T. Goto, H. Shintani, K. Ishizaka, T. Arima and Y. Tokura, Magnetic control of ferroelectric polarization, Nature, 2003, 426, 55–58 CrossRef CAS PubMed.
- N. Hur, S. Park, P. A. Sharma, J. S. Ahn, S. Guha and S. W. Cheong, Electric polarization reversal and memory in a multiferroic material induced by magnetic fields, Nature, 2004, 429, 392–395 CrossRef CAS PubMed.
- Y. Kitagawa, Y. Hiraoka, T. Honda, T. Ishikura, H. Nakamura and T. Kimura, Low-field magnetoelectric effect at room temperature, Nat. Mater., 2010, 9, 797–802 CrossRef CAS PubMed.
- K. Zhai, D. S. Shang, Y. S. Chai, G. Li, J. W. Cai, B. G. Shen and Y. Sun, Room-temperature nonvolatile memory based on a single-phase multiferroic hexaferrite, Adv. Funct. Mater., 2018, 28, 1705771 CrossRef.
- J. Wang, J. B. Neaton, H. Zheng, V. Nagarajan, S. B. Ogale, B. Liu, D. Viehland, V. Vaithyanathan, D. G. Schlom, U. V. Waghmare, N. A. Spaldin, K. M. Rabe, M. Wuttig and R. Ramesh, Epitaxial BiFeO3 multiferroic thin film heterostructures, Science, 2003, 299, 1719–1722 CrossRef CAS PubMed.
- G. Catalan and J. F. Scott, Physics and applications of bismuth ferrite, Adv. Mater., 2009, 21, 2463–2485 CrossRef CAS.
- V. A. Khomchenko, D. A. Kiselev, J. M. Vieira, L. Jian, A. L. Kholkin, A. M. L. Lopes, Y. G. Pogorelov, J. P. Araujo and M. Maglione, Effect of diamagnetic Ca, Sr, Pb and Ba substitution on the crystal structure and multiferroic properties of the BiFeO3 perovskite, J. Appl. Phys., 2008, 103, 024105 CrossRef.
- T. J. Park, G. C. Papaefthymiou, A. J. Viescas, A. R. Moodenbaugh and S. S. Wong, Size-dependent magnetic properties of single-crystalline mutiferroic BiFO3, Nano Lett., 2007, 7, 766–772 CrossRef CAS PubMed.
- F. M. Bai, J. L. Wang, M. Wuttig, J. F. Li, N. G. Wang, A. P. Pyatakov, A. K. Zvezdin, L. E. Cross and D. Viehland, Destruction of spin cycloid in (111)c-oriented BiFeO3 thin films by epitaxial constraint: enhanced polarization and release of latent magnetization, Appl. Phys. Lett., 2005, 86, 032511 CrossRef.
- J. T. Heron, J. L. Bosse, Q. He, Y. Gao, M. Trassin, L. Ye, J. D. Clarkson, C. Wang, J. Liu, S. Salahuddin, D. C. Ralph, D. G. Schlom, J. Iñiguez, B. D. Huey and R. Ramesh, Deterministic switching of ferromagnetism at room temperature using an electric field, Nature, 2014, 516, 370–375 CrossRef CAS PubMed.
- P. Mandal, M. J. Pitcher, J. Alaria, H. Niu, P. Borisov, P. Stamenov, J. B. Claridge and M. J. Rosseinsky, Designing switchable polarization and magnetization at room temperature in an oxide, Nature, 2015, 525, 363–367 CrossRef CAS PubMed.
- O. Dieguez and J. Iñiquez, First-principles investigation of morphotropic transitions and phase-change functional responses in BiFeO3–BiCoO3 multiferroic solid solutions, Phys. Rev. Lett., 2011, 107, 057601 CrossRef PubMed.
- C. M. Fernández-Posada, A. Castro, J. M. Kiat, F. Porcher, O. Peña, M. Algueró and H. Amorín, A novel perovskite oxide chemically designed to show multiferroic phase boundary with room-temperature magnetoelectricity, Nat. Commun., 2016, 7, 12772 CrossRef PubMed.
- D. M. Evans, A. Schilling, A. Kumar, D. Sanchez, N. Ortega, M. Arredondo, R. S. Katiyar, J. M. Gregg and J. F. Scott, Magnetic switching of ferroelectric domains at room temperature in multiferroic PZTFT, Nat. Commun., 2013, 4, 1534 CrossRef CAS PubMed.
- L. F. Henrichs, O. Cespedes, J. Bennett, J. Landers, S. Salamon, C. Heuser, T. Hansen, T. Helbig, O. Gutfleisch, D. C. Lupascu, H. Wende, W. Kleemann and A. J. Bell, Multiferroic clusters: a new perspective for relaxor-type room-temperature multiferroics, Adv. Funct. Mater., 2016, 26, 2111–2121 CrossRef CAS.
- A. Faraz, T. Maity, M. Schmidt, N. DeepakS. Roy, M. E. Pemble, R. W. Whatmore and L. Keeney, Direct visualization of magnetic-field-induced magnetoelectric switching in multiferroic Aurivillius phase thin films, J. Am. Ceram. Soc., 2017, 100, 975–987 CrossRef CAS.
- B. H. Park, B. S. Kang, S. D. Bu, T. W. Noh, J. Lee and W. Jo, Lanthanum-substituted bismuth titanate for use in non-volatile memories, Nature, 1999, 401, 682–684 CrossRef CAS.
- H. X. Yan, H. T. Zhang, R. Ubic, M. J. Reece, J. Liu, Z. J. Shen and Z. Zhang, A lead-free high-Curie-point ferroelectric ceramic, CaBi2Nb2O9, Adv. Mater., 2005, 17, 1261–1265 CrossRef CAS.
- X. Mao, W. Wang, X. Chen and Y. Lu, Multiferroic properties of layer-structured Bi5Fe0.5Co0.5Ti3O15, Appl. Phys. Lett., 2009, 95, 082901 CrossRef.
- Z. Li, J. Ma, Z. P. Gao, G. Viola, V. Koval, A. Mahajan, X. Li, C. L. Jia, C. W. Nan and H. X. Yan, Room temperature magnetoelectric coupling in intrinsic multiferroic Aurivillius phase textured ceramics, Dalton Trans., 2016, 45, 14049–14052 RSC.
- L. Keeney, T. Maity, M. Schmidt, A. Amann, N. Deepak, N. Petkov, S. Roy, M. E. Pemble and R. W. Whatmore, Magnetic field-induced ferroelectric switching in multiferroic Aurivillius phase thin films at room temperature, J. Am. Ceram. Soc., 2013, 96, 2339–2357 CrossRef CAS.
- A. Y. Birenbaum, A. Scaramucci and C. Ederer, Magnetic order in four-layered Aurivillius phases, Phys. Rev. B, 2017, 95, 104419 CrossRef.
- W. Gu, X. Li, S. Sun, L. Zhu, Z. Fu and Y. Lu, Magnetocrystalline anisotropy in the Co/Fe codoped Aurivillius oxide with different perovskite layer number, J. Am. Ceram. Soc., 2018, 101, 2417–2427 CrossRef CAS.
- M. Tripathy, R. Mani and J. Gopalakrishnan, New Substitutions and novel derivatives of the Aurivillius phases Bi5TiNbWO15 and Bi4Ti3O12, Mater. Res. Bull., 2007, 42, 950–960 CrossRef CAS.
- C. Lavado and M. G. Stachiotti, Fe3+/Nb5+ co-doping effects on the properties of Aurivillius Bi4Ti3O12 ceramics, J. Alloys Compd., 2018, 731, 914–919 CrossRef CAS.
- J. G. Lisoni, P. Millan, E. Vila, J. L. M. de Vidales, T. Hoffmann and A. Castro, Synthesis of ferroelectric Bi4Ti3O12 by alternative routes: wet no-coprecipitation chemistry and mechanochemical activation, Chem. Mater., 2001, 13, 2084–2091 CrossRef CAS.
- K. Han and T. Ko, Synthesis and phase formation of ferroelectric Bi4Ti3O12 nanopowder by mechanical alloying, J. Alloys Compd., 2009, 473, 490–495 CrossRef CAS.
- R. Newnam, R. Wolfe and J. Dorrian, Structural basis of ferroelectricity in the bismuth titanate family, Mater. Res. Bull., 1971, 6, 1029–1040 CrossRef.
- A. Gruverman, O. Auciello and H. Tokumoto, Imaging and control of domain structures in ferroelectric thin films via scanning force microscopy, Ann. Rev. Mater. Sci., 1998, 28, 101–123 CrossRef CAS.
- N. Salazar, M. Algueró, H. Amorín, A. Castro, A. Gil and J. Ricote, Local characterization of nanostructured high sensitivity piezoelectric BiScO3–PbTiO3 ceramics by piezoresponse force microscopy, J. Appl. Phys., 2014, 116, 124108 CrossRef.
- A. D. Rae, J. G. Thompson, R. L. Whiters and A. C. Willis, Structure refinement of commensurately modulated bismuth titanate Bi4Ti3O12, Acta Crystallogr., Sect. B: Struct. Sci., 1990, 46, 474–487 CrossRef.
- E. Berganza, C. Pascual-González, H. Amorín, A. Castro and M. Algueró, Point defect engineering of high temperature piezoelectric BiScO3–PbTiO3 for high power operation, J. Eur. Ceram. Soc., 2016, 36, 4039–4048 CrossRef CAS.
- F. K. Lotgering, Topotactical reactions with ferromagnetic oxides having hexagonal crystal structures, J. Inorg. Nucl. Chem., 1959, 9, 113–123 CrossRef CAS.
- S. K. Kim, M. Miyayama and H. Yanagida, Electrical anisotropy and a plausible explanation for dielectric anomaly of Bi4Ti3O12 single crystal, Mater. Res. Bull., 1996, 31, 121–131 CrossRef CAS.
- H. S. Shulman, M. Testorf, D. Damjanovic and N. Setter, Microstructure, electrical conductivity, and piezoelectric properties of bismuth titanate, J. Am. Ceram. Soc., 1996, 79, 3124–3128 CrossRef CAS.
- M. Takahashi, Y. Noguchi and M. Miyayama, Estimation of ionic and hole conductivity in bismuth titanate polycrystals at high temperatures, Solid State Ionics, 2004, 172, 325–329 CrossRef CAS.
- A. Fouskova and L. E. Cross, Dielectric properties of bismuth titanate, J. Appl. Phys., 1970, 41, 2834–2838 CrossRef CAS.
- M. Takahashi, Y. Noguchi and M. Miyayama, Electrical conduction mechanism in Bi4Ti3O12 single crystal, Jpn. J. Appl. Phys., 2002, 41, 7053–7056 CrossRef CAS.
- H. S. Shulman, D. Damjanovic and N. Setter, Niobium doping and dielectric anomalies in bismuth titanate, J. Am. Ceram. Soc., 2000, 83, 528–532 CrossRef CAS.
- A. A. Bokov and Z. G. Ye, Recent progress in relaxor ferroelectrics with perovskite structure, J. Mater. Sci., 2006, 41, 31–52 CrossRef CAS.
- P. Bintachitt, S. Jesse, D. Damjanovic, Y. Han, I. M. Reaney, S. Trolier-McKinstry and S. V. Kalinin, Collective dynamics underpins Rayleigh behavior in disordered polycrystalline ferroelectrics, Proc. Natl. Acad. Sci. U. S. A., 2010, 107, 7219–7224 CrossRef CAS PubMed.
- L. B. Kong, T. S. Zhang, J. Ma and F. Boey, Progress in synthesis of ferroelectric ceramic materials via high-energy mechanochemical technique, Prog. Mater. Sci., 2008, 53, 207–322 CrossRef CAS.
- C. Correas, T. Hungría and A. Castro, Mechanosynthesis of the whole xBiFeO3-(1−x)PbTiO3 multiferroic system: structural characterization and study of phase transitions, J. Mater. Chem., 2011, 21, 3125–3132 RSC.
- A. Moure, T. Hungría, A. Castro, J. Galy, O. Peña, J. Tartaj and C. Moure, Mechanosynthesis of the orthorhombic Perovskites ErMn1−xNixO3 (x = 0, 0.1). Processing and characterization of nanostructured ceramics, Chem. Mater., 2010, 22, 2908–2915 CrossRef CAS.
- A. Castro, C. Correas, O. Peña, A. R. Landa-Cánovas, M. Algueró, H. Amorín, M. Dollé, E. Vila and T. Hungría, Nanostructured BiMnO3+δ obtained at ambient pressure: analysis of its multiferroicity, J. Mater. Chem., 2012, 22, 9928–9938 RSC.
- A. Castro, P. Millan, L. Pardo and B. Jimenez, Synthesis and sintering improvement of Aurivillius type structure ferroelectric ceramics by mechanochemical activation, J. Mater. Chem., 1999, 9, 1313–1317 RSC.
- N. Burgio, A. Iasonna, M. Magini, S. Martelli and F. Padella, Mechanical alloying of the Fe–Zr system: correlation between input energy and end products, Nuovo Cimento, 1990, 13D, 459–476 Search PubMed.
- T. Rojac, M. Kosec, B. Malic and J. Holc, The application of a milling map in the mechanochemical synthesis of ceramic oxides, J. Eur. Ceram. Soc., 2006, 26, 3711–3716 CrossRef CAS.
- T. Hungria, J. Galy and A. Castro, Spark plasma sintering as a useful technique to the nanostructuration of piezo-ferroelectric materials, Adv. Eng. Mater., 2009, 11, 615–631 CrossRef CAS.
- T. Hungria, H. Amorin, J. Galy, J. Ricote, M. Alguero and A. Castro, Nanostructured ceramics of 0.92PbZn1/3Nb2/3O3-0.08PbTiO3 processed by SPS of nanocrystalline powders obtained by mechanosynthesis, Nanotechnol., 2008, 19, 155609 CrossRef CAS PubMed.
- R. D. Shannon, Revised effective ionic radii and systematic studies of interatomic distances in halides and chalcogenides, Acta Crystallogr., Sect. A: Cryst. Phys., Diffr., Theor. Gen. Crystallogr., 1976, 32, 751–767 CrossRef.
- L. Kurzawski and K. Malarz, Simple cubic random-site percolation thresholds for complex neighbourhoods, Rep. Math. Phys., 2012, 70, 163–169 CrossRef.
- L. Keeney, C. Downing, M. Schmidt, M. E. Pemble, V. Nicolosi and R. W. Whatmore, Direct atomic scale determination of magnetic ion partition in a room temperature multiferroic material, Sci. Rep., 2017, 7, 1737 CrossRef PubMed.
- Z. Li, K. Tao, J. Ma, Z. P. Gao, V. Koval, C. J. Jiang, G. Viola, H. F. Zhang, A. Mahajan, J. Cao, M. Cain, I. Abrahams, C. W. Nan, C. L. Jia and H. X. Yan, Bi3.25La0.75Ti3−2xNbx(Fe0.5Co0.5)xO12, a single phase room temperature multiferroic, J. Mater. Chem. C, 2018, 6, 2733–2740 RSC.
Footnote |
| † Electronic supplementary information (ESI) available. See DOI: 10.1039/d0tc03210g |
| This journal is © The Royal Society of Chemistry 2020 |

