 Open Access Article
Creative Commons Attribution 3.0 Unported Licence
Quantitative vibrational spectroscopy on liquid mixtures: concentration units matter†
Henk-Jan
van Manen
 *ab,
Jan
Gerretzen
a,
Martijn
Smout
a,
Geert
Postma
b and
Jeroen J.
Jansen
 b
b
aNouryon Chemicals B.V., Expert Capability Group Measurement & Analytical Science, Zutphenseweg 10, 7418 AJ Deventer, The Netherlands. E-mail: henkjan.vanmanen@ru.nl
bRadboud University, Institute for Molecules and Materials, Department of Analytical Chemistry & Chemometrics, Heyendaalseweg 135, 6525 AJ Nijmegen, The Netherlands
First published on 29th March 2021
Abstract
Quantitative vibrational absorption spectroscopies rely on Beer's law relating spectroscopic intensities in a linear fashion to chemical concentrations. To address and clarify contrasting results in the literature about the difference between volume- and mass-based concentrations units used for quantitative spectroscopy on liquid solutions, we performed near-infrared, mid-infrared, and Raman spectroscopy measurements on four different binary solvent mixtures. Using classical least squares (CLS) and partial least squares (PLS) as multivariate analysis methods, we demonstrate that spectroscopic intensities are linearly related to volume-based concentration units rather than more widely used mass-based concentration units such as weight percent. The CLS results show that the difference in root mean square error of prediction (RMSEP) values between CLS models based on mass and volume fractions correlates strongly with the density difference between the two solvents in each binary mixture. This is explained by the fact that density differences are the source of non-linearity between mass and volume fractions in such mixtures. We also show that PLS calibration handles the non-linearity in mass-based models by the inclusion of additional latent variables that describe residual spectroscopic variation beyond the first latent variable (e.g., due to small peak shifts), as observed in the experimental data of all binary solvent mixtures. Using simulation studies, we have quantified the relative errors (up to 10–15%) that are made in PLS modeling when using mass fractions instead of volume fractions. Overall, our results provide conclusive evidence that concentration units based on volume should be preferred for optimal spectroscopic calibration results in academic and industrial practice.
1 Introduction
Mid-infrared (MIR), near-infrared (NIR), and Raman spectroscopy are powerful and common techniques in both qualitative and quantitative analytical chemistry, with widespread applications in academic, medical, and industrial environments.1 For absorption spectroscopies, successful quantitative applications of these vibrational techniques rely mostly on Beer's well-known law relating spectroscopic intensity (e.g., absorbance) to chemical concentration, and for Raman spectroscopy there is also a linear relation between Raman intensities and concentration.2 The calibration process typically involves samples with known analyte concentrations, as measured by a reference method, and the use of multivariate data analysis techniques such as partial least squares (PLS) or multiple linear regression (MLR) to establish the quantitative relationship between spectra and concentrations.3,4 These regression techniques are linear in nature and therefore work best when the assumed linear relationship between spectroscopic intensity and concentration holds.By and large, weight percent (wt%) is the concentration unit that is most often used for quantitative spectroscopic calibration in industrial practice and the scientific literature. However, Mark et al. demonstrated that NIR absorbance spectra are in fact linearly related to volume fractions of the various components of a mixture.5,6 Because volume- and mass-based concentration units are not necessarily related to each other in a linear fashion, the use of wt% may lead to substantially larger calibration errors than volume-based units. Recent work by Yan et al. contradicted the results of Mark et al. by reporting similar performance between mass- and volume-based multivariate calibration models for quantitative NIR and Raman spectroscopy on ternary solvent mixtures.7
To address these contrasting conclusions and clarify this issue of broad importance to analytical chemists, we here provide conclusive evidence that NIR, MIR, and Raman spectroscopic intensities are linearly related to volume-based concentration units. Using both experimental data on four different binary solvent mixtures and simulations, classical least squares (CLS) and PLS analysis shows that the difference in calibration errors between models based on mass or volume fractions correlates strongly with the density difference between the two solvents in each binary mixture. Under certain conditions (e.g., large density differences between solvents and high analyte concentrations), relative calibration errors of 10–15% are introduced by using mass rather than volume fractions as concentration unit. PLS regression shows that non-linearity due to the use of mass fractions leads to the inclusion of additional latent variables (LVs) in the PLS models. Such additional LVs make use of the non-linear residual spectroscopic variation beyond LV1, originating mainly from small peak shifts present in all investigated binary solvent systems. Our results demonstrate that concentration units based on volume are preferred over mass-based units for accurate quantitative spectroscopy on liquid systems.
2 Experimental
2.1 Sample preparation
Table 1 shows the binary liquid systems that were investigated in this study. For each system, 30 samples spanning the full compositional range (mass or volume fraction 0–1; see ESI† for compositional details) were prepared by gravimetric dosing of pure solvents into 40 mL glass vials using a high-throughput robotic system (Syntegon Technology GmbH, Waiblingen, Germany, formerly known as Bosch Packaging Technology), followed by vial capping and 60 s mixing in an orbital mixer. Of these 30 samples per binary system, 21 samples were used for development of calibration models and 9 samples were used as independent test samples for evaluation of model performance (e.g., root mean square error of prediction (RMSEP) values).| System | Comp. 1 densitya (kg L−1) | Comp. 2 densitya (kg L−1) | Δρ (kg L−1) | V E at x1 = 0.5 (cm3 mol−1) |
|---|---|---|---|---|
| a CRC Handbook of Chemistry and Physics, 72nd ed.; Boca Raton, FL, 1991–1992. | ||||
| 1 | Chloroform 1.4832 | Heptane 0.6837 | 0.80 | +0.50 (ref. 8) |
| 2 | Chloroform 1.4832 | Toluene 0.8669 | 0.62 | +0.06 (ref. 9) |
| 3 | Toluene 0.8669 | Heptane 0.6837 | 0.18 | +0.15 (ref. 10) |
| 4 | MEK 0.8054 | Heptane 0.6837 | 0.12 | +0.80 (ref. 11) |
2.2 Instrumentation
NIR measurements were performed on a Bruker MPA instrument (Bruker Optics, Ettlingen, Germany) in transmission mode using sample vials (inner diameter 6.5 mm) kept at 27.5 ± 0.5 °C and the following acquisition settings: resolution 8 cm−1, 16 scans per spectrum. A background spectrum was recorded before each series of 30 samples per binary system. Raman measurements were performed on a Kaiser RXN-4 instrument (Kaiser Optical Systems, Inc., Ann Arbor, MI) by using a fiber-optic probe head coupled to a microscope objective (Leica HCX PL Fluotar, 50×/0.55 NA, long working distance of 8 mm) to focus the excitation beam (λexc = 785 nm) through the glass wall of the sample vials. Acquisition settings: 10 s acquisition time per spectrum (5 accumulations of each 2 s); cosmic ray filtering and dark subtraction were both applied. The NIR and Raman measurements were automated by integration of the above-mentioned spectrometers into a high-throughput Lipos plat-form (Zinsser Analytic GmbH, Frankfurt, Germany) programmed by WinLissy 8.1 software. MIR measurements were performed manually on a Spectrum 100 instrument (PerkinElmer, Groningen, The Netherlands) in ATR mode (diamond crystal) with the following settings: resolution 4 cm−1 (spectral point spacing 1 cm−1), 16 scans per spectrum. A background measurement was recorded before each series of 30 samples per binary system. Evaporation of liquid on the ATR crystal was prevented by positioning a spacer around the ATR crystal and filling the resulting well with enough liquid sample. MIR ATR spectra were corrected for refractive index-dependent optical penetration depths using the “extended ATR correction” in Bruker OPUS software 7.5, with known refractive index values for the pure components and using the Arago-Biot equation for calculating the refractive index values of the mixtures.2.3 Software
All data analyses were performed using MATLAB R2019b (The MathWorks, Natick, MA). CLS regression and 2D correlation spectroscopy (2D-COS) were performed with MATLAB routines developed in-house. Principal component analysis (PCA) and PLS regression were performed using PLS_Toolbox 8.8 software (Eigenvector Research, Inc., Manson, WA) running under MATLAB.2.4 Data analysis
The following spectral regions were used for analysis: NIR, 6400–10![[thin space (1/6-em)]](https://www.rsc.org/images/entities/char_2009.gif) 200 cm−1; Raman, 250–1150 cm−1 (with slight variations per binary system); MIR, 600–1700 cm−1 (with slight variations per binary system), except for the chloroform–heptane system which was analyzed in the spectral region 1150–1550 cm−1. CLS coefficients were calculated for each binary component by using the pure component spectra and a variable 0th order baseline offset to fit the mixture spectra of each binary system. The resulting coefficients of the 21 calibration samples were subsequently regressed against the known mass and volume fractions of each component to calculate RMSECV values (using 7-fold Venetian blinds as cross-validation method). The regression models were then used to calculate RMSEP values for the 9 independent samples. For PCA, PLS, and 2D-COS, all spectra (NIR, Raman, MIR) were pre-processed by Savitzky–Golay 1st derivative (2nd order, filter width 15 points for NIR and 9 points for Raman and MIR) followed by mean centering.
200 cm−1; Raman, 250–1150 cm−1 (with slight variations per binary system); MIR, 600–1700 cm−1 (with slight variations per binary system), except for the chloroform–heptane system which was analyzed in the spectral region 1150–1550 cm−1. CLS coefficients were calculated for each binary component by using the pure component spectra and a variable 0th order baseline offset to fit the mixture spectra of each binary system. The resulting coefficients of the 21 calibration samples were subsequently regressed against the known mass and volume fractions of each component to calculate RMSECV values (using 7-fold Venetian blinds as cross-validation method). The regression models were then used to calculate RMSEP values for the 9 independent samples. For PCA, PLS, and 2D-COS, all spectra (NIR, Raman, MIR) were pre-processed by Savitzky–Golay 1st derivative (2nd order, filter width 15 points for NIR and 9 points for Raman and MIR) followed by mean centering.
3 Results and discussion
3.1 Selection of binary systems and their spectroscopic analysis
Scheme 1 shows the experimental design that we used to address the contrasting conclusions reached by Mark et al.5,6 and Yan et al.7 with respect to the difference between volume- and mass-based concentration units as reference data for multivariate calibration. The components of the four binary liquid mixtures shown in Table 1 were selected to provide a broad range of density differences and therefore a varying degree of non-linearity between mass and volume fractions.Moreover, the selected components are apolar and lack protic moieties such as OH groups, thereby preventing strong non-covalent interactions such as hydrogen bonds with pronounced and complex effects on vibrational spectra,12–14 which is undesirable for this study. Furthermore, by taking literature values for the excess molar volumes of these systems (Table 1), we calculated a relative volume change due to non-ideality of 0.33 ± 0.29% (average ±1 s for the 4 systems) at equimolar concentrations. The degree of volume non-ideality is therefore small for these binary systems, hence this effect was not further taken into account in this study.
Before discussing the CLS and PLS calibration results in the following sections, we first present results from analysis of the mixture spectra themselves. Despite the relatively strong ideality of the selected systems, small but significant spectral non-ideality was observed in the NIR, Raman, and MIR spectra of all mixtures. This is exemplified in Fig. 1, which shows the results of PCA and 2D correlation spectroscopy (2D-COS) analysis15,16 for the NIR calibration spectra of the chloroform–toluene system. The plots of PCA scores (showing a concave curve) and loadings, as well as the characteristic pattern observed in the asynchronous 2D-COS plot,17 are indicative of NIR peak shifts as a function of chloroform–toluene composition. Using PCA, PC1 and PC2 were found to explain 98.67 ± 0.89% and 1.20 ± 0.85% (average ±1 s) of the spectral variance, respectively, for all systems combined excluding the MIR data on the chloroform–toluene system (which showed 90.60% and 5.92% variance explained by PC1 and PC2, respectively). Similar to these results, spectroscopic non-ideality is the rule rather than the exception for reported vibrational studies on liquid mixtures, even in seemingly ideal systems such as methanol–ethanol18,19 and binary aliphatic or aromatic hydrocarbon systems (e.g., benzene–toluene and n-hexane–n-heptane),20 and PCA has recently been proposed as a powerful tool for unsupervised screening of non-ideal mixtures.21 Spectral non-ideality results are generally interpreted as providing evidence for the existence of microheterogeneity (i.e., homo- and heteroclusters) at the molecular level in mixtures.18–20
Excess spectroscopy13 is another powerful tool to reveal non-ideal features in spectroscopic data on liquid mixtures. An excess spectrum εE (expressed as an absorption coefficient spectrum) is the difference between the measured spectrum of a mixture and that of the respective ideal mixture under identical conditions, and can be calculated as follows:13
 | (1) |
 and
and  are the molar absorption coefficients of the two components in their pure states, respectively.
To compare the degree of spectroscopic non-ideality for different liquid mixtures, Wrzeszcz et al.19 have defined the excess parameter ER as:
 | (2) |
| System | ER (%) NIR | ER (%) Raman | ER (%) MIR |
|---|---|---|---|
| Chloroform–heptane | 2.16 | 20.26 | 16.38 |
| Chloroform–toluene | 19.85 | 6.58 | 22.73 |
| Toluene–heptane | 5.75 | 7.97 | 15.67 |
| MEK–heptane | 6.63 | 10.53 | 16.88 |
3.2 CLS calibration results
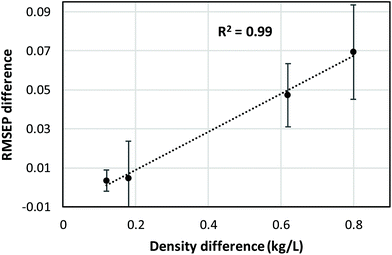
CLS calibration was performed on the 12 investigated data sets (4 binary systems, each measured by NIR, Raman, and MIR spectroscopy) in order to directly compare our results with those obtained by Mark et al.5,6 and by Yan et al.,7 who also reported CLS results in their studies (see Data analysis section 2.4 for details about the CLS analyses). The clear difference between mass- and volume-based models obtained in this fashion is exemplified by the Raman results for the chloroform–heptane system shown in Fig. 2. Very strong non-linearity in the predicted versus measured plot is observed for the mass-based model (Fig. 2A), leading to a large RMSEP value for predicted mass fraction, whereas the volume-based model is much more linear in nature and therefore exhibits a much lower RMSEP value for predicted volume fraction (Fig. 2B). This confirms the NIR results reported by Mark et al.5,6 and proves that Raman spectroscopic intensities in liquid solutions are also linearly sensitive to volume-based concentration units. An overview of all CLS results, expressed as RMSEP values, is shown in Fig. 3. We observed that all 3 spectroscopic techniques show deviations from Beer's law when using mass fractions as concentration unit. However, the non-linearity and therefore RMSEP difference between mass- and volume-based models was found to decrease in going from systems with a high density difference between both components (e.g., chloroform–heptane) to systems with a low density difference such as MEK–heptane (see also Table 1). In fact, when averaging the RMSEP difference results (RMSEPmass − RMSEPvolume) over the 3 spectroscopic techniques, we found a strong dependence of the RMSEP on the density difference between solvents, as shown in Fig. 4, where the estimated RMSEP converges to zero for solvents of equal density.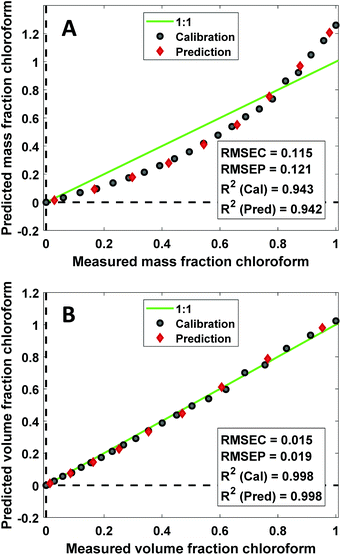 | ||
| Fig. 2 Predicted vs. measured plots obtained from linear regression of Raman CLS coefficients against mass (A) and volume (B) fraction of chloroform for the chloroform–heptane binary system. | ||
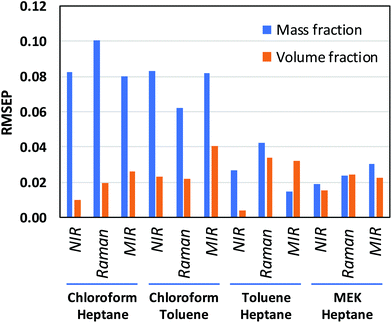 | ||
| Fig. 3 RMSEP values obtained from linear regression models of CLS coefficients against mass and volume fractions. RMSEP values were averaged over the 2 components of each binary mixture. | ||
This is not a surprising result, since the degree of non-linearity between mass and volume fractions depends on the density difference between the 2 components in a binary mixture. The contrasting results by Yan et al.,7 who reported similar CLS performance for mass- and volume-based units in quantitative NIR and Raman studies on ternary mixtures, are explained by the small density differences (about 0.1 and 0.2 kg L−1) between the components in the ternary mixtures (benzene–cyclohexane–ethylbenzene and ethyl acetate–1-heptanol–1,4-dioxane, respectively) that they studied. At such low density differences between solvents, the degree of non-linearity between mass and volume fractions is only small and therefore only small differences between RMSEPmass and RMSEPvolume are observed (Fig. 4).
3.3 PLS calibration results
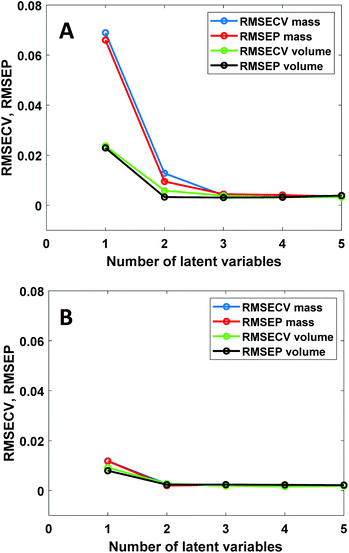
PLS regression is nowadays by far the most often used multivariate calibration method for quantitative vibrational spectroscopy. It is therefore of interest to investigate how PLS deals with the non-linear relation between spectral intensities and mass fractions. Fig. 5 shows PLS results for the NIR data of the chloroform–toluene and toluene–heptane systems.In the chloroform–toluene system with a large density difference (Fig. 5A), volume-based models only require 2 latent variables (LVs) to reach low RMSECV and RMSEP values, whereas mass-based models require 3 LVs to obtain such values. Thus, the non-linearity between NIR absorbance and mass-fraction leads to an increased number of LVs. This is expected due to the bilinear nature of the PLS method. In contrast, in the toluene–heptane system with much lower density difference (Fig. 5B), the RMSECV and RMSEP values at 1 and 2 LVs are very similar for mass- and volume-based models. These results are in agreement with the CLS results (vide supra) and prove that the use of mass-based concentration units in PLS regression leads to increased model complexity, which can be avoided by using volume-based units instead. Inspection of the PLS model loading weights (data not shown) reveals very similar spectral differences (i.e., peak shifts) between the loading weights as observed in the principal components from PCA (Fig. 1B), indicating that PLS uses such spectral non-ideality in higher LVs to decrease model error. The contribution of this effect is more prominent in mass-based models because the variance explained by LV1 in the concentration data is lower in that case than in models using volume-based concentration units. Note that unlike PLS, CLS cannot deal with peak shifts because in CLS each mixture spectrum is fitted with a combination of fixed pure component spectra. RMSEP values obtained by CLS are therefore larger than those obtained from PLS using 2 or more LVs.
To quantify the relative errors that are made in PLS modeling when using mass fractions instead of volume fractions, we simulated mixture spectra as noise-free Gaussian peaks scaling in intensity with volume fraction for 15 binary solvent systems with varying density differences (ESI†). PLS models were subsequently developed using mass fractions as reference data. Only 1 LV can be obtained for this error-free system because the first LV already accounts for 100% of the variance in the spectral data. Fig. 6 shows the resulting RMSECV errors expressed relative to the mean of the relevant mass fraction range. It is clear from these results that large errors up to 10–15% are made when both the density difference between the 2 components and the fraction ranges are high.
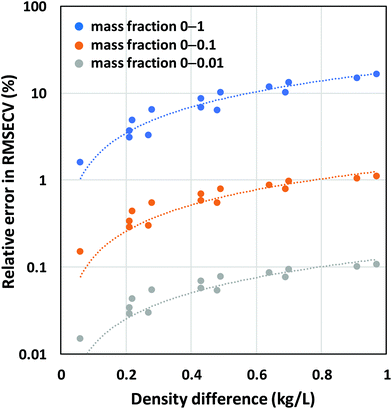 | ||
| Fig. 6 Relative errors obtained by PLS using mass fractions as reference data and simulated Gaussian peaks scaling in intensity with volume fractions as spectral data. | ||
4 Conclusions
We have demonstrated that NIR, Raman, and MIR spectroscopy are linearly related to volume-based concentration units, confirming the previous report by Mark et al.5,6 and extending their conclusion about NIR spectroscopy to MIR and Raman spectroscopy. Unnecessary calibration errors (extending up to 15% at high density differences and high analyte concentrations) are made when using mass-based units for quantitative vibrational spectroscopy, due to non-linearity between mass- and volume-based units, caused by density differences between mixture components. The implication of using mass-based units for PLS regression is that additional LVs will be required, which increases the risk of overfitting and reduces model robustness. Based on our results, it is recommended to use volume-based concentration units for optimal spectroscopic calibration of liquid solutions.Author contributions
Henk-Jan van Manen: conceptualization, methodology, data curation, investigation, formal analysis, visualization, supervision, project administration, writing – original draft. Jan Gerretzen: conceptualization, methodology, data curation, investigation, formal analysis, writing – review and editing. Martijn Smout: methodology, investigation, resources, writing – review and editing. Geert Postma: writing – review and editing. Jeroen J. Jansen: methodology, supervision, writing – review and editing.Conflicts of interest
There are no conflicts to declare.Acknowledgements
René van Egdom and Ali Ghamati (Nouryon Chemicals B.V.) are acknowledged for experimental assistance with recording MIR spectra and helping to develop the high-throughput spectroscopic measurement methodology, respectively. We thank Eva M. Reingruber for insightful comments to the manuscript.References
- P. Griffiths and J. M. Chalmers, Handbook of Vibrational Spectroscopy, John Wiley & Sons, Chichester, 2002 Search PubMed.
- J. Coates, Classical Methods of Quantitative Analysis, in Handbook of Vibrational Spectroscopy, ed. P. Griffiths and J. M. Chalmers, John Wiley & Sons, Chichester, 2002, pp. 2235–2257 Search PubMed.
- B. C. Smith, Quantitative Spectroscopy: Theory and Practice, Academic Press, San Diego, 2002 Search PubMed.
- H. Mark, Quantitative Spectroscopic Calibration, in Handbook of Vibrational Spectroscopy, ed. P. Griffiths and J. M. Chalmers, John Wiley & Sons, Chichester, 2002, pp. 2258–2275 Search PubMed.
- H. Mark, R. Rubinovitz, D. Heaps, P. Gemperline, D. Dahm and K. Dahm, Comparison of the Use of Volume Fractions with Other Measures of Concentration for Quantitative Spectroscopic Calibration Using the Classical Least Squares Method, Appl. Spectrosc., 2010, 64, 995–1006 CrossRef CAS PubMed.
- H. Mark and J. Workman Jr., Chemometrics in Spectroscopy, Academic Press, London, 2nd edn, 2018 Search PubMed.
- H. Yan, Y. Ma, Z. Xiong, H. W. Siesler, L. Qi and G. Zhang, Quantitative Analysis of Organic Liquid Three-Component Systems: Near-Infrared Transmission versus Raman Spectroscopy, Partial Least Squares versus Classical Least Squares Regression Evaluation and Volume versus Weight Percent Concentration Units, Molecules, 2019, 24, 3564 CrossRef CAS PubMed.
- T. G. Bissell, G. E. Okafor and A. Q. Williamson, Enthalpies and volumes of mixing of alkanes with carbon tetrachloride, chloroform, and methylene chloride at 25 °C, J. Chem. Thermodyn., 1971, 3, 393–399 CrossRef CAS.
- R. P. Rastogi, J. Nath and R. R. Misra, Thermodynamics of weak interactions in liquid mixtures of chloroform and aromatic hydrocarbons, J. Chem. Thermodyn., 1971, 31, 307–317 CrossRef.
- A. Qin, D. E. Hoffman and P. Munk, Excess Volume of Mixtures of Alkanes with Aromatic Hydrocarbons, J. Chem. Eng. Data, 1992, 37, 61–65 CrossRef CAS.
- J.-P. E. Grolier and G. C. Benson, Thermodynamic properties of binary mixtures containing ketones. VIII. Heat capacities and volumes of some n-alkanone+n-alkane mixtures at 298.15 K, Can. J. Chem., 1984, 62, 949–953 CrossRef CAS.
- M. A. Czarnecki, Y. Morisawa, Y. Futami and Y. Ozaki, Advances in Molecular Structure and Interaction Studies Using Near-Infrared Spectroscopy, Chem. Rev., 2015, 115, 9707–9744 CrossRef CAS PubMed.
- Q. Li, N. Wang, Q. Zhou, S. Sun and Z. Yu, Excess Infrared Absorption Spectroscopy and Its Applications in the Studies of Hydrogen Bonds in Alcohol-Containing Binary Mixtures, Appl. Spectrosc., 2008, 62, 166–170 CrossRef CAS PubMed.
- M. Besemer, R. Bloemenkamp, F. Ariese and H.-J. van Manen, Identification of Multiple Water−Iodide Species in Concentrated NaI Solutions Based on the Raman Bending Vibration of Water, J. Phys. Chem. A, 2016, 120, 709–714 CrossRef CAS PubMed.
- I. Noda, A. E. Dowrey, C. Marcott, G. M. Story and Y. Ozaki, Generalized Two-Dimensional Correlation Spectroscopy, Appl. Spectrosc., 2000, 54, 236A–248A CrossRef CAS.
- I. Noda, Recent advancement in the field of two-dimensional correlation spectroscopy, J. Mol. Struct., 2008, 883–884, 2–26 CrossRef CAS.
- M. A. Czarnecki, Two-Dimensional Correlation Analysis of Hydrogen-Bonded Systems: Basic Molecules, Appl. Spectrosc. Rev., 2011, 46, 67–103 CrossRef CAS.
- C. Mello, T. Mello, E. Sevéri, L. Coelho, D. Ribeiro, A. Marangoni, R. J. Poppi and I. Noda, Microstructures formation in a seemingly ideal homogeneous mixture of ethanol and methanol: An experimental evidence and two-dimensional correlation spectroscopy approach, J. Chem. Phys., 2009, 131, 084501 CrossRef PubMed.
- W. Wrzeszcz, P. Tomza, M. Kwaśniewicz, S. Mazurek, R. Szostak and M. A. Czarnecki, Microheterogeneity in binary mixtures of methanol with aliphatic alcohols: ATR-IR/NIR spectroscopic, chemometrics and DFT studies, RSC Adv., 2016, 6, 37195–37202 RSC.
- P. Tomza, W. Wrzeszcz and M. A. Czarnecki, Tracking small heterogeneity in binary mixtures of aliphatic and aromatic hydrocarbons: NIR spectroscopic, 2DCOS and MCR-ALS studies, J. Mol. Liq., 2019, 276, 947–953 CrossRef CAS.
- J. Kiefer and K. Eisen, Unsupervised Screening of Vibrational Spectra by Principal Component Analysis for Identifying Molecular Clusters, ChemPhysChem, 2018, 19, 795–800 CrossRef CAS PubMed.
Footnote |
| † Electronic supplementary information (ESI) available. See DOI: 10.1039/d1an00151e |
| This journal is © The Royal Society of Chemistry 2021 |


