Analysis of historical dyes in heritage objects
Analytical Methods Committee, AMCTB No. 101
First published on 27th January 2021
Abstract
Dye analysis can considerably enhance our understanding of the provenance of materials used in the production of historical objects. Knowledge of the individual constituents of any dyestuff not only facilitates its identification, but also provides important information regarding the rate of photo-degradation of the dye’s components; this can in turn support decisions regarding conservation and display. This Technical Brief outlines the principal analytical methods used in dye and mordant analysis, by explaining how to select the most appropriate experimental conditions and describing the types of instrumentation available.
Natural dyes have been used since antiquity to colour fabrics and to prepare painting materials. Until the dawn of synthetic dyestuffs in the 1850s, historical dye sources were of plant or animal origin, exhibiting compositions that relate to particular species. According to their method of application, dyes belong to three main categories:
• direct dyes (e.g., safflower, curcumin) are applied directly to the substrate (animal, vegetable or synthetic in origin);
• mordant dyes (e.g., weld, madder) where the dye is fixed through the use of a mordant (a chemical that combines with the dye and the fibre); these comprise the vast majority of natural dyes; and,
• vat dyes (e.g., indigo) in which a process is used which solubilises the dye and allows it to impregnate the substrate.
Only a small amount of dye is needed to colour a substrate, and only small primary samples (typically 1–2 mg) can be analysed when examining historical objects. It is important to note that the ‘primary’ sample is the mass taken from the ‘sampling target’ (e.g. the garment), rather than the mass used for the measurement process (i.e. the test portion taken from the laboratory sample). Furthermore, samples are often rendered more complex by the presence of dyestuff degradation products, which make their analysis challenging.
The most popular and successful analytical technique is liquid chromatography (LC) separation coupled with the detection of individual components either by their molecular absorption (e.g. using a photodiode array (PDA)) or by their mass spectra (e.g. using electrospray ionization mass spectrometry (ESI-MS)).1,2 These methods have been used for the past 30 years.
What can dye analysis tell us?
Types of dyestuffs
Analysis reveals the types of dyestuffs used (direct, mordant, vat), and gives an indication of whether over-dyeing or mixtures were used. The presence of a specific dye (e.g. cochineal) might provide new information on trade routes and exchanges. The presence of light sensitive dyes (e.g. safflower, turmeric) will suggest suitable designs for a rotation plan and display conditions, while the characterisation of a synthetic dye might help to date a restoration or suggest the presence of a fake.Types of mordants
Mordants (usually substances containing aluminium, copper, iron or tin) are used to improve the light fastness of the dyes through the creation of a mordant–fibre complex or a dye–mordant–fibre complex. The choice of the mordant is important in textile preparation as it greatly affects the final colour of the textile: for example, copper salts will darken the colour of the dye, while tin salts will brighten it.In conjunction with detailed knowledge of trade routes and available materials, dye analysis can help to identify a date of manufacture or repair, and provide geographical limits for the object’s origin.3,4
Selecting the best analysis protocol
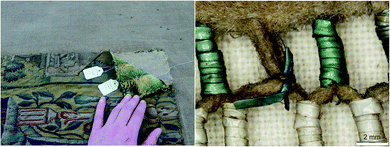
Dye analysis has been conducted on cultural heritage materials including wool, silk, linen and cotton yarns, but also more unusual materials such as porcupine quills, barkcloth, and easel and mural paintings. The ease with which a sample can be obtained depends on the type of object. It can be a straightforward process (e.g. using loose ends on tapestries, better preserved and less faded as they are on the back) (Fig. 1). Sampling can be harder with ethnographic materials where broken pieces may be retrieved during restoration or it can be sometimes almost impossible when dealing with easel paintings. The nature of the substrate affects how the dyestuff is fixed, and in turn, this can cause variations in the dye ‘fingerprint’.Before dyes can be analysed it is usually necessary for the analyst to extract the dyestuffs from their textile substrate. This requires the use of a solvent to break the dye–mordant–fibre complex. Until recently, extraction using concentrated hydrochloric acid with methanol and water was widely used. The main advantage of this method is that the sample is completely broken down during the extraction process, thereby maximising the yield of extracted material. However, its main drawback is the chemical modification or complete degradation of the substances in the sample, which can hinder the identification of a specific dye source. In recent years, several alternative procedures have been developed using milder extraction methods,5 still based on aqueous solutions of acids mixed with solvents. Vat dyes (indigoids from indigo, bromo-indigoids from shellfish purple) are a category apart and specifically require extraction using the polar solvents dimethyl sulfoxide or dimethylformamide.1 Finally, paint substrates require a derivatization procedure which releases the trapped pigment from the binding medium and then de-complexes the dye from the pigment. This can be achieved using methylation with boron trifluoride/methanol.1
Dyestuff analysis
Liquid chromatography
Reverse-phase LC is the most suitable technique to investigate dye sources, as the majority of the molecules with chromophores are polar and water-soluble compounds. The separation of most natural and synthetic dyes is obtained using a combination of water and an organic modifier (methanol or acetonitrile) as the eluant; elution can be performed in either isocratic or gradient modes. The pH at which elution is carried out is controlled either by the use of a constant percentage of a buffer solution, or the addition of an appropriate acid (e.g., formic acid). Recent developments in ultra-high-performance liquid chromatography (UHPLC), together with the development of columns packed with sub-2 μm particles, or core–shell technology, allow increased efficiency and sensitivity of detection, which are important requirements when analysing small or highly degraded samples.Detection
The most suitable detector is a PDA, which can identify chromophores absorbing in the UV/visible spectrum range (210–800 nm) and which the analyst can tune to specific absorption bands in order to detect each type of coloured chromophore: colourless at 254 nm, yellow at 350 nm, red at 485 nm, violet at 550 nm, to blue at 650 nm. The identification of a dye molecule is usually based on its retention time and UV-visible spectrum, while the identification of a specific dye source is based on the presence of a combination of molecular markers, and on the semi-quantitative interpretation of the chromatogram by comparing it with fresh and artificially aged reference samples. More recently, the application of the multivariate statistical techniques of principal component analysis (PCA) and partial least squares regression (PLS) have proven to be successful approaches for extracting information from large and complex data sets. When dealing with complex samples, it is often necessary for the analyst to couple the chromatographic separation of components to a MS to obtain additional information. ESI in positive and negative mode is commonly used to study natural and synthetic dyes to obtain information on their molecular mass (MS spectra) and further fragmentation patterns (MS/MS).Chromatogram interpretation
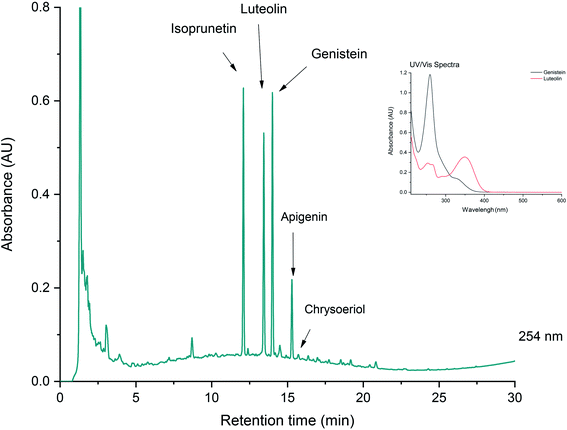
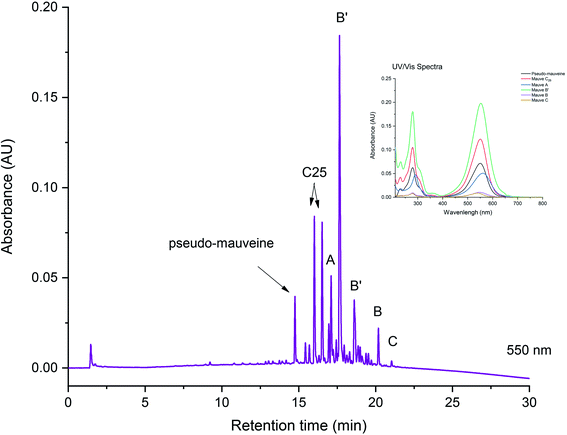
Identifying a dye source on the basis of its chromatogram requires a detailed knowledge of the UV/visible spectra of natural and synthetic dyes. Depending of the type of dyes found, it might be possible to identify a specific dye, or it might only be possible to suggest a dye family. Fig. 2 shows an example chromatogram obtained from a green yarn sample taken from a mid-16th century hand-knotted table carpet. Identified on the chromatogram are a series of flavonoid and isoflavonoid dye components, matching with a reference yarn dyed with dyer’s greenweed (or dyer’s broom, Genista tinctoria).6 The information recovered allows us not only to confirm the dye identification, but also to suggest how the textile was dyed. For example, using successive dyebaths of dyer’s greenweed, an over-dyeing process known to enhance the yellow hues. In this particular case, the relatively high proportion of the isoflavonoids genistein and isoprunetin detected at 254 nm suggests that the textile was not over-dyed. A second vat process was applied to fix the blue dye indigotin (from indigo or woad) to provide a green hue in combination with the yellow dye.Fig. 3 shows the chromatogram obtained from a reference silk dyed with mauve, the first early synthetic aniline dye synthesised by W. H. Perkin in 1856. The dye was extracted using a strong acidic medium and the chromatogram is monitored at 550 nm. The great complexity of the chromatogram coupled with the very similar UV/visible spectra of the different mauve chromophores make it difficult to identify peaks unambiguously with only LC-PDA analysis. In this case, a detailed MS analysis was necessary to identify each mauve component further.
Mordant analysis
There are relatively few studies on mordant analysis; several analytical techniques might be used depending on the possibilities for sampling and the level of sensitivity necessary to detect and/or quantify the mordants. These include energy-dispersive X-ray spectroscopy in a scanning electron microscope (SEM-EDS), X-ray fluorescence (XRF) or particle induced X-ray emission coupled to Rutherford backscattering spectrometry (PIXE-RBS), inductively coupled plasma-mass spectrometry (ICP-MS), and more recently laser-induced breakdown spectroscopy (LIBS).Databases and reference samples
In practice, the identification of dyestuffs is reliant on comprehensive databases obtained through the analysis of pure chemicals, natural and synthetic dye sources, artificial degradation products etc. As each laboratory uses a specific chromatographic methodology for dye analysis, there is no simple go-to database available. Within the FP7 European project CHARISMA (Cultural Heritage Advanced Research Infrastructures: Synergy for a Multidisciplinary Approach to Conservation/Restoration), five laboratories undertaking colourant research have reviewed the literature relating to the extraction of organic colourants from cultural heritage objects to explore the advantages, limitations and wider applicability of the different extraction methods.7 Additional on-line databases have been developed recently.8Pitfalls and drawbacks
Optimising recovery
Despite their advantages in preserving specific structures, mild extraction protocols often result in lower dyestuff recovery than a strong acidic extraction. When dealing with a small unknown sample, the analyst needs to use their experience/knowledge in order to decide upon the best extraction protocols to balance yield versus information. When dealing with a mixture of dyes (e.g. yellow on blue) it might be necessary for the analyst to process a sample using a two-step protocol to extract the dyestuffs selectively and then combine the extracts for analysis.Large number of dyes
There are thousands of natural and synthetic dyes. With regards to natural dyes, major components overlap between species; for example, the flavone luteolin and its associated glycosides will be present in most of the yellow flavonoid dyes. Major and minor components photodegrade, sometimes leaving only one marker component (as for Brazilwood).Unknown compounds
Mystery compounds can be very difficult to identify. In some cases, it might be possible to suggest their structure based on their mass spectrometric fragmentation patterns, by comparison with the fragmentation of known molecules possessing a similar structure. However, in many cases two-dimensional-nuclear magnetic resonance (2D-NMR) will be necessary as an additional tool to aid with structural assignment. This may require the analysis of additional reference materials and repeated peak trapping of compounds of interest after elution to acquire sufficient material. Such an approach was used to help identify a degradation compound, characteristic of Brazilwood species, observed as an unidentified marker in historical samples for almost two decades.Conclusions
Dyestuff identification is integral to a comprehensive understanding of historical objects. Whilst most techniques described in this brief are destructive in nature, the sample requirements have reduced dramatically due to improvements in chromatographic and MS techniques, making them widely applicable to museum collections. Furthermore, the large range of dyestuffs used historically, combined with the variability induced by their subsequent environmental degradation, means that these techniques are required to provide an accurate identification of the dyestuffs used.Dr Lore Troalen, (National Museums Scotland)
Prof. Alison Hulme, (University of Edinburgh)
This Technical Brief was prepared by the AMC Heritage Science Expert Working Group and approved by the AMC and approved on 30 June 2019.
Further reading
- W. Nowik, Dyes|Liquid Chromatography, in Reference Module in Chemistry, Molecular Sciences and Chemical Engineering, ed. J. Reedijk. Elsevier, 2013, pp. 2602–2618, DOI:10.1016/B978-0-12-409547-2.04724-7.
- I. Degano and J. La Nasa, Trends in High Performance Liquid Chromatography for Cultural Heritage, in Analytical Chemistry for Cultural Heritage, ed. R. Mazzeo, Topics in Current Chemistry Collections, Springer, Cham, 2017, pp. 263–290, DOI:10.1007/978-3-319-52804-5_8.
- D. Cardon, Natural Dyes - Sources, Tradition, Technology and Science, Archetype Publications, London, 2007 Search PubMed.
- E. S. B. Ferreira, H. McNab, A. N. Hulme and A. Quye, The natural constituents of historical textile dyes, Chem. Soc. Rev., 2004, 33, 329–336, 10.1039/B305697J.
- J. Wouters, C. M. Grzywacz and A. Claro, A Comparative Investigation of Hydrolysis Methods to Analyze Natural Organic Dyes by HPLC-PDA – Nine methods, twelve biological sources, ten dye classes, dyed yarns, pigments and paints, Stud. Conserv., 2011, 56, 231–249, DOI:10.1179/204705811X13110713013353.
- L. G. Troalen, A. S. Phillips, D. A. Peggie, P. E. Barran and A. N. Hulme, Historical textile dyeing with Genista tinctoria L.: a comprehensive study by UPLC-MS/MS analysis, Anal. Methods, 2014, 6, 8915–8923, 10.1039/c4ay01509f.
- Mild extraction methods for organic colorant analysis - A bibliographic reference database, http://research.ng-london.org.uk/scientific/colourant/.
- The Boston Database of Natural Dyestuffs, http://www.dyeanalysislcms.net/.
| This journal is © The Royal Society of Chemistry 2021 |


